 Zugan Qin†
 Zhihong Dong
 Lijia Cheng
 Zheng Shi
- School of Basic Medical Sciences, Clinical Medical College, Affiliated Hospital, Mechanical Engineering College of Chengdu University, Chengdu, China
Objective: To explore the mechanical properties, biological activity, and osteogenic ability of 3D printed TC4 titanium (Ti) alloy dental implants treated with surface modification.
Methods: Dental implants with 30% porosity were manufactured using selective laser melting (SLM) technology (group 3D), while traditional numerically-controlled machine tools (CNC) were used to manufacture implants without porosity (group SL). The implants were then surface modified through sandblasting and acid etching (groups 3DA1 and SLA1), and then alkali etching (groups 3DA2 and SLA2). The physicochemical properties of the implants were measured using a Vickers hardness instrument, scanning electron microscope (SEM), X-ray diffraction (XRD), energy dispersive spectrometer (EDS), and profilograph before and after surface modification. Next, the biocompatibility, bioactivity, and osteogenic ability of the implants were evaluated using apatite deposition experiments, alkaline phosphatase (ALP) activity, and semiquantitative analysis of extracellular matrix mineralization.
Results: There were significant differences in morphology, geometric accuracy, mechanical properties, surface roughness, and hydrophilicity between groups 3D and SL. Furthermore, surface modification improved the physicochemical properties of the porous implants. Implants with sandblasting, acid etching, and alkali etching demonstrated better biocompatibility, bioactivity, and osteogenic ability than implants without surface modification in both groups 3D and SL. Additionally, the implants of groups 3D have higher bioactivity than that of groups SL.
Conclusion: Surface modification and the macroporous structure of implants can improve their bioactivity and osteogenic ability, enhancing the application of Ti alloy dental implants.
1 Introduction
Compared with traditional dental inlay technology, dental implants offer several advantages. They do not need to damage the adjacent teeth, and are more durable, aesthetically pleasing, and health and stable than traditional inlaid teeth (Patil et al., 2020). Aa a result, they have gradually become the preferred option for oral edentulous restoration (Oshida et al., 2010; Elani et al., 2018; Castellanos-Cosano et al., 2019). However, the implant due to fracture, loosening, or detachment can limit their lifespan (Sailer et al., 2022).
To address these issues, TC4 titanium (Ti) alloy (Ti-6Al-4V) is widely used in dental implant manufacturing due to its excellent comprehensive properties (Srivastava and Pal, 2018; Xie et al., 2020; Glied and Mundiya, 2021). However, owing to excessive stiffness of Ti alloy, bone loss around the implant often occurs due to mismatch of stiffness after being implanted (Kim et al., 2019), it would loosen the implants which has been tightly integrated with natural bone. Furthermore, the surface of the Ti alloy shows biological inertia, which prevents chemical bonding between implant and alveolar bone. These shortcomings are considered as the primary cause of Ti alloy implant failure (Van Noort, 1987), which can be solved by using porous implants with appropriate porosity (Liang et al., 2021; Morris et al., 2021). However, it is crucial to take into account the mechanical properties of the weight-bearing area, as excessive porosity can make the implants inadequacy (Yamanoglu et al., 2021). Bandyopadhyay et al. (2010) found that porous Ti alloy structures containing 23–32 vol% porosity showed modulus equivalent to human cortical bone; they also indicated that porosity played an important role to establish early stage osseointegration forming strong interfacial bonding between the porous implants with 25 vol% porosity and the surrounding tissue (Bandyopadhyay et al., 2017). Vasconcellos et al. (2010) showed Ti implants with 30%–40% porosity were conducive to osteogenic differentiation and bone tissue growth. The 3D printing technology has become a feasible solution for building complex structures, due to its strong personalized manufacturing capability (Jamróz et al., 2018; Rezaie et al., 2023). Selective laser melting (SLM) technology is often used in metal manufacturing techniques, and the product performance depends on the rationality of process parameters. Previous researches have shown that surface modification is necessary to further improve the mechanical and biological activity of Ti alloy implants, regardless of whether they are manufactured by conventional manufacturing technology or 3D printing (Wang et al., 2020; Liang et al., 2021; Xu et al., 2022). The most commonly used surface modification methods include sandblasting, acid etching, alkali etching, and their combination, which have been proven to have better effects in previous experiments (Cervino et al., 2019; Liang et al., 2021; Demirci et al., 2022).
In this study, we will fabricate dental implants with 30% porosity using SLM technology, while traditional numerically-controlled machine tools (CNC) were used to manufacture implants without porosity. The mechanical properties, biocompatibility, bioactivity, and osteogenic ability of the implants will be detected to compare the effects of different manufacturing methods and the impact of surface modification on dental implants.
2 Materials and methods
2.1 Materials
2.1.1 Materials preparation
The completed computer aided design (CAD) data models (Figures 1A, B) have been built for manufacturing of dental implants using Ti alloy, the raw materials of Ti alloy were shown in Table 1. The details of the parameters were shown in Figures 1C, D. The implants without porosity were made with CNC (group SL), while the implants with 30% porosity were made of SLM (EOS GmbH, Munchen, Germany, group 3D). The main process parameters of SLM used for manufacturing dental implants are as follows: a powder thickness of 30 μm, a laser diameter of 100 μm, a scanning speed of 960 mm/s, and a laser power of 290 W, within an atmosphere full of argon gas. To eliminate any internal thermal stress, we carried out annealing on the completed samples of the 3D printed implants (Deng et al., 2021). The finished manufacturing sample was placed in a high-temperature tube furnace and heated to 800°C under argon gas for a duration of 2 h. The furnace was then allowed to cool to room temperature, completing the annealing process.
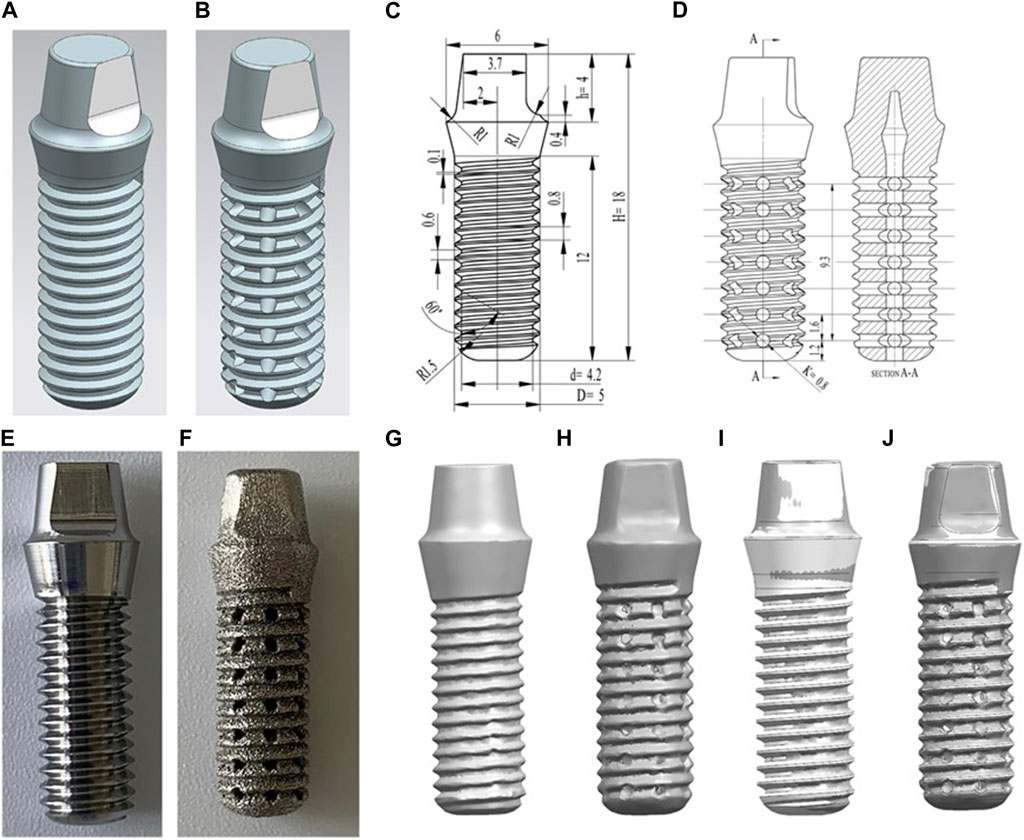
FIGURE 1. (A) The design data model of the SL samples. (B) The design data model of the 3D samples. (C) Technical drawings of the SL samples. (D) Technical drawings of the 3D samples. (E) Appearance of SL samples. (F) Appearance of 3D samples. (G–J): comparison of the point cloud data obtained by scanning the manufactured implant and the implant model built before manufacturing. (G) 0% samples scanning point cloud; (H) 30% product point cloud; (I) Comparison of 0% product point cloud and data model; (J) Comparison of 30% product point cloud and data model.

TABLE 1. Composition of TC4 titanium alloy raw materials (wt%).
2.1.2 Surface modification
The SL and 3D samples were performed with surface modification, respectively. The SLA1 and 3DA1 samples were treated with sandblasting and acid etching, respectively; the SLA2 and 3DA2 samples were obtained through alkali etching of SLA1 and 3DA1 samples. The details of surface modification in the six groups are listed in Table 2.

TABLE 2. The different surface modification based on SL and 3D samples.
Sand blasting: the Al2O3 sand particles with an average size of 50 µm were used, and the samples are sprayed for 40 s under a pressure of 0.4 MPa. Acid etching: 18% HCl and 48% H2SO4 were mixed in a volume ratio V:V = 1:1, and then the samples were put into the mixed solution for 30 min at 25°C. Alkali etching: the samples were put into the sodium hydroxide aqueous solution with a concentration of 5 mol/L for 24 h at 60°C (Matos et al., 2022).
2.2 Material characteristics
2.2.1 Geometric accuracy measurement
In order to evaluate the accuracy of the manufactured samples, a high-precision vernier caliper was used to measure certain geometric dimensions of both the SL and 3D samples, and compared them to the design digital models. The volume (V) of the sample was measured by Archimedes drainage method with absolute ethyl alcohol, and the mass (M) was measured by high-precision electronic scale to calculate the density (ρ). The 3D scanner (GOM ATOS Q Zeiss, Germany) was used to scan the outer surface of SL and 3D samples to obtain the geometric data of the sample, to reconstruct the three-dimensional model of the completed sample. The scanned point cloud data were imported into the CAD software and compared with the data model before processing, to evaluate the geometric defects and accuracy of processing and manufacturing.
2.2.2 Vickers hardness
In order to ensure proper functionality as a replacement for tooth roots, implants must possess sufficient stiffness. Therefore, the macro hardness of both the SL and 3D samples were measured by Vickers hardness tester (VL500 KEYENCE, Japan). The measurement process involved cutting and polishing the dense portions of the SL and 3D samples using sandpaper separately. Diamond points were then punched on the Ti alloy plane with the Vickers, and the diagonal distance of the diamond points was measured under a microscope to determine the hardness value. The SL sample was directly measured, while the dense part of 3D sample in porous structure was cut by wire-electrode cutting to eliminate the influence of porous structure on the measured hardness value. The load was set to 10 kg, which was loaded for 15 s. Three samples were selected from each group, and each sample was measured seven times independently.
2.2.3 Metallographic structure
The samples cut from the SL and 3D implants in the previous steps were inlaid, smoothed, polished and corroded successively, and then the metallographic microscope (Leica, Germany) was used to observe the difference in the metallographic structure of the samples processed by different methods. The aim was to investigate the internal causes for the distinction in mechanical properties between SL and 3D implants.
2.2.4 Surface morphology and composition
The SL, SLA1, SLA2, 3D, 3DA1 and 3DA2 samples were put into field emission scanning electron microscope (SEM, Ultra Carl Zeiss AG, Germany) to observe the surface morphology. The samples were amplified 4,000 to 30,000 times to observe the surface topography at the micro and nano levels. The surface composition of the sample was measured by energy dispersive spectrometer (EDS).
The X-ray diffractometer (XRD, Bruker ADVANCE D8, Germany) was used to detect the surface phase of the samples. The scanning parameters were set to a power of 1,600 W, voltage of 40 kV, current of 40 mA, the scanning range (2θ) of 10°–90°, and a scanning speed of 0.25 s/step with a step of 5000. Since XRD can only be used to detect the surface of flat solid materials, the dental implants must be cut to obtain flat XRD samples. The XRD measured data were analyzed by Jade 9.0 and compared with the PDF 2020 card library.
2.2.5 Surface roughness
The surface roughness values of samples in the six groups were measured by a profilometer (E-35B Accretech, Japan). Fix the round implant with plasticine, select the flat part on the implant and align it with the 10
2.2.6 Mechanical properties
To verify the compressive strength of the dental implants before and after surface modification based on the standard of American Society of Testing Materials (ASTM) F67-13 (2020), a universal testing machine (ZWICK, CMT4305, Germany) was employed. The specific method involves placing the implant specimen in an upright position on a testing platform, with the base of the implant specimen facing upwards and the bottom of the body facing downwards, and ensuring that it is placed steadily. The testing machine is then controlled to descend at a uniform speed of 0.01 mm/s until the implant specimen is fractured, and the data of pressure-displacement is output. The fracture surface of the implant was observed under SEM (Ultra Carl Zeiss AG, Germany) to analyze the form of the compression fracture.
2.3 Apatite deposition experiment in vitro
2.3.1 Body fluid simulation
The simulated body fluid (SBF) solution was prepared based on previous studies (Baino and Yamaguchi, 2020). The cleaned samples were sterilized in a high-pressure steam pot. Next, 250 mL of SBF solution was added into the beaker, which was incubated at 37°C for 10 days, and the SBF solution was replaced every 48 h to simulate the renewal time interval of human body fluid. The replaced SBF solution was collected for subsequent detection in all groups.
After 10 days, all samples were washed gently with distilled water and then placed in the oven at 37°C, until the samples were dried completely. The ion sputtering was conducted on the dried sample for 45 s to increase the conductivity of the sample. The deposits on the sample surface were observed by SEM. The composition of the sediment on the sample surface was detected by EDS. The sediments of calcium (Ca) and phosphorus (P) elements presented on the sample surface were measured. 3DA2 samples were selected and crystal composition changes on the sample surface were measured using XRD.
2.3.2 Quantitative analysis of Ca and P concentration
The Ca and P concentration in SBF solution soaked with implants for 10 days were measured. The concentration of Ca was determined by Ethylene Diamine Tetraacetie Acid (EDTA)-Na2 complexometric titration (pH12-14). The concentration of P was determined by the vanadium molybdate yellow colorimetric method (UV-1201V spectrophotometer, Shimadzu Corporation, Kyoto, Japan).
2.4 Cell experiments in vitro
2.4.1 Isolation and culture of rat bone marrow mesenchymal stem cells
Rat bone marrow mesenchymal stem cells (BMSCs) were obtained from the bone marrow of two-week-old rats. The femur and tibia of the post-euthanized rats were then dissected. A small amount of α-minimum essential medium (MEM) medium (GIBCO, United States) was used to wash out the cells from rat bone marrow, the cells were collected by centrifugation repositioned in α-MEM medium containing 10% fetal bovine serum (FBS, GIBCO, United States) and antibiotics (1% 100 μg/mL penicillin, 100 μg/mL streptomycin), and then incubated at 37°C in a humidified atmosphere with 5% CO2. The culture medium was replaced every 3 days. When adherent cells grew to more than 80% confluence, the BMSCs were sub-cultured with 0.25% trypsin (Sigma, United States). Cells passed to fifth generation were used for further cell experiments.
The BMSCs with 5 ×10⁴ density was directly inoculated on the implants in 24-well plates (nest, United States) and cultured for 1 day. Then, the implant was moved into a new 24-well plate to discard cells adhering to the plate instead of implants.
The rats were euthanized in compliance with NIH guidelines on the care and use of laboratory animals, under the supervision of a licensed veterinarian. Placed a piece of paper in the anesthesia box (with the interface), put a rat into the anesthesia box, and covered the seal. Connected the CO2 gas cylinder and the anesthesia box with a transparent hose, and passed the CO2 gas into the anesthesia box to observed the rats until it had no breathing and heartbeat. The study has been approved by the Animal Care and Use Committee of Chengdu University.
2.4.2 Cell morphology
The morphology of cells on the implant were observed by SEM at 24 h. 5 × 10⁴ BMSCs were inoculated on 3D, 3DA2, SL and SLA2 for 24 h, then the implants were taken out and gently rinsed with phosphate buffer solution (PBS, Hyclone, United States). The sample was placed in the 2.5% glutaraldehyde for 2 h. Before scanning, cells were dehydrated, dried, and sputtered with ions. The morphology of adherent cells on the implants was observed by SEM.
2.4.3 Cell proliferation
BMSCs were seeded in 24-well plate with a density of 1 × 10⁴ cells per well, the culture medium was changed every 2 days, and cells were cultured for 1, 5 and 10 days, respectively. At each time point, the sample was transferred to a new well washed with PBS, and incubated for 3 h by adding 500 μL cell counting kit-8 (CCK8) solution, and then the solution was transferred to 96-well plates. The optical density (OD) 450 nm absorbance value were determined, three wells of 100 µL were set up in each group. The cells were incubated with calcein-AM and prodium iodide (PI) in the kit for 30 min, and the dead and living cells on the material were observed under an inverted fluorescence microscope with excitation and emission wavelengths of 490 and 515 nm, respectively.
2.4.4 Alkaline phosphatase activity
The precipitated cells were collected on third and seventh days after digestion and stored at −80°C for activity testing, inoculated in 96-well plates for 24 h. The cell precipitation was extracted with 100 µL solution and centrifuged with 1,000 rpm for 10 min at 4°C, and the supernatant was diluted appropriately, and the protein concentration was determined by bicinchoninic acid assay (BCA) method. The microplate reader was preheated for at least 30 min, the wavelength was adjusted to 510 nm.
The alkaline phosphatase (ALP) activity was calculated as the following formula: ALP (U/mgprot) = 0.133 × (A measuring tube-A control tube) ÷ (A standard tube-A blank tube) ÷ Cpr × n (dilution multiple).
2.4.5 Extracellular matrix mineralization
The BMSCs were inoculated in 24-well plate for osteogenesis induction medium for 14 days: 10% FBS, 100 nm dexamethasone (DEX), 100 mm β-Sodium glycerophosphate, 0.2 mm vitamin C (VC), 1% phosphatidylserine (PS). The sample was fixed in 4% paraformaldehyde for 30 min, washed in PBS and dyed in alizarin red solution for 15 min. The mineralized compound was eluted in 1 mL 10% cetylpyridine chloride for 15 min at 37°C. 100 μL of the solution to be tested obtained by elution was transferred to a 96-well plate to detect the absorbance at the wavelength of 562 nm.
2.5 Statistical analysis
For statistical analysis, SPSS 20.0 is used in this study. When the data variance is equal, the ANOVA test is used to follow the normal distribution; otherwise, the normal distribution is used by the nonparametric test, and a p < 0.05 is considered to be statistically significant.
3 Results
3.1 Dental implant manufacturing
There were significant differences in color and structure between groups 3D and SL through visual observation. The SL appeared as bright silver-white with clearly visible structural features, while the 3D appeared as silver-gray with the relatively fuzzy structural features (Figures 1E, F). However, all features of the these samples could be distinguished. The pores of 3D implants had good connectivity and regular shapes; however, their surfaces were rough, showing that the surface finish of 3D printed Ti alloy implants was poor. Therefore, we will polish it with sandpaper for subsequent apatite deposition experiment. While the surfaces of SL were flat. The implants had different geometric accuracy and density with different processing methods (Table 3). The density indicates the severity of pore defects caused by different processing methods.
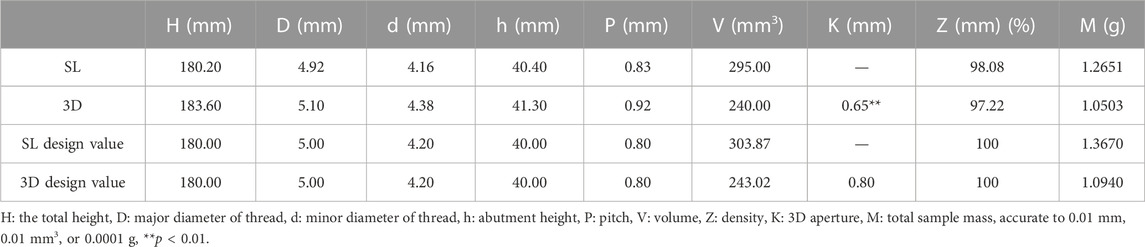
TABLE 3. Geometric dimensions and mechanical properties of materials manufactured by different methods.
Through comparing the point cloud data obtained by scanning the completed sample with the data model built before manufacturing (Figures 1G–J), the materials had high accuracy, there is no obvious warpage or deformation defects. The manufacturing accuracy of 3D thread was lower than that of SL, but the overall manufacturing accuracy was good, so there is no large geometric deviation between the physical object and the digital model.
3.2 Physicochemical characteristics of dental implants
3.2.1 Vickers hardness
There is a significant difference between 3D and SL about the Vickers hardness (Table 4). Due to different processing methods, the Vickers hardness value of group 3D is significantly higher than that of group SL.
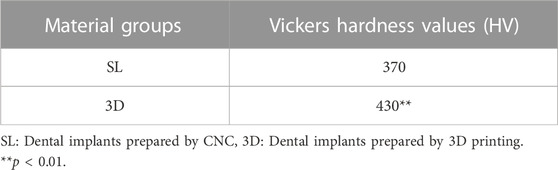
TABLE 4. The Vickers hardness values of SL and 3D implants (accurate to 0.1 HV).
3.2.2 Surface morphology
The micro morphology of SL, SLA1, SLA2, 3D, 3DA1 and 3DA2 samples were observed by SEM (Figures 2A–F), the results showed that the manufacturing method and the surface modification had a significant impact on the microstructure of the implants. Before surface modification, the microstructure characteristics of SL were more accurate than that of 3D. The SL surface presented uniform trace with good overall surface finish. In contrast, the 3D surface was rough, and covered with numerous fine spherical particles. As a result of acid etching, the trace on the surface of SLA1 and spherical particles on the surface of 3DA1 were damaged, and replaced by numerous micron and submicron uneven pits. The 3DA2 and SLA2 obtained by alkali etching grew numerous irregular nanoscale textures on the uneven pits. It is noteworthy that a small number of cracks were observed at the nano layer on the surface of 3DA2 and SLA2.
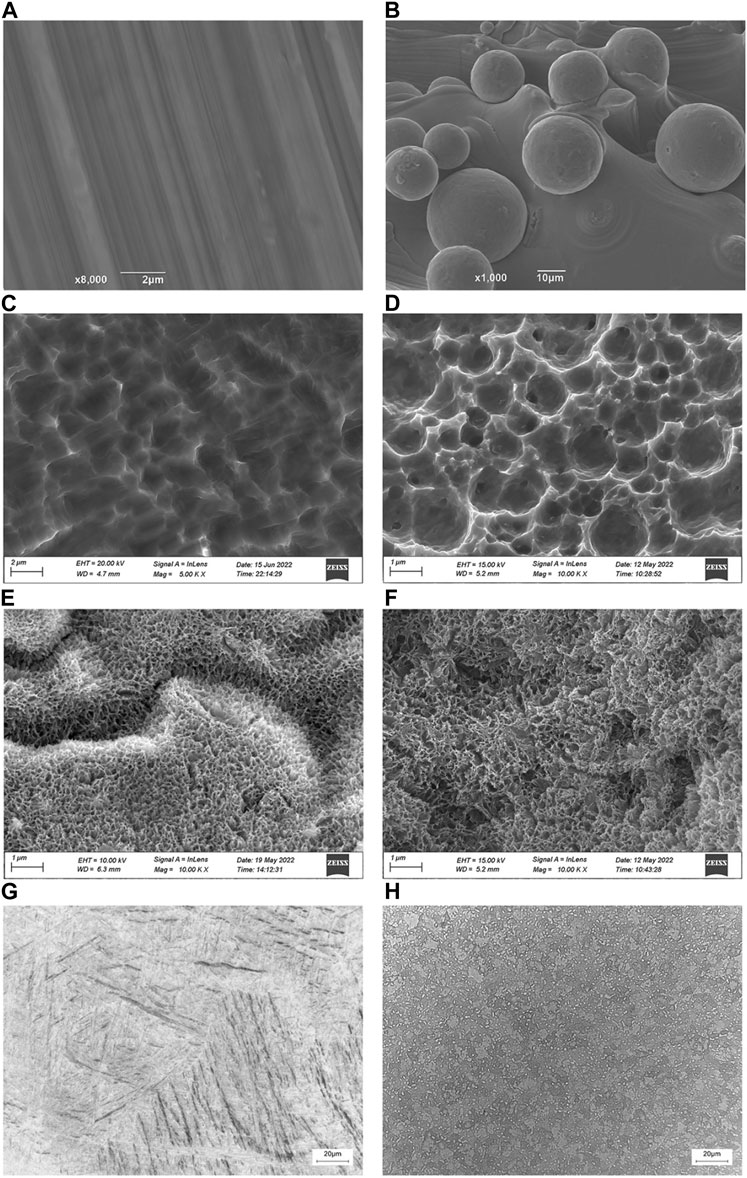
FIGURE 2. (A–F): SEM photos of SL (A), SLA1 (C), SLA2 (E), 3D (B), 3DA1 (D), and 3DA2 (F) implant surface. (G,H): Metallographic structure micrograph of SL (G) and 3D (H) implants.
3.2.3 Metallographic structure
The metallographic structure of the samples processed by different methods was shown in Figures 2G, H. The micrograph revealed that the SL matrix was equiaxed primary α phase and some small block distributed α′ martensite, while the 3D matrix consisted of a small amount of primary α phase, martensite and original β phase boundary.
3.2.4 Material composition
The composition of materials was measured by EDS and XRD in the six groups. The EDS results indicated that the changes of implants before and after surface modification (Figure 3). The main components of the SL and 3D implants were Ti, Al, and V, with a small amount of Fe, C and O. There was no significant difference in the component and contents of each element between groups SL and 3D. Compared with SL and 3D, the oxides on the surfaces of SLA1 and 3DA1 samples were increased significantly, and the Al and V elements were decreased. The reason was that the Al and V elements were partially dissolved in the acidic environment. Compared with SLA1 and 3DA1, the oxide contents on the surface of SLA2 and 3DA2 samples were further increased, Al and V elements were further reduced. Additionally, a certain amount of Na was added on the surface of the implant, with a concentration of approximately 4.9% in SLA2 and 4.5% in 3DA2.
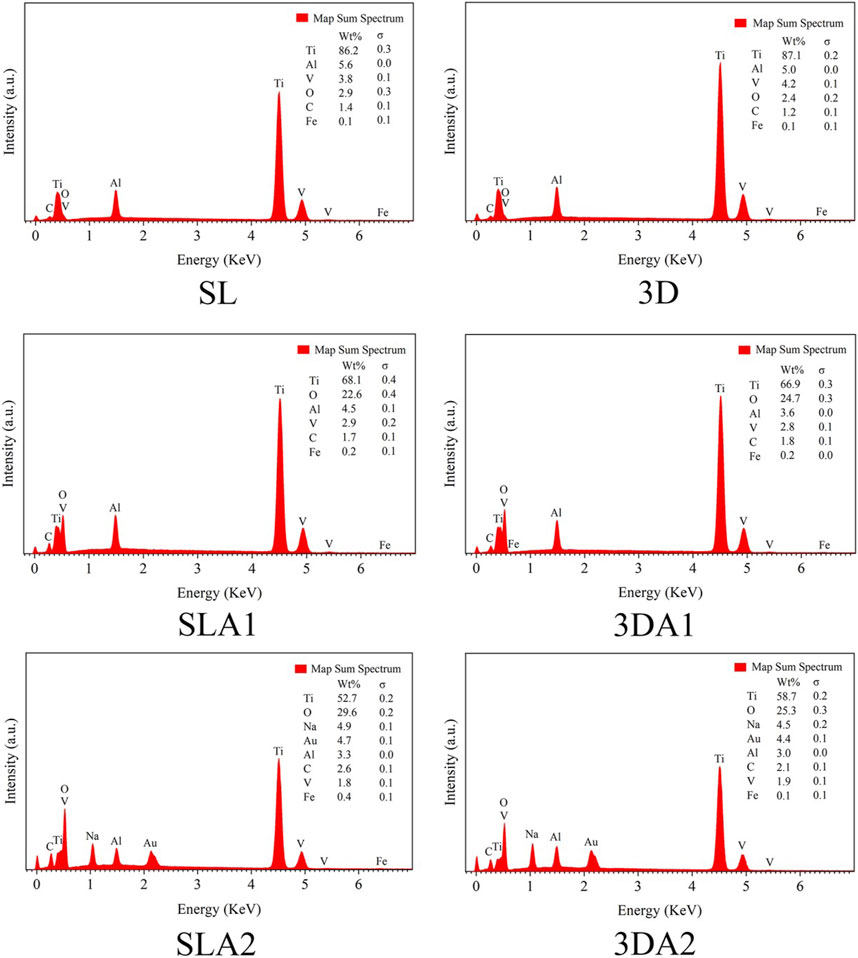
FIGURE 3. EDS photographs of the implant surface obtained with the different surface treatments.
The XRD results showed that the crystal peaks appeared at diffraction angles of about 35°, 39°, 40°, 52.5°, 62.5°, and 70°, which are consistent with the peak diffraction angles of PDF # 01-083-5019, the surface index of crystal corresponding to the card is: (100), (002), (101), (102) and (110), and the phase directed by the standard card is α-Ti (Figure 4). XRD analysis showed that the implant surface of the six groups contained only a single phase α-Ti, and the surface XRD images of the six groups remained basically consistent, with no significant difference in phase. No crystalline oxide was found on the surface of SLA 1 and 3DA1 samples, which suggested that the surface oxide film was too thin and ignored by XRD detection. Additionally, no Na+-containing crystals were found on the surface of SLA 2 and 3DA2 samples, so the Na+-containing compounds generated by alkali corrosion on the surface of Ti alloy samples were judged as irregular substances. XRD analysis indicated that different processing methods, as well as before and after modification, did not alter the implant surface crystal composition.
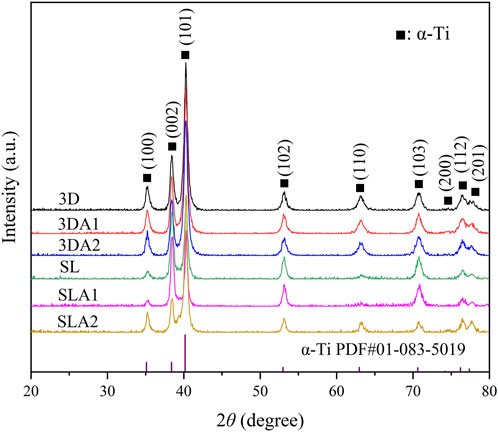
FIGURE 4. The XRD diffraction pattern of the front and rear surfaces of the material modification. All peak types were attributed to α-Ti phase, and the comparative PDF card file number is PDF # 01-083-5019.
3.2.5 Surface roughness
The roughness values of Ti alloy implants showed great differences in the six groups (Figure 5). The morphology of the SL implant had the trace with uniform direction by SEM, and the surface was the smoothest with the average roughness value Ra of 0.31 ± 0.05 µm. In contrast, the trace on the surface of SLA1 were damaged by acid etching, and the average surface roughness value Ra rose to 1.78 ± 0.17 µm. After alkali etching, the trace on the surface of SLA2 completely disappeared, the surface morphology was chaotic, and the average roughness value Ra continued to rise to 2.15 ± 0.18 µm. On the contrary, the 3D surface is scattered with convex particles, and the surface was the roughest with an average surface roughness Ra of 8.45 ± 0.27 µm. After acid etching, the sharp morphology of 3DA1 surface became round, but the peak valley shape was still obvious, and the Ra value dropped to 6.44 ± 0.19 µm. After alkali etching, the surface roughness of 3DA2 was improved, the overall surface morphology was changed, and some peak valley morphologies of 3DA1 samples were retained, and the average surface roughness value Ra decreased to 4.58 ± 0.16 µm. Both 3DA2 and SLA2 surfaces had added subtle and sharp burrs.
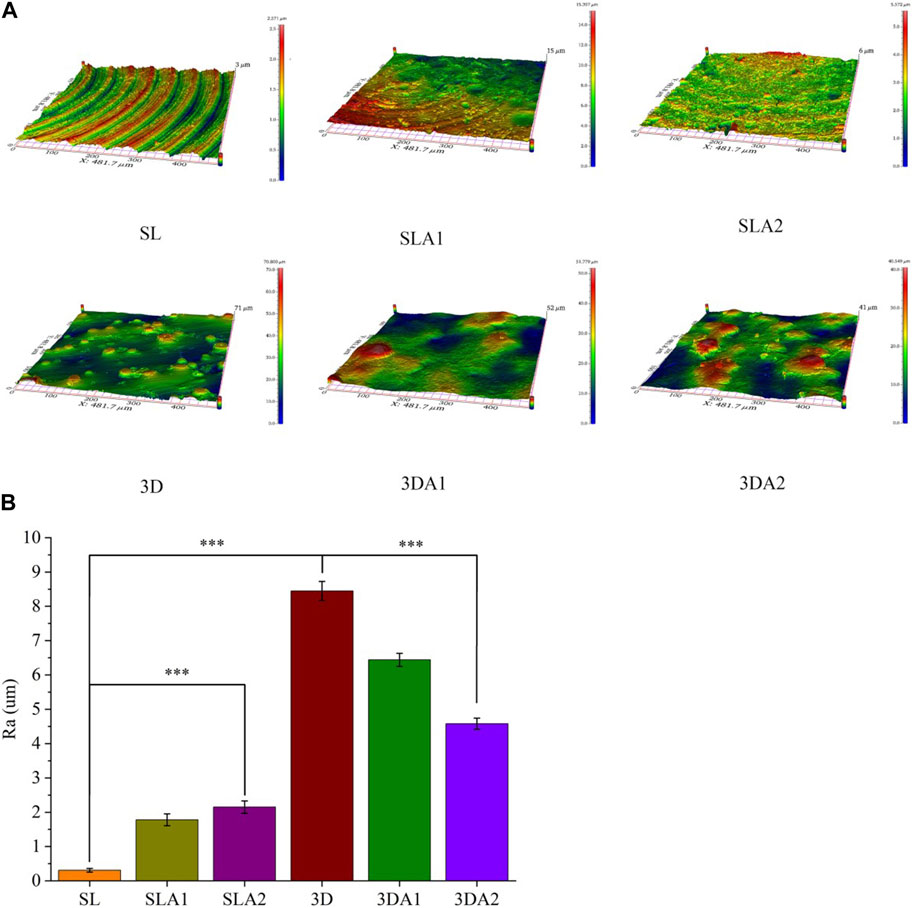
FIGURE 5. (A) 3D photos of implant surface before and after surface modification; (B) The statistical analysis of surface roughness values. Comparison between the two groups, ***p < 0.001.
3.2.6 Surface hydrophilicity
The water contact angle of the implants was measured using a contact angle tester in the six groups (Figure 6). The lower the angle, the better hydrophilicity. Before surface modification, SL had better hydrophilicity than 3D. After acid etching, the surface hydrophilicity of SLA1 and 3DA1 was improved to some extent. After alkali etching, the surface hydrophilicity of SLA2 and 3DA2 continued to improve. Among the six groups, the surface hydrophilicity was worst for 3D implants and best for SLA2 implants.
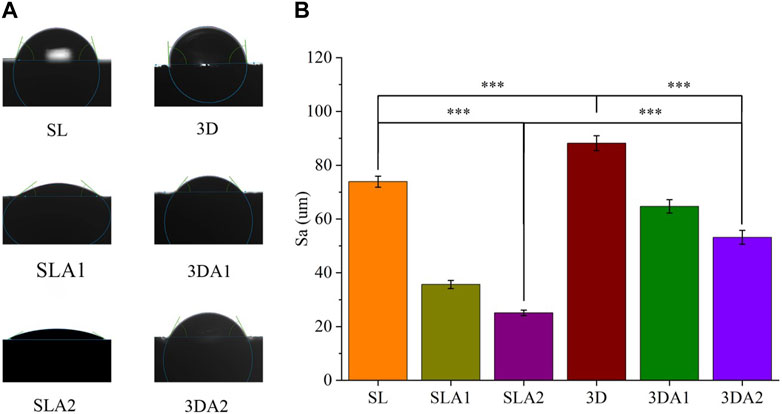
FIGURE 6. (A) Photos and statistics of measured water contact angle of implant surface; (B) The statistics of surface water contact angle. Comparison between the two groups, ***p < 0.001.
3.2.7 Compressive strength
From the stress-displacement curve of the implant, it was observed that at the beginning of the stress phase, the implant underwent elastic deformation (Figure 7A). The compression test results showed that the compressive capacity of SL, SLA1 and SLA2 was significantly higher than that of 3D, 3DA1 and 3DA2, since there was no macro-porous structure in SL groups. The compressive capacity of 3D groups was greatly weakened due to their macro-porous structure. The compressive capacity of the implants was slightly weakened by surface modification.
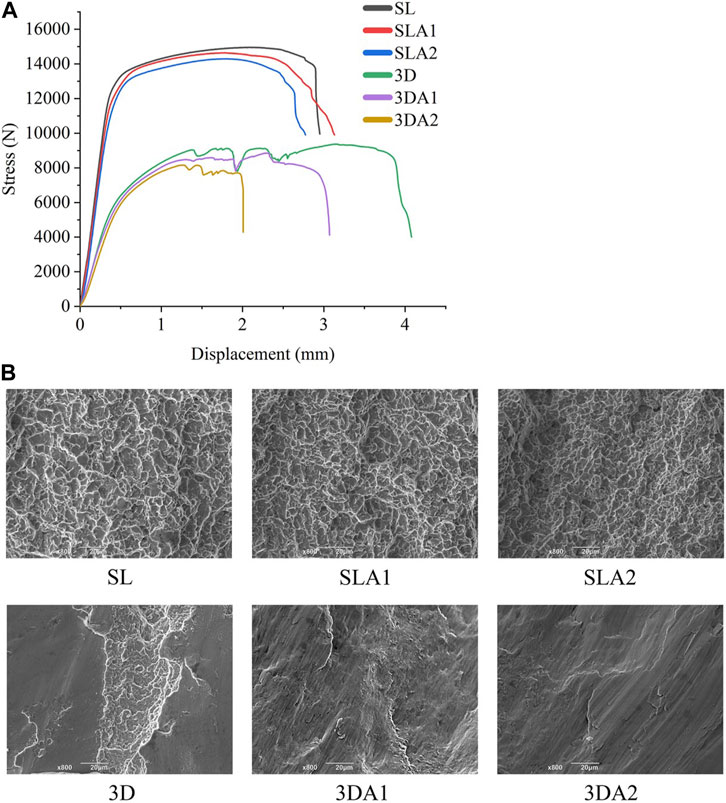
FIGURE 7. (A) Stress-displacement relationship curve; (B) SEM photos of compression fracture morphology of implants before and after surface modification.
Upon observing the fracture morphology after compression fracture (Figure 7B), the fractures of SL, SLA1 and SLA2 were all covered with uniform dimples, and their forms were mainly ductile fracture. On the contrary, the fracture surfaces of 3D, 3DA1, and 3DA2 showed a few dimples, the fracture surface presented relatively neat tearing marks, and the forms were mainly brittle fracture. The difference in the fractured form can be attributed to the difference in manufacturing methods, and surface modification did not alter the fractured form of the implant.
3.3 Simulated body fluid experiment
SEM observation revealed that only a small amount of flocculent sediments were observed on the SL and 3D implants before modification, while the SLA2 and 3DA2 implants were observed lots of sediments after alkali etching treatment (Figures 8A–D). The materials deposited on the surface of all implants were uneven and irregular in shape.
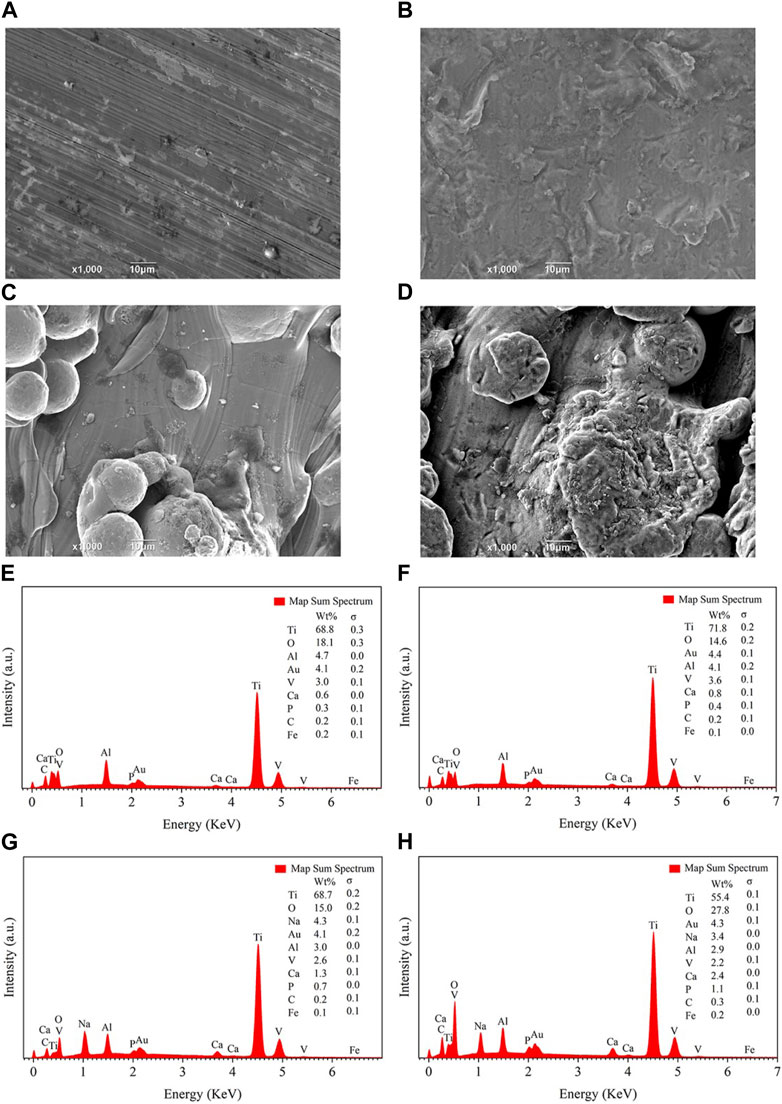
FIGURE 8. SEM (A–D) and EDS (E–H) photos of sample surface after soaked in SBF for 10 days. (A,E): group SL. (B,F): group SLA2. (C,G): group 3D. (D,H): group 3DA2.
To determine the composition of the sediments, the deposited materials were detected by EDS (
To further analyze the composition of the sediments, the Ca2+ were detected by EDTA titration. The quantitative analysis showed that 3DA2 consumed the most Ca2+, then SL2 and 3D, and SL consumed the least amount of Ca2+. The P5+ content was determined by phosphomovadomolybdic acid ultra violet (UV) photometric method, the results were consistent with the trend of Ca2+ consumption. The mass ratio of consumed Ca2+ and P5+ was about 2.15, which was equal to the mass ratio of Ca and P in hydroxyapatite [Ca5(PO4)3(OH)] (Figure 9A).
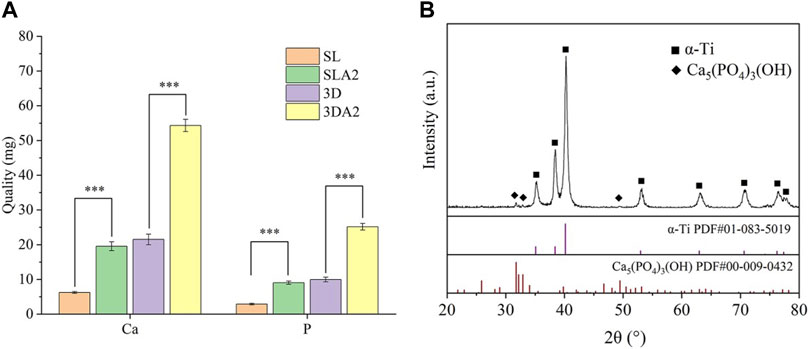
FIGURE 9. Quantitative statistics (A) and XRD (B) diffraction pattern of sample surface after soaked in SBF for 10 days. (B) The map contains the characteristic peaks of α-Ti and the characteristic peaks of HA, and the PDF standard card file number corresponding to the HA characteristic peaks is PDF # 00-009-0432. Comparison between the two groups, ***p < 0.001.
In the XRD diffraction profile, the diffraction peaks, about 32, 33 and 49, coincide with the PDF standard card with document number PDF#00-009-0432 in the standard card database pointing to Ca5(PO4)3(OH), demonstrating that the main component of the sediment is HA (Figure 9B).
3.4 The biological activity and osteogenic ability of dental implants
3.4.1 The biological activity of dental implants
All cells on the implants of each group demonstrated good growth, and no significant cell apoptosis was observed. Compared with SL and 3D, the cells on SLA2 and 3DA2 exhibited better spreading with obvious filopodia. Additionally, cells on SLA2 and 3DA2 were observed to be firmly attached to the sodium titanate gel layer on the implant surface, displaying good morphology. However, there was poor cell adhesion on the surface of 3D implants, because of its poor surface hydrophilicity (Figure 10).
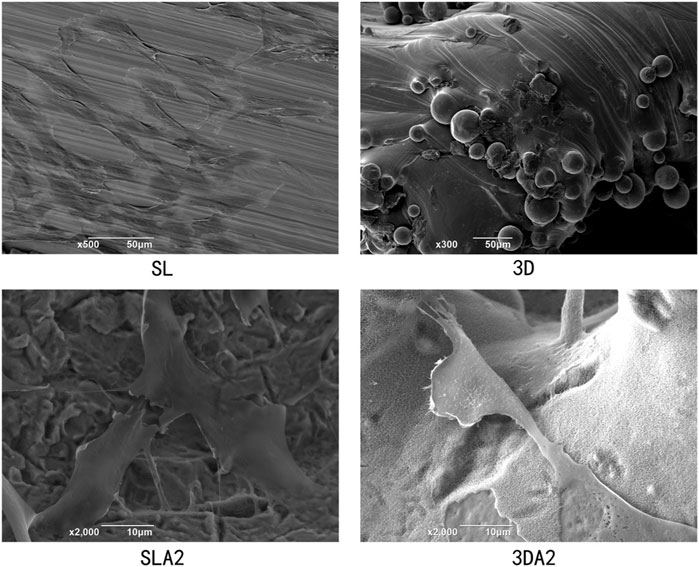
FIGURE 10. Photo for growth pattern of cells on the implant.
The results of the CCK-8 test revealed varying degrees of cell proliferation on all implants. There was no significant difference in the number of cells on the implants at day 1. Over time, more cells proliferated on 3DA2 and SLA2 than that on 3D and SL implants at days 5 and 10, with the largest number of cells proliferation on the 3DA2 implants. By day 10, all implants were in good condition (Figure 11). The effect of cell proliferation suggests that both macroscopic porous structure and surface modification promote osteoblast proliferation.
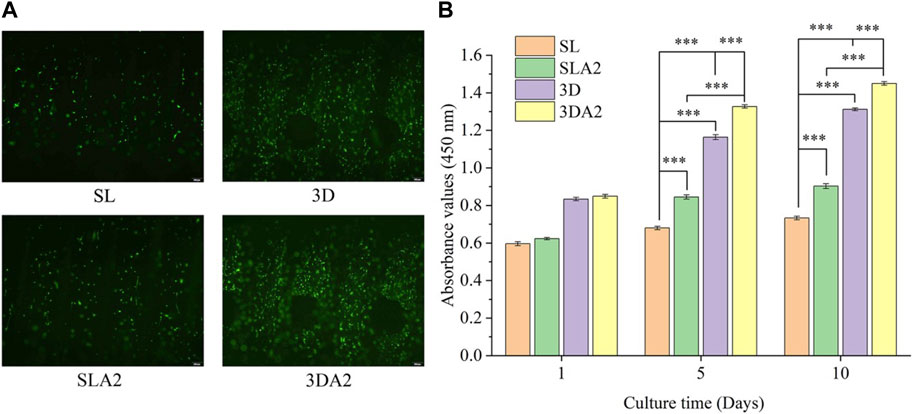
FIGURE 11. (A) Fluorescence-stained micrographs of cells on the implant on day 10 (live cells in green, dead cells in red); (B) CCK-8 cell count statistics. Comparison between the two groups, ***p < 0.001.
3.4.2 The early osteogenic ability of dental implants
The ALP activity of cells in SLA2 and 3DA2 samples was slightly higher than that in SL and 3D, with the highest activity in 3DA2 and the lowest in 3D on day 3. On the seventh day of culture, the ALP activity of cells in 3DA2 and SLA2 was still higher than that in SL and 3D, and the ALP activity in 3DA2 was the highest (Figures 12A, B). ALP activity assays indicate that macroscopic porous structures and surface modifications may have a positive role for the osteogenic differentiation of cells.
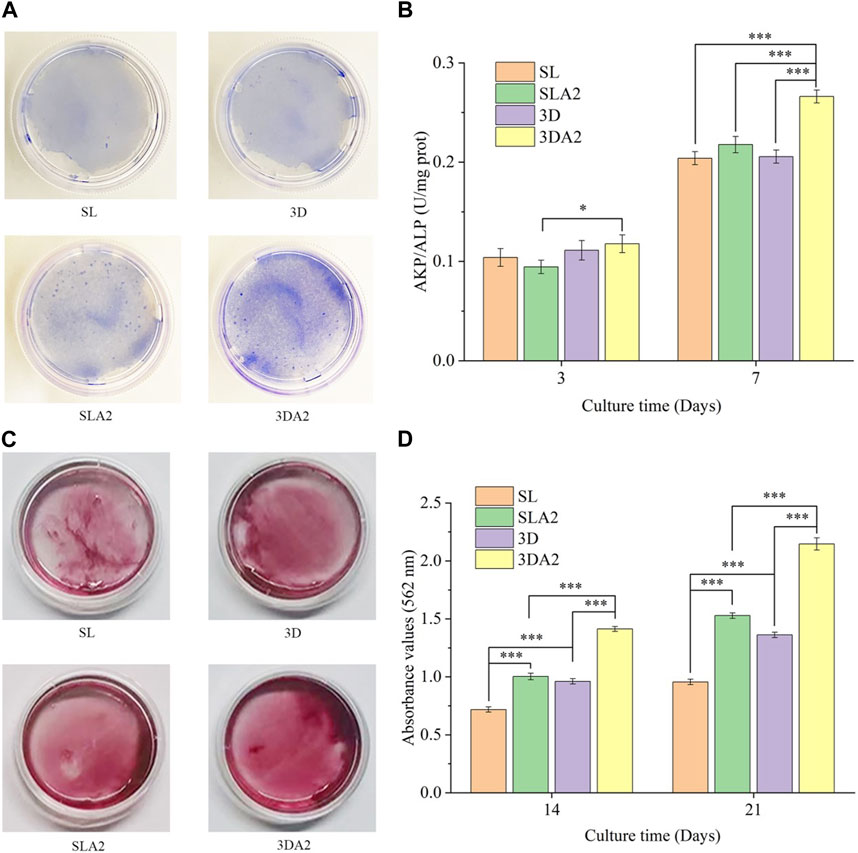
FIGURE 12. (A) Representative image of alkaline phosphatase eluted from the implant on day 7. (B) Statistical results of alkaline phosphatase activity of implant cells on the third and seventh culturing days; (C) Representative images of ECM mineralization after culturing for 14 days; (D) Semiquantitative analysis after culturing for 14 days and 21 days. Comparison between the two groups, *p < 0.05, ***p < 0.001.
3.4.3 The late osteogenic ability of dental implants
On days 14 and 21, the extracellular matrix on SLA2 and 3DA2 samples exhibited more mineralization (Figures 12C, D). The most mineralization occurring in the cells on 3DA2 samples and the least on SL samples. The amount of extracellular matrix mineralization on 3D implants was slightly higher than that on SL. The results of mineralization of extracellular matrix suggested that macroscopic porous structure and surface modification enhance the osteogenic differentiation of cells.
4 Discussion
Ti alloys are often used in dental implants. In our study, it was found that 3D printed Ti alloy implants have better bioactivity and osteogenic ability than the implants manufactured by CNC, and the combined surface modification of sandblasting, acid etching and alkali etching could improve the bioactivity and osteogenic ability of the implants. In the process of surface modification, Al2O3 particles are used for sandblasting. However, it has been noted in previous reports that alumina sandblasting was easy to cause residual particles on the surface of Ti alloy, and Al-containing implants implanted into bone tissue can cause bone resorption. Therefore, acid etching was used subsequently to clean up residual substances (Chrcanovic et al., 2013). Another major effect of acid etching and alkali etching was to make the surface texture and ensure the implant surface have better roughness. As shown in SEM photos, no residual sandblasted particles were found in the acid-etched implants. On the surface of the implant after alkali etching, the disordered growth of nano-scale texture was found, and the texture likes hairs uniformly covering the surface of the sample. Either acid or alkali corrosion increased or decreased the surface roughness of the implant. The corrosion improved the surface roughness of the implant obtained by CNC, because the implant surface was relatively smoother, and the corrosion destroyed the smooth surface and increased the roughness value. However, the corrosion reduced the surface roughness value of the implant obtained by 3D printing, because the surface of the implant was rough and covered with spherical metal particles after 3D printing. The corrosion damaged the surface morphology of the implant and made the metal particles coated on the surface of the implant smaller.
In order to evaluate the physicochemical characteristics of the implants, a Vickers hardness instrument, SEM, XRD, EDS, profilograph and a universal testing machine were used to determine their characteristics across the board. For the roughness, it was found that the mean roughness value 0.3 μm in group SL, which is considered as a smooth surface; while the value of 3D printed implants was about 9 μm. The rough surface of the implant facilitated the bone binding and the mechanical interlocking with the natural bone (Matos, 2021). Lincks et al. (1998) pointed out that rough surface was more conducive to cell proliferation and differentiation and had stronger bone binding ability because surface with a certain roughness value could form mechanical interlocking with the natural bone and increased the stability of the implant. Rong et al. (2018) found that the implants exhibited good osseointegration when the average surface roughness value was about 2 μm. Among our implants, 3DA2 implants had the lowest roughness value that was closest to the ideal range. The surface modification has significantly improved the roughness value. For the water contact angle, it was found that the implant without surface treatment had poor surface hydrophilicity. After surface modification, the surface hydrophilicity of the implants was improved. In previous reports, it was believed that hydrophilic implants could promote the proliferation of cells at early stage (Lotz et al., 2016). From the stress-displacement curve of the implant, it was observed that as the pressure continued to increase, the implant entered the plastic deformation stage, and eventually, the implant broke off when the pressure exceeded its resistance level. The pressure-displacement curves of 3D, 3DA1, and 3DA2 exhibited twists and turns in the plastic deformation stage compared to SLA1 and SLA2 due to differences in their structures and manufacturing methods. This is because the pressure causes the compression and crushing of the pore structure or internal defects, resulting in a slightly tortuous curve. The surface modification impaired the compression resistance of the implant when comparing SLA1 or SLA2 with SL, 3DA1 or 3DA2 with 3D. However, all implants had a pressure resistance level higher than 6,000 N, which exceeded the requirements of dental implant use, as the normal biting force of humans is much lower.
Nanoscale texture generated after alkali etching increased the biological activity of the implant and promoted ideal osseointegration. This is because the nanoscale texture could guide the adhesion and directional growth of cells (Xing et al., 2019; Ding et al., 2023). From the perspective of biomimetic, irregular nanoscale texture is closer to the surface of natural bone, and the biomimetic surface energy interacts with proteins and cell membrane receptors in contact, thus promoting the proliferation and differentiation of osteocytes (Stevens and George, 2005; Gittens et al., 2011). In the cell experiments, it was found that the cells on the surface of the implant after surface modification had better morphology and stretched out more filopodia. The highest ALP activity of the cells was 3DA2 and SLA2 on the seventh culturing day, which proved that the surface modification had a positive effect. For the implants with the same surface modification, the ALP activity of cells on 3DA2 was still higher than that of SLA2. Even without any surface treatment, the ALP activity of 3D was higher than that of SL on the seventh day, which was due to the influence of macro-porous structure on the cell activity. Furthermore, the cell proliferation experiment found that the number of proliferated cells was higher after surface modification. Compared SL and 3D with SLA2 and 3DA2, respectively, it could be seen that the macro-porous structure did promote cell proliferation. The reason maybe that the macro-porous structure made the cells easier to obtain nutrients, so the cells proliferated and differentiated faster. Additionally, the extracellular matrix mineralization of the experimental results showed that the surface modification of osteogenesis cells promoted the differentiation, the cells on the implant after surface modification produced more mineralized nodules, which showed that even in the late stage of cell differentiation, the combined surface modification of sandblasting, acid corrosion and alkali corrosion treatment have a positive effect on cells maturation and differentiation. Combined with the promotion of osteogenic differentiation by macro-porous structure, 3DA2 produced the most mineralized nodules.
5 Conclusion
Our findings indicate that implants produced using CNC and 3D printing exhibit distinct differences in Vickers hardness values and metallography. To enhance the surface roughness and hydrophilicity of Ti alloy implants, surface modification such as sand blasting, acid etching and alkali etching were employed. Furthermore, The combined surface modification improved the biocompatibility, bioactivity, and osteogenic ability of implants. Consequently, a macroscopic porous structure in conjunction with the surface modification of Ti alloy dental implants could enhance their osseointegration ability, thereby prolonging their therapeutic effect.
Data availability statement
The original contributions presented in the study are included in the article/Supplementary Material, further inquiries can be directed to the corresponding authors.
Ethics statement
The animal study was reviewed and approved by the Animal Care and Use Committee of Chengdu University.
Author contributions
LC proposed the idea and designed the experiment, ZQ and YH performed the study, wrote the manuscript, and completed the data analysis. JG, ZD, and SL contributed to preparation of manuscript. ZS helped the modification of this paper. All authors contributed to the article and approved the submitted version.
Funding
This work was supported by Natural Science Foundation of Sichuan Province, China (2022NSFSC1510), Agricultural Science and Technology Achievements Transformation Project of Sichuan Science and Technology Department, China (2022NZZJ0015), Higher Education Talent Training Quality and Teaching Reform Project of Education Department of Sichuan Province, China (JG 2021-1102 and JG 2021-1103), the Innovation Team Project of Clinical Medical College and Affiliated Hospital of Chengdu University, China (CDFYCX202208), and Longquanyi Talents Program, Chengdu, China (Long No.90).
Conflict of interest
The authors declare that the research was conducted in the absence of any commercial or financial relationships that could be construed as a potential conflict of interest.
Publisher’s note
All claims expressed in this article are solely those of the authors and do not necessarily represent those of their affiliated organizations, or those of the publisher, the editors and the reviewers. Any product that may be evaluated in this article, or claim that may be made by its manufacturer, is not guaranteed or endorsed by the publisher.
References
Baino, F., and Yamaguchi, S. (2020). The use of simulated body fluid (SBF) for assessing materials bioactivity in the context of tissue engineering: Review and challenges. Biomimetics 5 (4), 57. doi:10.3390/biomimetics5040057
Bandyopadhyay, A., Espana, F., Balla, V. K., Bose, S., Ohgami, Y., and Davies, N. M. (2010). Influence of porosity on mechanical properties and in vivo response of Ti6Al4V implants. Acta biomater. 6 (4), 1640–1648. doi:10.1016/j.actbio.2009.11.011
Bandyopadhyay, A., Shivaram, A., Tarafder, S., Sahasrabudhe, H., Banerjee, D., and Bose, S. (2017). In vivo response of laser processed porous titanium implants for load-bearing implants. Ann. Biomed. Eng. 45 (1), 249–260. doi:10.1007/s10439-016-1673-8
Castellanos-Cosano, L., Rodriguez-Perez, A., Spinato, S., Wainwright, M., Machuca-Portillo, G., Serrera-Figallo, M. A., et al. (2019). Descriptive retrospective study analyzing relevant factors related to dental implant failure. Med. oral, Patol. oraly cirugia bucal 24 (6), e726–e738. doi:10.4317/medoral.23082
Cervino, G., Fiorillo, L., Iannello, G., Santonocito, D., Risitano, G., and Cicciù, M. (2019). Sandblasted and acid etched titanium dental implant surfaces systematic review and confocal microscopy evaluation[J]. Materials 12 (11), 1763–1762. doi:10.3390/ma12111763
Chrcanovic, B. R., Leão, N. L. C., and Martins, M. D. (2013). Influence of different acid etchings on the superficial characteristics of Ti sandblasted with Al2O3. Mater. Res. 16 (5), 1006–1014. doi:10.1590/s1516-14392013005000067
Demirci, S., Dikici, T., and Güllüoğlu, A. N. (2022). Micro/nanoscale surface modification of Ti6Al4V alloy for implant applications. J. Mater. Eng. Perform. 31 (2), 1503–1511. doi:10.1007/s11665-021-06232-y
Deng, F., Liu, L., Li, Z., Lin, Z. B., Sun, Q. S., Wang, Y. F., et al. (2021). The gut microbiota metabolite capsiate promotes Gpx4 expression by activating TRPV1 to inhibit intestinal ischemia reperfusion-induced ferroptosis. J. Biol. Eng. 15 (4), 1–21. doi:10.1080/19490976.2021.1902719
Ding, Y., Tao, B., Ma, R., Zhao, X., Liu, P., and Cai, K. (2023). Surface modification of titanium implant for repairing/improving microenvironment of bone injury and promoting osseointegration. J. Mater. Sci. Technol. 143 (4), 1–11. doi:10.1016/j.jmst.2022.09.044
Elani, H. W., Starr, J. R., Da Silva, J. D., and Gallucci, G. (2018). Trends in dental implant use in the U.S., 1999–2016, and projections to 2026. J. Dent. Res. 97 (13), 1424–1430. doi:10.1177/0022034518792567
Gittens, R. A., Mclachlan, T., Olivares-Navarrete, R., Cai, Y., Berner, S., Tannenbaum, R., et al. (2011). The effects of combined micron-/submicron-scale surface roughness and nanoscale features on cell proliferation and differentiation. Biomaterials 32 (13), 3395–3403. doi:10.1016/j.biomaterials.2011.01.029
Glied, A., and Mundiya, J. (2021). Implant material sciences. Dent. Clin. 65 (1), 81–88. doi:10.1016/j.cden.2020.09.006
Jamróz, W., Szafraniec, J., Kurek, M., Jachowicz, R., et al. (2018). 3D printing in pharmaceutical and medical applications–recent achievements and challenges[J]. Pharm. Res. 35 (9), 1–22. doi:10.1007/s11095-018-2454-x
Kim, M., An, S., Huh, C., and Kim, C. (2019). Development of zirconium-based alloys with low elastic modulus for dental implant materials. Appl. Sci. 9 (24), 5281. doi:10.3390/app9245281
Liang, C. Y., Jiang, X. J., Ji, R. L., Li, B. E., Zou, X. R., Wang, H. S., et al. (2021). Preparation and surface modification of 3D printed Ti–6Al–4V porous implant. Rare Met. 40 (5), 1164–1172. doi:10.1007/s12598-020-01413-5
Lincks, J., Boyan, B. D., Blanchard, C. R., Lohmann, C. H., Liu, Y., Cochran, D. L., et al. (1998). Response of MG63 osteoblast-like cells to titanium and titanium alloy is dependent on surface roughness and composition. Biomaterials 19 (23), 2219–2232. doi:10.1016/s0142-9612(98)00144-6
Lotz, E. M., Olivares-Navarrete, R., Berner, S., Boyan, B. D., and Schwartz, Z. (2016). Osteogenic response of human MSCs and osteoblasts to hydrophilic and hydrophobic nanostructured titanium implant surfaces: Hydrophilic versus hydrophobic nanostructured surfaces. J. Biomed. Mater. Res. Part A 104 (12), 3137–3148. doi:10.1002/jbm.a.35852
Matos, F. G., Santana, L. C. L., Cominotte, M. A., da Silva, F. S., Vaz, L. G., de Oliveira, D. P., et al. (2022). Strontium-loaded titanium-15molybdenum surface improves physicochemical and biological properties in vitro. Biomed. Phys. Eng. Express 8 (4), 045007. doi:10.1088/2057-1976/ac71cf
Matos, G. R. M. (2021). Surface roughness of dental implant and osseointegration. J. Maxillofac. Oral Surg. 20 (1), 1–4. doi:10.1007/s12663-020-01437-5
Morris, D., Mamidi, S. K., Kamat, S., Cheng, K. Y, Bijukumar, D., Tsai, P. I, et al. (2021). Mechanical, electrochemical and biological behavior of 3D printed-porous titanium for biomedical applications[J]. J. Bio- and Tribo-Corrosion, 7 (2), 39. doi:10.1007/s40735-020-00457-5
Oshida, Y., Tuna, E. B., Aktören, O., and Gençay, K. (2010). Dental implant systems. Int. J. Mol. Sci. 11 (4), 1580–1678. doi:10.3390/ijms11041580
Patil, V., Naik, N., Gadicherla, S., Smriti, K., Raju, A., and Rathee, U. (2020). Biomechanical behavior of bioactive material in dental implant: A three-dimensional finite element analysis. Sci. World J. 2020 (1), 1–9. doi:10.1155/2020/2363298
Rezaie, F., Farshbaf, M., Dahri, M., Masjedi, M., Maleki, R., Amini, F., et al. (2023). 3D printing of dental prostheses: Current and emerging applications. J. Compos. Sci. 7 (2), 80–103. doi:10.3390/jcs7020080
Rong, M., Lu, H., Wan, L., Zhang, X., Lin, X., Li, S., et al. (2018). Comparison of early osseointegration between laser-treated/acid-etched and sandblasted/acid-etched titanium implant surfaces[J]. J. Mater. Sci. Mater. Med. 29 (4), 1–6. doi:10.1007/s10856-018-6049-1
Sailer, I., Karasan, D., Todorovic, A., Ligoutsikou, M., and Pjetursson, B. E. (2022). Prosthetic failures in dental implant therapy. Periodontol. 2000 88 (1), 130–144. doi:10.1111/prd.12416
Srivastava, S. K., and Pal, B. G. (2018). “Metallic biomaterials for dental implant systems,” in Fundamental biomaterials: Metals (Sawston, UK: Woodhead Publishing).
Stevens, M. M., and George, J. H. (2005). Exploring and engineering the cell surface interface. Science 310 (5751), 1135–1138. doi:10.1126/science.1106587
Van Noort, R. (1987). Titanium: The implant material of today. J. Mater. Sci. 22 (11), 3801–3811. doi:10.1007/bf01133326
Vasconcellos, L. M. R., Leite, D. O., Oliveira, F. N., Carvalho, Y. R., and Cairo, C. A. A. (2010). Evaluation of bone ingrowth into porous titanium implant: Histomorphometric analysis in rabbits. Braz. oral Res. 24, 399–405. doi:10.1590/s1806-83242010000400005
Wang, Q., Zhou, P., Liu, S., Attarilar, S., Ma, R. L. W., Zhong, Y., et al. (2020). Multi-scale surface treatments of titanium implants for rapid osseointegration: A review[J]. Nanomaterials 10 (6), 1244–1270. doi:10.3390/nano10061244
Xie, Y., Li, S., Zhang, T., Zhang, C., and Yu, B. (2020). Titanium mesh for bone augmentation in oral implantology: Current application and progress[J]. Int. J. Oral Sci. 12 (1), 1–12. doi:10.3389/fnins.2020.00001
Xing, H., Cai, J., Huang, X., and Song, Y. (2019). Preparation and biocompatibility of corrosion-resistant micro-nano bipolar structures on the surface of TC4 titanium dental implants. Sci. Adv. Mater. 11 (6), 866–875. doi:10.1166/sam.2019.3562
Xu, J., Zhang, J., Shi, Y., Tang, J., Huang, D., Yan, M., et al. (2022). Surface modification of biomedical Ti and Ti alloys: A review on current advances[J]. Materials 15 (5), 1749–1777. doi:10.3390/ma15051749
Keywords: 3D printing, titanium alloy, pore structure, dental implants, surface modification
Citation: Qin Z, He Y, Gao J, Dong Z, Long S, Cheng L and Shi Z (2023) Surface modification improving the biological activity and osteogenic ability of 3D printing porous dental implants. Front. Mater. 10:1183902. doi: 10.3389/fmats.2023.1183902
Received: 23 March 2023; Accepted: 22 May 2023;
Published: 31 May 2023.
Edited by:
Zeki Candan, Biomaterials and Nanotechnology Research Group | BioNanoTeam, TürkiyeCopyright © 2023 Qin, He, Gao, Dong, Long, Cheng and Shi. This is an open-access article distributed under the terms of the Creative Commons Attribution License (CC BY). The use, distribution or reproduction in other forums is permitted, provided the original author(s) and the copyright owner(s) are credited and that the original publication in this journal is cited, in accordance with accepted academic practice. No use, distribution or reproduction is permitted which does not comply with these terms.
*Correspondence: Lijia Cheng, Y2hlbmdsaWppYUBjZHUuZWR1LmNu; Zheng Shi, ZHJzaGl6MTAwMkBob3RtYWlsLmNvbQ==
†These authors share first authorship