 Jiajia Zou
 Mengqiu Huang
- China Electronics Technology Group Corporation No. 38 Research Institute, Hefei, Anhui, China
Introduction: The contact dispensing process is composed of extrusion, stretching, and liquid bridge breakage, which is greatly impacted by the viscosity and surface tension of the dispensed liquid and the contact angle between the liquid and the substrate. Regarding contact dispensing of conductive adhesives, few studies have investigated the influence of the viscosity of conductive adhesives on the dispensing process.
Methods: In the present study, computer simulation was used to explore the contact dispensing process of high-viscosity adhesives, and a dispensing device was designed to verify the simulation results.
Results and discussion: The results showed that the viscosity of the adhesives had the greatest influence on the dispensing process, and the higher the viscosity, the more difficult it was to break the liquid bridge, which seriously affected the stability of the contact dispensing process. In the dispensing process, once the adhesive had filled the gap between the needle tip and the substrate, increasing the dispensing time caused the diameter of the droplet to increase. Decreasing the lifting speed of the needle allowed sufficient time for the adhesive surface to restore changes caused by stretching, thereby eliminating unstable droplets and achieving droplets with regular morphology. In conclusion, our results demonstrated that computer simulation is a powerful tool for providing key information to improve the contact dispensing process, obtain droplets with optimal morphology, and achieve excellent bonding between the conductive adhesive and the substrate.
1 Introduction
Due to its simple process, contact dispensing has been widely applied in various fields of electronic packaging, such as auto parts, LED lamps, and electronic components (Yao et al., 2011; Zhu et al., 2018; Liu et al., 2022). With continuous improvements in manufacturing technology, electronic components have become increasingly miniaturized, and their morphology requirements have become more demanding (Lu et al., 2008; Luo et al., 2016; Chen et al., 2020). At the micro scale, a mismatch between the dispensing process and the dispensed liquid can lead to stringing and tailing during the dispensing process, which can contaminate the electronic components on the substrate. Therefore, control of the morphology and volume of the liquid during the dispensing process is critical (Anuar et al., 2011; Yao et al., 2011). Currently, contact dispensing is the most effective dispensing technology, and it is suitable for liquids with a wide range of viscosities. This study considers contact dispensing of conductive adhesives.
The contact dispensing process is typically composed of four stages, namely, extrusion, deposition, stretching, and breakage (Chen et al., 2009; Liu et al., 2022). The dispensing tip first approaches the substrate, and the needle gradually approaches the substrate to allow the conductive adhesive to contact the substrate. After reaching the dispensing distance and idling for a certain period of time, the needle is lifted and moved away from the substrate. Due to adhesion and surface tension (Gilleo, 1995; Mir and Kumar, 2008), the conductive adhesive breaks apart at the needle tip, and some adhesive remains on the dispensing surface to form microdroplets (0.1–100 μm). Because of the small size of these microdroplets, microscopic forces such as cohesion and surface tension play a dominant role in determining their morphology, whereas gravity has little effect, so the droplets will not fall from the needle (Li and Wong, 2006; Pospischil et al., 2015). Since the characteristic size of the microdroplets is extremely small, sometimes it is challenging to conduct rheological research from a macroscopic perspective. Therefore, it is necessary to study the contact dispensing process from a microscopic perspective.
In the contact dispensing process, the conductive adhesive is always influenced by body force and surface tension (Harris, 1995; Zhang et al., 2019). The interaction between the droplet and the substrate causes the liquid droplet to spread, and surface tension leads to cohesion due to attraction between the atoms or molecules, which causes the liquid to contract. When there is a certain amount of liquid that can wet two adjacent solid surfaces, a solid–liquid–solid triple-connection system can be formed due to the adhesion between the liquid and the solid surfaces. This system is called the liquid bridge (Papageorgiou, 1995; Doshi et al., 2003; Akbari et al., 2015; Li and Sprittles, 2016; Zhu et al., 2023). In the context of this study, the liquid bridge connects the needle tip and the substrate, and the tension of the liquid bridge is the external manifestation of microscopic forces such as surface tension. The viscosity (manifested as the cohesive force) of the conductive adhesive and the wettability (manifested as the adhesion force) between the conductive adhesive and the substrate both have a great influence on the morphology of the liquid bridge. After liquid bridge breakage, the conductive adhesive will freely spread and infiltrate until reaching an equilibrium state. The extent of droplet motion depends on the degree of wetting of the droplet to the substrate. Thus, in the contact dispensing process, the dispensing quality is affected by many factors. Microscopically, the stable state of the droplets is the result of interactions of various forces.
Chen et al. (2007) reported that when the amount of remaining adhesive was less than 50 vol%, the actual dispensing amount was less than the predicted value, which was due to the weight of the adhesive and the energy dissipation during the dispensing process. Lutfurakhmanov et al. (2010) studied the influences of various factors on the dispensing volume, such as surface tension, injection pressure, needle radius, and the distance between the needle tip and the substrate. They found that increasing the lifting speed of the needle led to an increase in the radius of the droplet on the substrate. Chen et al. (2009) showed that when the effect of shear rate on apparent viscosity was taken into account, the accuracy of dispensing volume was significantly improved. Moreover, some studies have been conducted to improve the contact dispensing process. For instance, Kusaka et al. (2017) developed a reciprocating needle dispensing system for high-viscosity liquids. Specifically, a solid needle moves down to dispense highly viscous ink of a fixed amount from the needle tip, and then the needle is lifted away from the dispensed ink. In addition, many studies focused on the factors that affect the quality of the adhesive in contact dispensing, such as the dispensing equipment and the dispensing parameters (Reisgen and Scheik, 2008; Pospischil et al., 2013; Du et al., 2015; Yim et al., 2022). Although the dispensing process can be significantly affected by parameters such as the contact angle between the needle tip and the substrate, surface tension coefficient, and viscosity, there are few sources of data on the influences of the physical properties of the adhesive.
Therefore, this study investigated the influences of the physical properties of the adhesive on the dispensing process. According to the characteristics of the contact dispensing process, numerical simulation and experimental verification based on microfluid mechanics were carried out, and the influences of the adhesive properties on droplet deposition were analyzed from both macroscopic and microscopic perspectives. The results of this study provide reference for optimizing the dispensing processes to improve the accuracy of contact dispensing and obtain droplets with optimal morphology.
2 Materials and methods
2.1 Materials
Four types of conductive adhesives were used in this study, and their physical properties are shown in Table 1. The density and viscosity of these adhesives varied greatly, so they required different dispensing processes. If the dispensing experiment were to be carried out manually, it would demand a great deal of manpower and financial resources and would not be conducive to determining the relationships between the physical properties of the liquid and the quality of the droplets. Computer simulation was used in this study because it can simulate various conditions and efficiently analyze the influences of the physical parameters and the dispensing process on the quality of the droplets, thereby facilitating the optimization of the dispensing process.
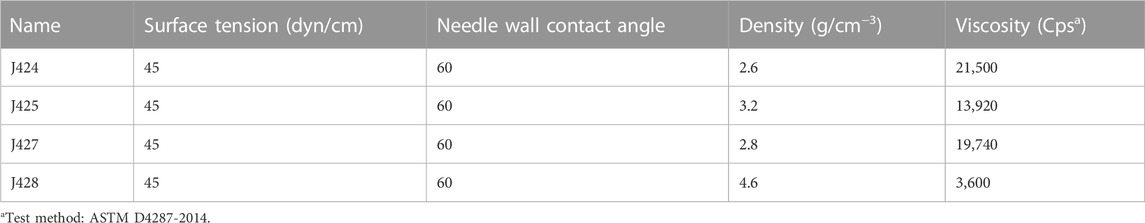
TABLE 1. Conductive adhesives used in this study and their properties.
In this study, the contact angles between the four types of adhesives and the substrate were characterized. The substrate was a gold paste low temperature co-fired ceramic (LTCC). Information of the droplets after curing under the initial dispensing process is shown in Table 2. Since the morphology of the droplets changed after curing compared to immediately after dispensing, the values in Table 2 were only used as the basic settings. During the simulation, they were changed to explore their influences on the dispensing and deposition process.
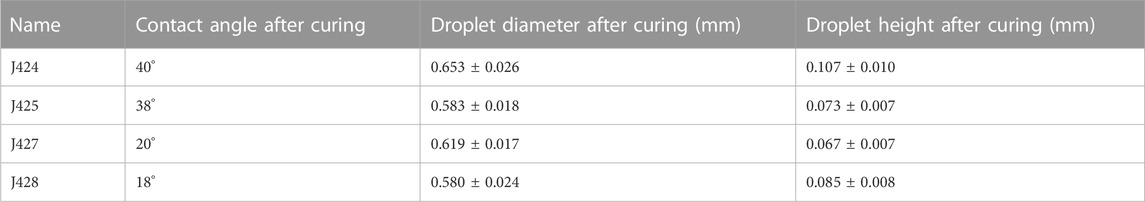
TABLE 2. Conductive adhesives used in this study and their properties after curing.
2.2 Dispensing simulation model and parameter settings
The contact dispensing process was performed in an automatic dispensing machine (S2-900, Nordson Asymtek, United States), which is shown in Figure 1A. The dispensing needle was Nordson 27#, with an inner diameter of 0.20 mm, an outer diameter of 0.42 mm, and a length of 5 mm (Figure 1B). The initial distance between the needle tip and the substrate was 0.08 mm. The ratio of needle length to initial needle tip-to-substrate distance was 62.5. Since the conductive adhesive could form a fully developed flow within a short time in the needle, the influence of needle length was not considered, and the length of the needle was reduced to 0.4 mm.
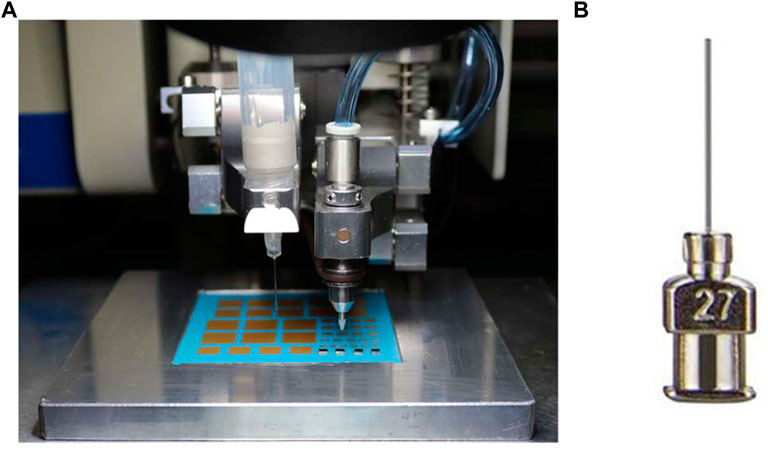
FIGURE 1. Pictures of the automatic dispensing machine (A) and the 27# needle (B).
The fluid mechanics module FLUENT in ANSYS (2021 R1) was used in this study. The model was meshed with the built-in MESH module using quadrilateral elements, which can make the nodes arranged in an orderly manner and have high quality elements. The numbers of elements and nodes were 4,139 and 4,152, respectively. After meshing, the model was imported into the FLUENT solver. The two-phase flow model and the volume of fluids (VOF) (Hirt and Nichols, 1981) model was used to distinguish the liquid/gas phase and track the two-phase interface. The continuous surface tension model and the wall adhesion model were turned on as well, and the surface tension coefficient and contact angle were determined based on the physical properties of the adhesive.
2.3 Dispensing experiment
The Asymtek 820 precision dispensing system was used to conduct the experiments. The samples were cured in an oven, and the curing temperature and time were set according to the characteristics of each adhesive. Specifically, the curing temperature and time for J424, J425, J427, and J428 were 65°C, 180°C, 150°C, and 250°C and 120, 60, 60, and 30 min, respectively.
2.4 Performance test
The Xyztec Condor EZ bond testing system was used to test the shear performance of each sample after curing according to GJB 548B-2005 Microelectronic Device Test Methods and Procedures. The porosity was measured according to GJB 548B-2005 Microelectronic Device Test Methods and Procedures.
3 Results and discussion
The contact dispensing process can be divided into four stages: 1) liquid flow in the needle, 2) contact between the liquid and the substrate, 3) transfer of the liquid from the needle to the substrate, and 4) constrained spreading of the droplet (Yao et al., 2011; Liu et al., 2022). The mechanism of droplet formation is that after the liquid flows from the needle to the substrate, the liquid bridge is gradually narrowed and finally breaks due to lifting of the needle, achieving transfer of the liquid to form a complete droplet. Therefore, the characteristics of the adhesive and the process parameters at different stages greatly affect the dispensing process, which requires careful modeling and analysis.
3.1 Effect of adhesive properties on the dispensing process
3.1.1 Viscosity
Figure 2 shows the pumping pressure required for the extrusion of adhesives with different viscosities. The higher the viscosity, the greater the pressure required. The pressure contours were in a similar pattern, so the flow of the adhesive in the needle was not related to the viscosity of the adhesive.
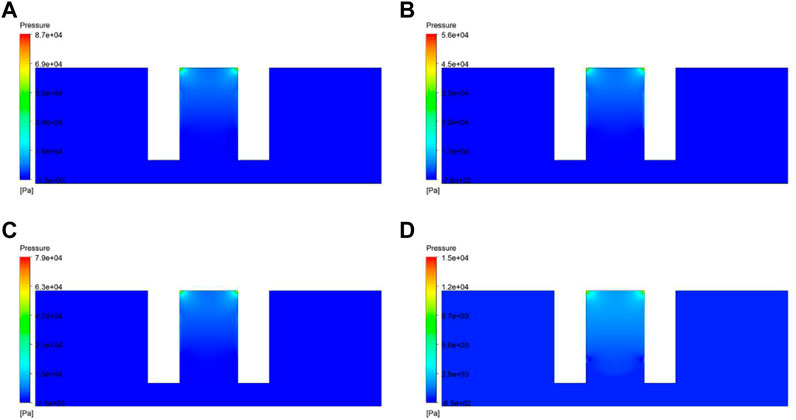
FIGURE 2. Pressure distribution map of the droplet at 0.04 s for different conductive adhesives: (A) J424; (B) J425; (C) J427; (D) J428.
When the needle was lifted, the liquid bridge elongated, and under the action of gravity, the liquid bridge narrowed and then broke into two parts. The viscosity of the adhesive had a great influence on the position and pressure of the necking point during the liquid bridge breakage process. Figure 3 shows the volume distribution contours of different adhesives at 0.2 s after the needle was moved away from the substrate. As the viscosity of the adhesive increased, it became more and more difficult to break the liquid bridge. J428 had the lowest viscosity, and its liquid bridge broke first during the dispensing process. The liquid bridge of J425 started to break at 0.2 s and showed obvious bending at the thinnest point (Figure 3B). However, J424 and J427, which had higher viscosity, were still in the stretching stage, and there was no tendency of liquid bridge breakage. Moreover, the higher the viscosity, the longer the liquid bridge, and the more obvious the tail after it broke, which led to poor dispensing quality.
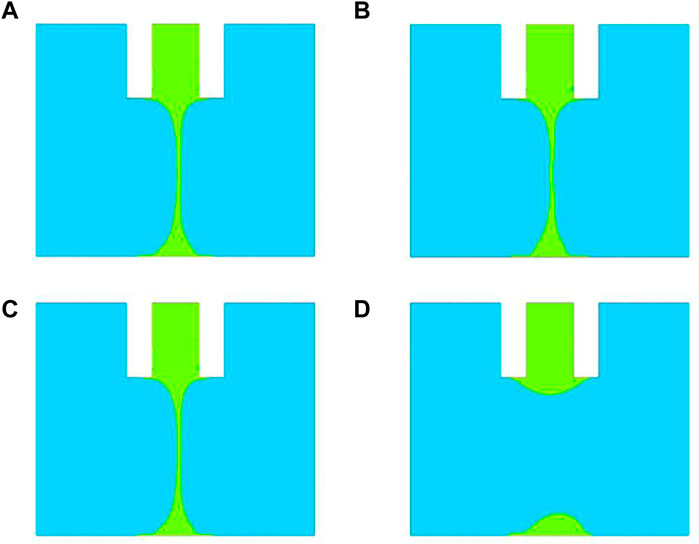
FIGURE 3. Volume distribution map of the droplet at 0.2 s for different conductive adhesives: (A) J424; (B) J425; (C) J427; (D) J428.
Furthermore, the morphology of the liquid bridges of J424 and J428, which had the highest and lowest viscosity, respectively, were analyzed at breakage, as shown in Figure 4. The higher the viscosity, the farther the breakage point from the substrate, that is, the less liquid left on the substrate, and the more inaccurate the subsequent dispensing. In addition, J424 was significantly more unstable at breakage, with microdroplets that could contaminate the substrate. When the viscosity of the adhesive was low, its fluidity was good, thus forming a smooth liquid bridge.
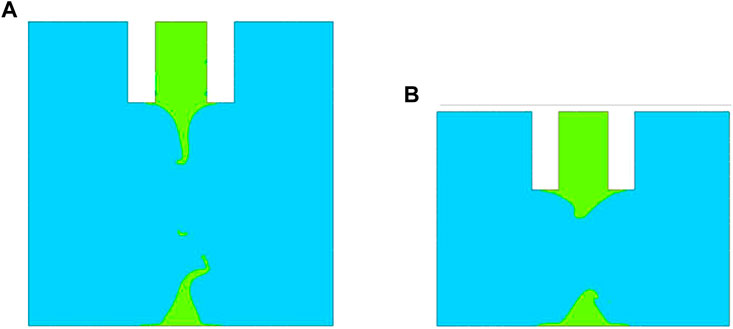
FIGURE 4. Volume distribution map of J424 (A) and J428 (B) at liquid bridge breakage.
3.1.2 Contact angle
The contact angle of the needle wall was set to 60°, and the contact angle between the substrate and the droplet was varied between 20°, 30°, and 40° (Table 2). The contact behavior of the droplet was studied.
After contacting the substrate, the morphology of the adhesive droplet changed due to gravity and surface tension. Figure 5 presents the pressure and velocity distribution maps at 0.072 s. There was no significant change in the pressure distribution pattern, but due to the increase of the contact angle, the maximum pressure increased. The maximum pressure occurred on the surface of the substrate as a result of gravity. The internal pressure of the adhesive was relatively stable, without obvious gradient. As the contact angle increased, the maximum pressure increased. When the contact angle was 40°, the pressure was 5,700 Pa, which was an order of magnitude lower than that at the initial contact angle (20°). Due to gravity and surface tension, the velocity of the droplet was the largest at its edge, which had the largest curvature and was located at the intersection of the three phases of substrate, air, and droplet. The larger the pressure, the higher the corresponding maximum velocity. The maximum velocity with a 40° contact angle was about 0.003 m/s.
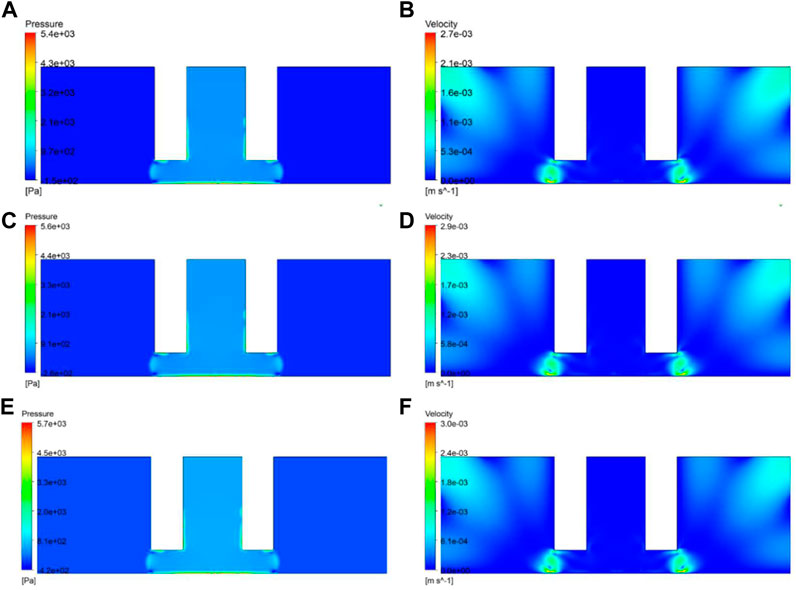
FIGURE 5. Pressure and velocity distribution maps at 0.072 s for different contact angles: (A,B) 20°; (C,D) 30°; (E,F) 40°.
Figure 6 shows the droplets at 2.8 s. The morphology and volumes of the droplets at three different contact angles were similar, yet the height and diameter were different. The smaller the contact angle, the lower the droplet height, and the smaller the diameter. Hence, the contact angle had a significant impact on the morphology of the droplet. Moreover, the droplet may also be affected by the wettability of the upper substrate. In the stretching phase of the liquid bridge, the dynamic morphology of the droplet was affected by the contact angles with the upper and lower substrates. When the contact angles were close, the liquid bridge was uniform, and the droplet had good symmetry.
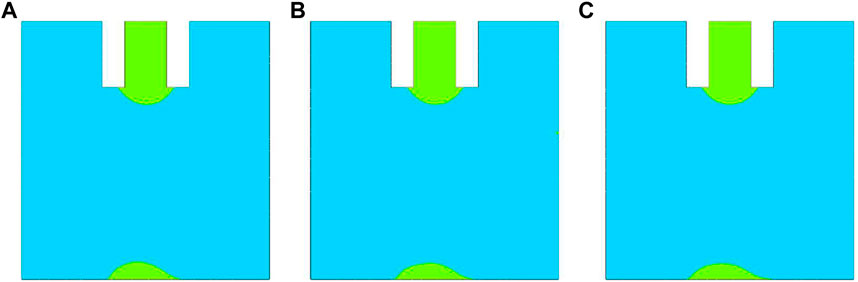
FIGURE 6. Morphology of the droplet at 2.8 s for different contact angles: (A) 20°; (B) 30°; (C) 40°.
3.1.3 Surface tension
The surface tension of the droplet also had a significant influence on the dispensing process. The surface tension of the droplet was set to 30, 45, and 60 dyn/cm. Both the pressure and the velocity increased with the increase in surface tension (Figure 7). When the surface tension increased from 30 to 60 dyn/cm, the maximum pressure increased from 3,900 to 5,700 Pa, and the maximum velocity increased from 0.0019 to 0.003 mm/s. However, the pressure and velocity maps did not change much with varying surface tension. The maximum velocity occurred on both ends of the droplet, where it intersected with the substrate and the air. When the surface tension was further increased, the maximum pressure increased further, whereas the maximum velocity decreased. It can be speculated that the increase of surface tension promoted flow deformation of the droplet.
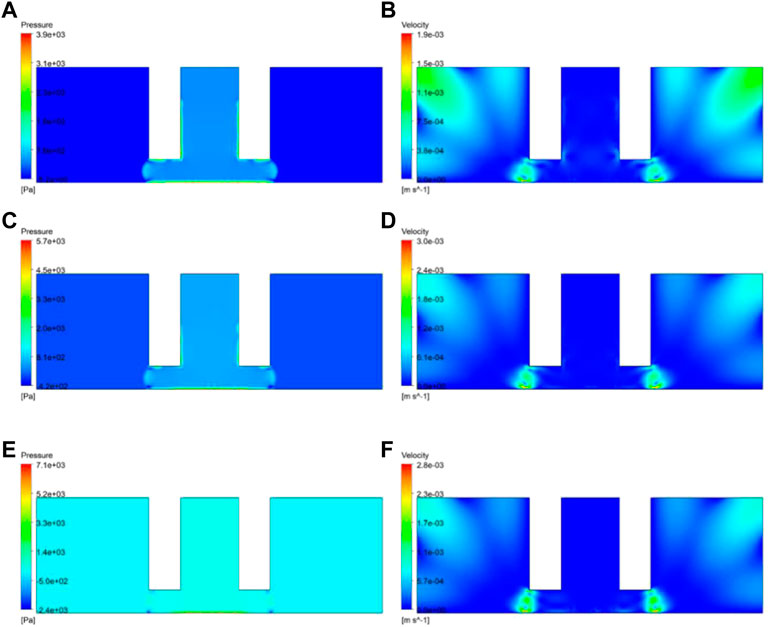
FIGURE 7. Pressure and velocity distribution maps at 0.072 s for different surface tension values: (A,B) 30 dyn/cm; (C,D) 45 dyn/cm; (E,F) 60 dyn/cm.
From the calculation results at 0.2 s (Figure 8), when the surface tension was 45 dyn/cm, the maximum pressure was the lowest, i.e., 1,500 Pa, and the internal pressure gradient of the droplet was small, indicating a stable state. It is worth noting that surface tension is an adjustable property of the droplet, so changing this parameter in the dispensing process is feasible.
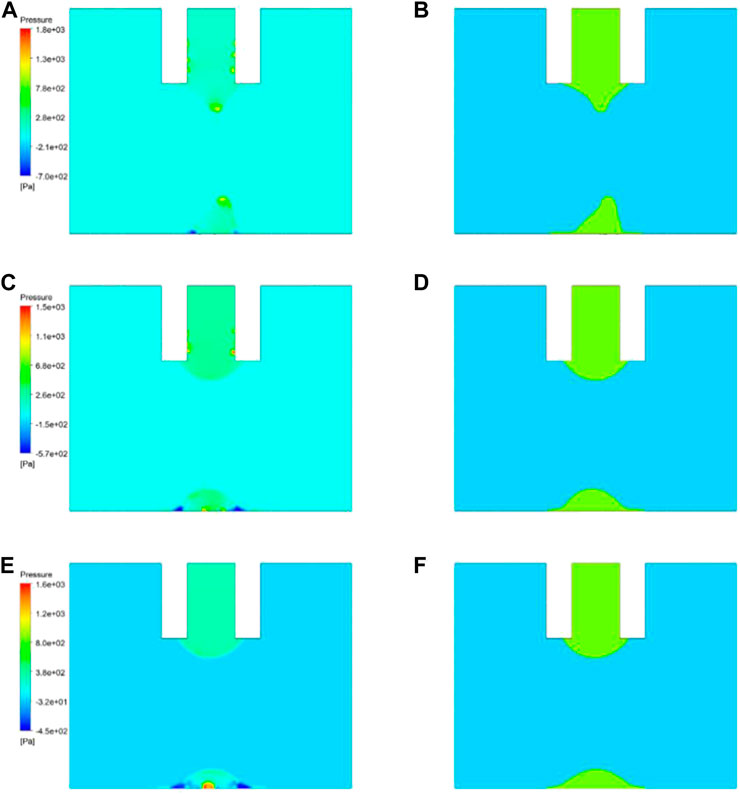
FIGURE 8. Pressure and volume distribution map at 0.2 s for different surface tension values: (A,B) 30 dyn/cm; (C,D) 45 dyn/cm; (E,F) 60 dyn/cm.
3.2 Effects of dispensing parameters on the dispensing process
3.2.1 Dispensing time
Dispensing time and dispensing rate are two key factors controlling the size of the droplet. Considering that the product of the two factors can be used to estimate the size of the final droplet, that is, the effect of increasing the dispensing time is the same as increasing the rate, we only studied the dispensing time in this study. According to the actual dispensing process and the simulation model, the dispensing time was set to 0.06, 0.07, and 0.08 s. This is because even small changes in dispensing time will have a great impact on the morphology of the droplet. Figure 9 shows the volume distribution map at 0.08 and 0.12 s after contacting the substrate. The inner diameter of the needle, that is, the width of the flow channel, was 0.20 mm, and the thickness of the needle wall was 0.11 mm, which cannot be neglected during simulation. When the dispensing time was 0.06 s (Figure 9A), the amount of adhesive was insufficient to cover the needle wall, and the angle between the adhesive and the upper and lower substrate was different when the needle was lifted (Figure 9B). When the dispensing time was increased, the adhesive completely filled the gap between the needle tip and the substrate. When the needle was lifted at 0.12 s, a liquid bridge was formed in all models, and the longer the dispensing time, the wider the liquid bridge, and the larger the wetting area between the droplet and the substrate.
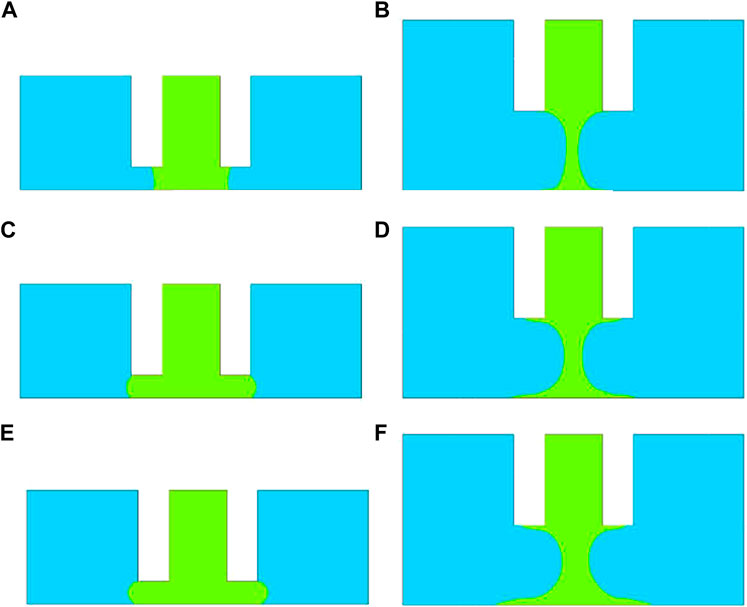
FIGURE 9. Volume distribution map of the droplet at (left) 0.08 s and (right) 0.12 s after contacting the substrate for different dispensing times: (A,B) 0.06 s; (C,D) 0.07 s; (E,F) 0.08 s.
At 0.2 s after contacting the substrate, the liquid bridges were broken in all models (Figure 10), yet the morphology of the droplets was quite different. The longer the dispensing time, the larger the area of the droplet. When the dispensing time was too short, a balance between the needle, the substrate, and the liquid could not be established. As the dispensing time increased, more adhesive was transferred to the substrate, and the diameter of the droplet increased. Appropriately extending the dispensing time, i.e., increasing the adhesion area of the droplet on the substrate, can improve the stability of the droplet. However, overextending the dispensing time will increase the liquid bridge breakage time, indicated by residual pressure on the droplet (Figure 10E). Therefore, appropriate dispensing time is essential for the quality of the droplet.
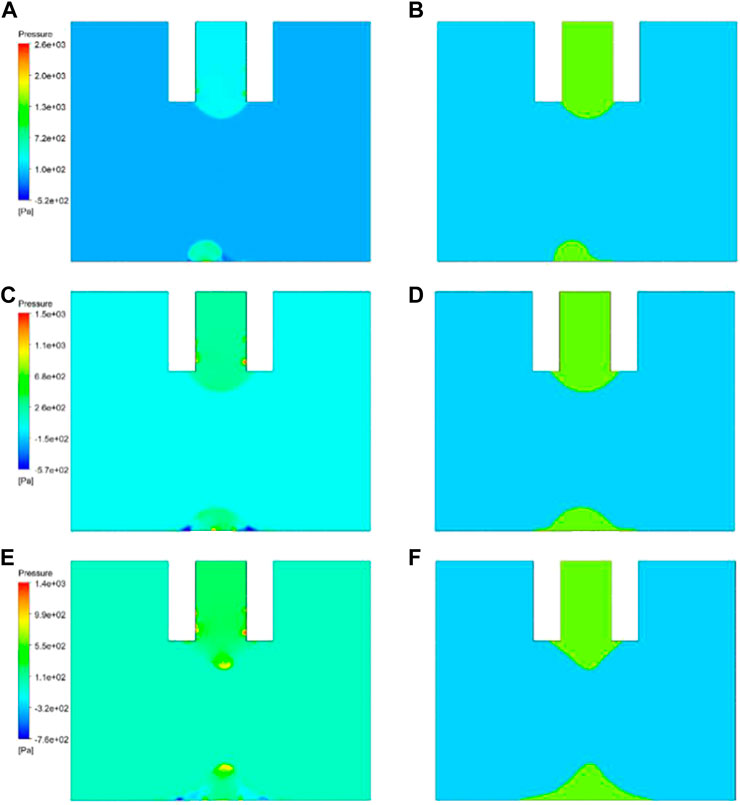
FIGURE 10. Pressure and volume distribution maps of the droplet at 0.2 s after contacting the substrate for different dispensing times: (A,B) 0.06 s; (C,D) 0.07 s; (E,F) 0.08 s.
3.2.2 Lifting speed
The viscous effect of highly viscous fluids is significantly increased compared to low viscosity fluids, and it is known that reducing lifting speed increases and the quality of the droplet (McKinley and Tripathi, 2000; Chen et al., 2002; Lutfurakhmanov et al., 2010). Needle lifting is the last step to form a droplet. The lifting was achieved by moving the base plate downward. The lifting speed was set to 5, 2.5, and 1 mm/s. Figure 11 shows the volume and pressure distribution maps of the droplet at 0.12 s. The greater the lifting speed, the rougher the liquid bridge. When the lifting speed was 1 mm/s, the liquid reached equilibrium at both the needle and the substrate, thus forming a smooth boundary. From the pressure distribution map (Figure 11B), there was no obvious pressure gradient at the intersection of the droplet, air, needle, and substrate, that is, there was no velocity difference (i.e., pressure-driven flow). However, at a higher lifting speed, the above interface became less smooth, and there was an obvious pressure gradient, indicating that the interface had not yet reached equilibrium. Therefore, the droplet had an unstable morphology and the interface continued to move until reaching an equilibrium state.
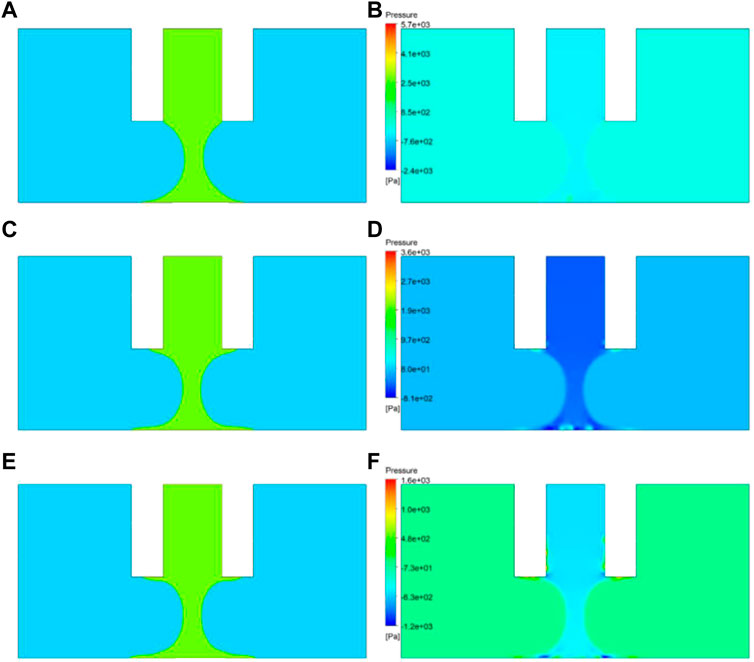
FIGURE 11. Volume and pressure distribution maps of the droplet at 0.12 s after contacting the substrate for different lifting speeds: (A,B) 1 mm/s; (C,D) 2.5 mm/s; (E,F) 5 mm/s.
At 0.16 s after the adhesive contacted the substrate, liquid bridge breakage occurred when the lifting speed was 1 mm/s and a droplet with good symmetry and a small internal pressure gradient was formed. As shown in Figures 12A, B, there was no pressure gradient at the adhesive interface, and both the upper and lower interfaces were relatively smooth. When the lifting speed was 2.5 mm/s (Figures 12C, D), the liquid bridge was at its critical point of breakage, and there was obvious pressure concentration at the point. With increasing time, the pressure equilibrium was reached under the action of surface tension and gravity. However, since there was an obvious tailing phenomenon, the dispensing quality was impacted. When the lifting speed further increased to 5 mm/s (Figures 12E, F), the liquid bridge did not break at 0.16 s, and there was a more severe tailing phenomenon, which significantly reduced the dispensing quality.
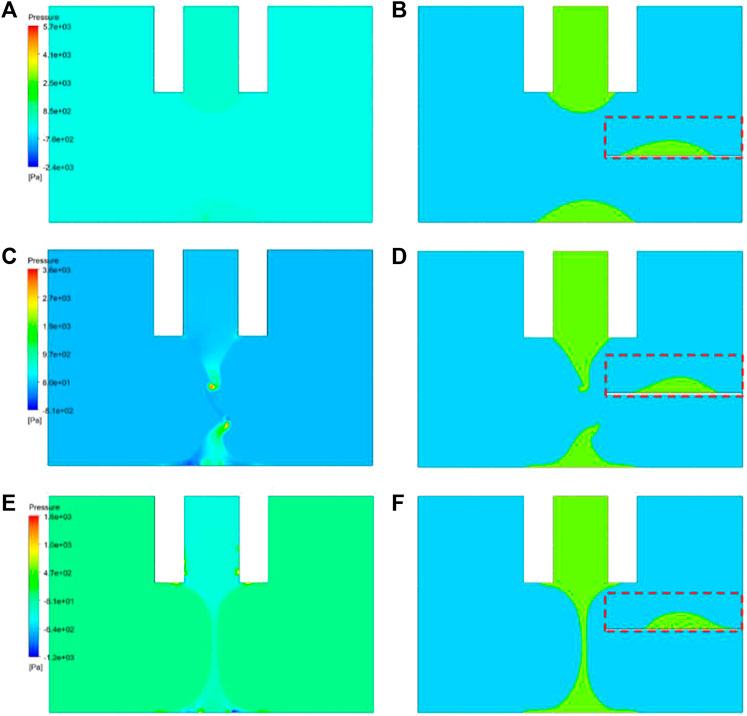
FIGURE 12. Volume and pressure distribution maps at 0.16 s after contacting the substrate for different lifting speeds: (A,B) 1 mm/s; (C,D) 2.5 mm/s; (E,F): 5 mm/s.
By fitting the results, the morphology of the droplets when the adhesive reached equilibrium at different lifting speeds was obtained, as shown in the red box in Figure 12. As the lifting speed decreased, the quality and symmetry of the droplet improved. This is because the low lifting speed allowed the adhesive interface sufficient time to recover from the changes caused by stretching, thereby eliminating the instability caused by stretching.
3.3 Verification of simulation results
The aforementioned simulations on the key factors in the dispensing process indicated that the dispensing time should be 0.07–0.08 s, and the lifting speed of the substrate should be less than 5 mm/s. A high lifting speed will lead to the tailing phenomenon, especially for J424, which has a high viscosity. Using an automatic dispensing system built in our institute, the dispensing experiment was carried out with the optimization scheme obtained by simulation, and the morphology and properties of the droplets before and after optimization were compared to verify the reliability and effectiveness of the simulation results and the optimization scheme.
Figure 13 shows a comparison of the morphology of the droplets before and after optimization, and Table 3 shows the height and diameter of the droplets. Before optimization of the dispensing process, J428, which had the lowest viscosity, had the largest droplet diameter (653 μm), whereas J424 had the smallest droplet diameter (580 μm). The droplet height decreased as the viscosity decreased. The simulation results demonstrated that the higher the viscosity of the adhesive, the more difficult it was to break the liquid bridge. Therefore, in the initial dispensing process, the shape of the droplet was often undesirable, with characteristics such as large droplet diameter (J424), poor symmetry (J425 and J427), or significantly larger height in the center of the droplet than the edge (J428). All of these characteristics could lead to defects such as gaps during the subsequent curing process, thus reducing the dispensing quality. After optimization, the droplets had good consistency and a round shape. The droplets were almost identical to the naked eye. More importantly, there were no microdroplets even for the high-viscosity adhesive, indicating that the optimization was very effective. From the side view, the droplet was not strictly symmetrical along the diameter direction, which was consistent with the simulation results. In addition, the contour of the droplets was not a smooth curve but had certain fluctuations. The simulation results showed that after liquid bridge breakage, there was a tailing phenomenon, and equilibrium was reached due to gravity and surface tension. However, both high viscosity and tailing could hinder the formation of a smooth contour.
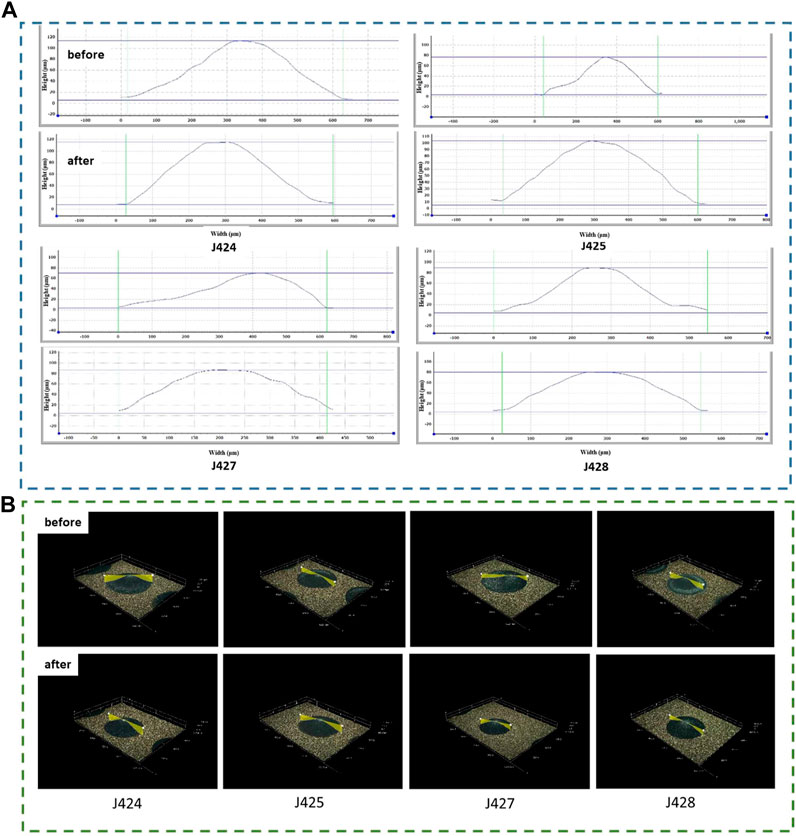
FIGURE 13. (A) Morphology and (B) cross-section of the droplet before and after optimization of the dispensing process.
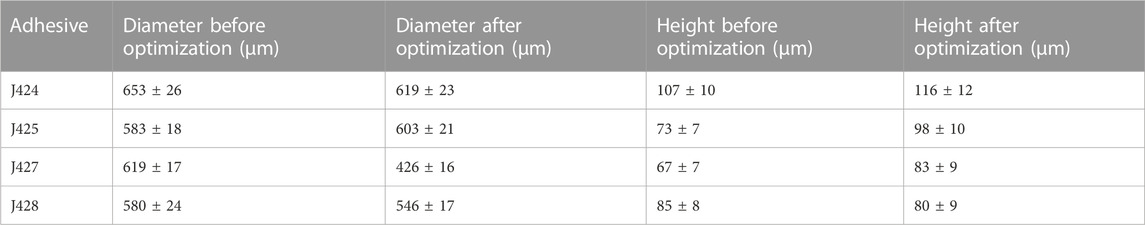
TABLE 3. Comparison of droplet height and diameter before and after optimization of the dispensing process.
The samples before and after optimization were laminated and cured. Table 4 shows a comparison of the tensile shear strength and porosity. The tensile shear strength of the four conductive adhesives increased to varying degrees compared with before optimization, whereas the porosity decreased significantly. It is worth noting that J428, which had the lowest viscosity, had the least increase in tensile shear strength, from 2.98 to 3.10 MPa. This may be because the adhesive was able to quickly move to an equilibrium state after liquid bridge breakage and obtain a good bonding effect. Hence, optimization had little effect. This conclusion can also be reached by the porosity data of J428, which was the smallest among the four adhesives before optimization. For J424, J425, and J427, the porosity and tensile shear strength after optimization suggested the validity of the simulation in this study. After optimization, the morphology of the droplets was regular, resulting in uniform thickness during lamination and curing bonding. Hence, large void defects were avoided.
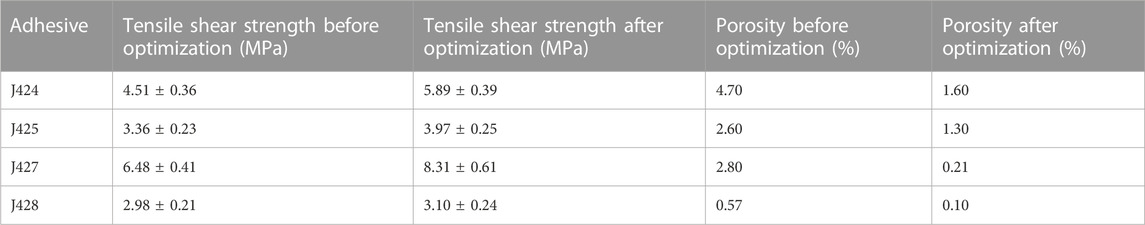
TABLE 4. Comparison of the tensile shear strength and porosity of samples before and after optimization.
4 Conclusion
In the present study, the influences of the conductive adhesive’s physical properties and the dispensing parameters on the contact dispensing process were studied. According to the simulation and experimental results, the mechanisms of stretching, fracture, and spreading of the adhesives were discussed, and the key factors affecting the contact dispensing process were studied. The results showed that the higher the adhesive viscosity, and the more difficult it was to break the liquid bridge, which severely affected the stability of the dispensing process. Moreover, a larger contact angle with the needle corresponded to a more stable dispensing process. However, the contact angle had little effect on the size of the droplet. The larger the surface tension, the faster the liquid bridge breakage. However, too large, or too small surface tension decreased the quality of the droplets. Furthermore, the longer the dispensing time, the larger the area of the droplet. Decreasing the needle lifting speed improved both the quality and symmetry of the droplet. After optimizing the dispensing process, the quality of the droplet was significantly improved. After curing, the tensile shear strength was significantly improved, and the porosity was greatly reduced. Therefore, the simulation results were reliable and the optimization scheme was effective. Since the viscosity, contact angle and the surface tension are very important parameters for the high viscous fluids, we believe that this research can be extended to evaluate other high viscous fluids, which provides a significant guide to the optimization of droplet deposition.
Data availability statement
The original contributions presented in the study are included in the article/supplementary material, further inquiries can be directed to the corresponding author.
Author contributions
Conceptualization, JZ; investigation, MH and FC; resources, DZ and DW; writing—original draft preparation, JZ; writing—review and editing, all authors; supervision, JZ; project administration, DW. All authors have read and agreed to the published version of the manuscript.
Conflict of interest
Author JZ, MH, DZ, FC and DW were employed by company China Electronics Technology Group Corporation No. 38.
The remaining authors declare that the research was conducted in the absence of any commercial or financial relationships that could be construed as a potential conflict of interest.
Publisher’s note
All claims expressed in this article are solely those of the authors and do not necessarily represent those of their affiliated organizations, or those of the publisher, the editors and the reviewers. Any product that may be evaluated in this article, or claim that may be made by its manufacturer, is not guaranteed or endorsed by the publisher.
References
Akbari, A., Hill, R. J., and van de Ven, T. G. M. (2015). Liquid-bridge breakup in contact-drop dispensing: Liquid-bridge stability with a free contact line. Phys. Rev. E 92 (2), 022404. doi:10.1103/physreve.92.022404
Anuar, S. K., Mariatti, M., Azizan, A., Mang, N. C., and Tham, W. T. (2011). Effect of different types of silver and epoxy systems on the properties of silver/epoxy conductive adhesives. Journalof Mater. Sci. Mater. Electron. 22 (7), 757–764. doi:10.1007/s10854-010-0207-7
Chen, A. U., Notz, P. K., and Basaran, O. A. (2002). Computational and experimental analysis of pinch-off and scaling. Phys. Rev. Lett. 88 (17), 174501. doi:10.1103/physrevlett.88.174501
Chen, C. P., Li, H. X., and Ding, H. (2007). Modeling and control of time-pressure dispensing for semiconductor manufacturing. Int. J. Automation Comput. 4 (4), 422–427. doi:10.1007/s11633-007-0422-8
Chen, X. B., Li, M. G., and Cao, N. (2009). Modeling of the fluid volume transferred in contact dispensing processes. IEEE Trans. Electron. Packag. Manuf. 32 (3), 133–137. doi:10.1109/tepm.2009.2020515
Chen, Y., Li, Q., Li, C., Dai, Z., Yan, H., Zhu, M., et al. (2020). Regulation of multidimensional silver nanostructures for high-performance composite conductive adhesives. Compos. Part A Appl. Sci. Manuf. 137, 106025. doi:10.1016/j.compositesa.2020.106025
Doshi, P., Suryo, R., Yildirim, O. E., McKinley, G. H., and Basaran, O. A. (2003). Scaling in pinch-off of generalized Newtonian fluids. J. Newt. Fluid Mech. 113 (1), 1–27. doi:10.1016/s0377-0257(03)00081-8
Du, P., Deng, G., Zhou, C., and Wu, T. (2015). “Simulation and experiment study on the jetting dispensing process driven by mechanical collision,” in 2015 16th International Conference on Electronic Packaging Technology (ICEPT), Changsha, China, 11-14 August 2015 (IEEE), 450–453.
Gilleo, K. (1995). Assembly with conductive adhesives. Solder. Surf. Mt. Technol. 7 (1), 12–17. doi:10.1108/eb037885
Harris, P. G. (1995). Conductive adhesives: A critical review of progress to date. Solder. Surf. Mt. Technol. 7 (2), 19–26. doi:10.1108/eb037894
Hirt, C. W., and Nichols, B. D. (1981). Volume of fluid (VOF) method for the dynamics of free boundaries. J. Comput. Phys. 39 (1), 201–225. doi:10.1016/0021-9991(81)90145-5
Kusaka, Y., Manaka, S., Abe, K., Yamamoto, N., and Ushijima, H. (2017). Experimental study on injecting highly viscous liquids by using a reciprocating needle dispensing system. Int. J. Adv. Manuf. Technol. 90 (5), 2243–2250. doi:10.1007/s00170-016-9538-8
Li, Y., and Sprittles, J. E. (2016). Capillary breakup of a liquid bridge: Identifying regimes and transitions. J. Fluid Mech. 797, 29–59. doi:10.1017/jfm.2016.276
Li, Y., and Wong, C. P. (2006). Recent advances of conductive adhesives as a lead-free alternative in electronic packaging: Materials, processing, reliability and applications. Mater. Sci. Eng. R Rep. 51 (1-3), 1–35. doi:10.1016/j.mser.2006.01.001
Liu, H., Chen, Y., Chen, X., and Jiang, S. (2022). Contact force–based method for controlling the dispensing volume of ultra-micro-adhesive. Int. J. Adv. Manuf. Technol. 121 (7), 5015–5033. doi:10.1007/s00170-022-09624-z
Lu, D. Q., Li, Y. G., and Wong, C. P. (2008). Recent advances in nano-conductive adhesives. J. Adhesion Sci. Technol. 22 (8-9), 815–834. doi:10.1163/156856108x305471
Luo, J., Cheng, Z., Li, C., Wang, L., Yu, C., Zhao, Y., et al. (2016). Electrically conductive adhesives based on thermoplastic polyurethane filled with silver flakes and carbon nanotubes. Compos. Sci. Technol. 129, 191–197. doi:10.1016/j.compscitech.2016.04.026
Lutfurakhmanov, A., Loken, G. K., Schulz, D. L., and Akhatov, I. S. (2010). Capillary-based liquid microdroplet deposition. Appl. Phys. Lett. 97 (12), 124107. doi:10.1063/1.3489918
McKinley, G. H., and Tripathi, A. (2000). How to extract the Newtonian viscosity from capillary breakup measurements in a filament rheometer. J. Rheology 44 (3), 653–670. doi:10.1122/1.551105
Mir, I., and Kumar, D. (2008). Recent advances in isotropic conductive adhesives for electronics packaging applications. Int. J. adhesion adhesives 28 (7), 362–371. doi:10.1016/j.ijadhadh.2007.10.004
Papageorgiou, D. (1995). Analytical description of the breakup of liquid jets. J. Fluid Mech. 301, 109–132. doi:10.1017/s002211209500382x
Pospischil, M., Kuchler, M., Klawitter, M., Rodríguez, C., Padilla, M., Efinger, R., et al. (2015). Dispensing technology on the route to an industrial metallization process. Energy Procedia 67, 138–146. doi:10.1016/j.egypro.2015.03.297
Pospischil, M., Specht, J., König, M., Horteis, M., Mohr, C., Clement, F., et al. (2013). Paste rheology correlating with dispensed finger geometry. IEEE J. Photovoltaics 4 (1), 498–503. doi:10.1109/jphotov.2013.2278657
Reisgen, U., and Scheik, S. (2008). Multidimensional line dispensing of unfilled adhesives. Microsyst. Technol. 14 (12), 1895–1901. doi:10.1007/s00542-008-0624-1
Yao, Y., Lu, S., and Liu, Y. (2011). Numerical simulation of droplet formation in contact micro-liquid dispensing[C]//2011 third international conference on measuring technology and mechatronics automation. IEEE 2, 709–712.
Yim, S. G., Hwang, Y. H., An, S., Seong, K. Y., Kim, S. Y., Kim, S., et al. (2022). Low-temperature multiple micro-dispensing on microneedles for accurate transcutaneous smallpox vaccination. J. Vaccines 10 (4), 561. doi:10.3390/vaccines10040561
Zhang, C., Sun, L., Huang, B., Yang, X., Chu, Y., and Zhan, B. (2019). Electrical and mechanical properties of CNT/CB dual filler conductive adhesives (DFCAs) for automotive multi-material joints. Compos. Struct. 225, 111183. doi:10.1016/j.compstruct.2019.111183
Zhu, P., Ma, H., Shu, F., Wang, X., Wang, Y., Diao, X., et al. (2023). Magnet-actuated loading of magnetic conductive high-viscosity droplets. Precis. Eng. 79, 164–172. doi:10.1016/j.precisioneng.2022.10.003
Keywords: contact dispensing, conductive adhesives, modeling, morphogical structure, droplet deposition
Citation: Zou J, Huang M, Zhao D, Chen F and Wang D (2023) Modeling the contact dispensing process of conductive adhesives with different viscosities and optimization of droplet deposition. Front. Mater. 10:1183747. doi: 10.3389/fmats.2023.1183747
Received: 10 March 2023; Accepted: 19 April 2023;
Published: 05 May 2023.
Edited by:
Donghong Yu, Aalborg University, DenmarkReviewed by:
Massimo Mastrangeli, Delft University of Technology, NetherlandsZhuo Chen, Central South University, China
Copyright © 2023 Zou, Huang, Zhao, Chen and Wang. This is an open-access article distributed under the terms of the Creative Commons Attribution License (CC BY). The use, distribution or reproduction in other forums is permitted, provided the original author(s) and the copyright owner(s) are credited and that the original publication in this journal is cited, in accordance with accepted academic practice. No use, distribution or reproduction is permitted which does not comply with these terms.
*Correspondence: Jiajia Zou, amlhamlhX3pvdTIwMjJAMTYzLmNvbQ==