 Asghar Ali1
 Muhammad Amin1*
 Muhammad Tahir2,3*
 S. S. Ali4Asif Hussain1,5Imtiaz Ahmad6Asif Mahmood7
 M. Umer Farooq8Muhammad Asim Farid9
- 1Department of Physics, The University of Lahore, Lahore, Pakistan
- 2Division of Science and Technology, University of Education Lahore, Vehari, Pakistan
- 3School of Chemical Engineering, University of Birmingham, Birmingham, United Kingdom
- 4School of Physical Sciences, University of the Punjab, Lahore, Pakistan
- 5College of Environmental Science and Engineering, Yangzhou University, Yangzhou, China
- 6Department of Physics and Astronomy, Texas Tech University, Lubbock, TX, United States
- 7Chemical Engineering Department, College of Engineering, King Saud University, Riyadh, Saudi Arabia
- 8Department of Chemistry, University of Education Lahore (Vehari Campus), Vehari, Pakistan
- 9Department of Physics, Division of Science and Technology, University of Education Lahore, Vehari, Pakistan
This study applied the solid-state reaction technique to synthesize g-C3N4, Fe3O4, and g-C3N4/Fe3O4 composites in various ratios. XRD confirmed the formation of g-C3N4, Fe3O4, and a g-C3N4/Fe3O4 heterostructure. SEM confirmed the rod-shaped structure of Fe2O3 and the layered-like fabrication of g-C3N4. The Eg of g-C3N4/Fe3O4 was approximately 1.9 eV, making it a beneficial composite material for visible response in photocatalysis activity, which was confirmed by UV-Vis spectroscopy. Dielectrics were used to study ferrite nanoparticles and provide information on the mechanism of conductivity in the parts of the dielectric that responded to an applied alternating electric field. In polycrystalline ceramics, the resistive and capacitive grains, contributions, electrode specimen interfaces, and grain boundaries may all be distinguished using impedance analysis, a crucial tool for the study of complicated electrical performance. The g-C3N4/Fe3O4 composite material showed high photocatalytic activity against methylene blue (MB) dye.
1 Introduction
Water pollution has greatly increased due to industrialization, urbanization, and the absolute discharge of industrial and organic pollutants into water sources (Goel, 2006; Hussain et al., 2021). The large amounts of wastewater from many types of dyeing enterprises contain unused dyes and other chemicals (Shindhal et al., 2021). These pigments are mostly toxic and non-biodegradable (Najar and Najar, 2019). Pigment waste pollutes both subsurface and surface water, with negative consequences on vegetation and animals (Chowdhary et al., 2020). Methylene blue (MB) is the most widely used thiazine stain in the fabric industry. Its harmful effects include gastrointestinal irritation, cyanosis, and skin irritation (Khan et al., 2022). Many chemical and physical techniques, including flocculation-coagulation, ion exchange, surface adsorption, degradation of photocatalytic systems, and chemical precipitation, have been used to solve the challenge of the elimination of the dye from contaminated water (Vishnu et al., 2022). Among these, photodegradation is better than alternative techniques. In the context of the fundamental investigational technique and the existence of semiconductors under adequate light exposure, organic dye particles decompose into straightforward non-toxic byproducts (Som et al., 2020). TiO2, CuO, ZnO, and other materials have been extensively utilized as photocatalysts for semiconductor-assisted photocatalytic processes (Nemiwal et al., 2021). However, owing to their significant band gaps, which account for only approximately 3%–5% of sunlight, they only function as photocatalysts when exposed to ultraviolet (UV) light (Arora et al., 2022). Therefore, highly efficient visible-light catalysts remain the subject of extensive research due to their potential for numerous applications, including energy consumption and environmental pollution control.
The band gap of 2.7 electron volts (eV) of graphite-like carbon nitride (two-dimensional) (g-C3N4), which can absorb visible light, is a typical semiconductor; moreover, it is polymeric and a non-metal material (Hu et al., 2020). Owing to its proper band gap, high stability, and simple preparation method, g-C3N4 is mostly used in applications related to pollution degradation (Liu et al., 2021). Furthermore, researchers have worked hard to improve the effectiveness of g-C3N4 photocatalysis by doping it with non-metallic or metallic elements (Chi, 2021) or coupling it with other organic dyes (Gurylev, 2021), halides (Zhang et al., 2020), or semiconductors.
However, in nature, g-C3N4 nanomaterials are highly dissolved. They cannot be recycled or reused due to a lack of catalyst-friendly environments. Fe3O4 nanoparticles with an outer magnetic field in a solution can be easily removed as they exhibit super-para-magnetism. Fe3O4 synthesis is easy and has good magnetic properties compared to all other super-paramagnetic materials. The conduction and valence band edges of Fe3O4 were −0.24 eV and 1.44 eV, and −1.61 eV and 1.73 eV for g-C3 N4 (Hussain et al., 2023a; Hussain et al., 2023b). Therefore, it was suitable for making a heterostructure and suppressing the recombination rate. Both Fe3O4 and g-C3N4 have band gap energies in the visible region. Therefore, they cover a broad spectrum of light, resulting in increased photocatalytic activity (Hussain et al., 2022a; Hussain et al., 2022b). Consequently, Fe3O4-based nanoparticles have been used in different research fields, including drug distribution procedures (Li et al., 2011), solid-phase extraction [26], and lithium storage in lithium-ion batteries (Yang et al., 2014). Magnetic nanocomposites of Fe3O4 and TiO2 are regularly used for pollutant degradation (Xuan et al., 2009; Jing et al., 2013). Therefore, combining Fe3O4 with g-C3N4 may increase nanomaterial durability and make it easier to extract Fe3O4/g-C3N4 nanocomposites from suspensions in external magnetic fields. By encouraging the charge carrier’s separation, the heterostructure of g-C3N4 and Fe3O4 increases visible light absorption and suppresses the electron and hole recombination rates. Numerous amino groups have been identified on the edges and surfaces of g-C3N4 and form coordination compounds with metal ions. Therefore, the edges or surfaces of g-C3N4 can be doped with coordination doping caused by metal ions (Lai et al., 2023). Different photocatalysts have been used for contaminant removal, such as the methylene blue dye with g-C3N4 and Fe3O4. Comparative studies on the degradation of MO using g-C3N4 and Fe3O4 are listed in Table 1.
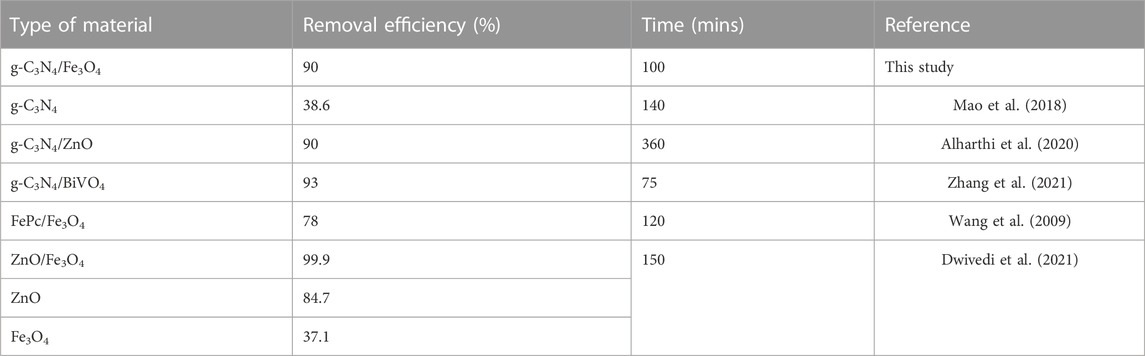
TABLE 1. Comparisons of MB degradation analysis reported in various studies.
However, this study used a photocatalysis process to degrade the pollutants, utilizing optimized photocatalyst composites to achieve higher photocatalytic activity. We applied a facile approach for the synthesis of g-C3N4/Fe3O4 composites with different ratios, such as 1:1, 60:40, 70:30, 80:20, and 90:10. While different studies have reported the composites of g-C3N4/Fe3O4, ours is the first study to determine the optimized ratio for enhanced photocatalytic activity. We have largely increased the quantity of one material and decreased the quantity of the second material. In the 1:1 ratio, both materials show good structural, optical, and photocatalytic properties. These are magnetic and electrical materials; therefore, at a 1:1 ratio, these materials can be used in other optical, magnetic, and electronic instruments to increase efficiency and reduce device costs.
2 Experiments
Materials: Urea, iron chloride, iron sulfate FeSO4.7H2O (99–100%), FeCl3.6H2O (99.0%), ammonia (25–28%), and distilled water. All other solvents were purchased from Sigma-Aldrich and were 99.6% pure. The materials were used without further modification.
2.1 Fabrication of g-C3N4
g-C3N4 was synthesized at 550°C for 5 h during thermal polymerization (pyrolysis) using urea as a precursor, at a temperature of 5°C/min. After cooling, powdered g-C3N4 was obtained by grinding.
2.2 Fabrication of Fe3O4 and g-C3N4/Fe3O4 composite
By default, g-C3N4 (0.68 g) was dispersed in 90.0 mL of distilled water mixed with FeCl3 (0.94 g) and FeSO4 (1 g) before being added to 10 mL NH4OH and stirring for 1 h at 70°C. Next, until the pH reached 10.0, the ammonia solution was added dropwise to the reaction mixture. The powder was obtained after centrifuging and washing three times with ethanol and distilled water. The particles were dehydrated at 70°C for 12 h. Composites of g-C3N4/Fe3O4 were prepared in ratios of 1:1, 50:50, 60:40, 70:30, 80:20, and 90:10 to study the effect on this change on the energy band gap (in eV) and its effect on MB dye degradation. Pellets were fabricated using the hydraulic press (Apex) from each composition’s final product. By applying a pressure of 4 tons, each pellet’s diameter was 10 mm. The pellets were then sintered in a muffle furnace for 2 h at 310°C. These pellets were used for the assessment of dielectric properties.
2.3 Characterizations
The crystal structure and phase development of the samples were assessed using a Rigaku D/MAX-IIA X-ray diffractometer (XRD). The wavelength was 1.5406 A° and ranged from 10 to 70°. A Nova-Nano scanning electron microscope (SEM) 450-FESEM was used to examine the morphological features of the produced specimens. The frequency-dependent dielectric characteristics of the present specimens were explored on a Wayne Kerr (6500 B) precision impedance analyzer with copper electrodes through 20 Hz to 20 MHz. The original synthesized material was in powder form. For dielectric measurements, pellets with diameters of 1.01 cm and thicknesses of 0.1 cm were made from powder using an Apex hydraulic press under a pressure of 4 tons for 2 min in each case. All processes were performed at room temperature.
2.4 Photocatalytic tests
The photocatalytic performances of the Fe3O4/g-C3N4 composites were tested in glass reactors. In an MB aqueous solution (60 mL, 5 mg L-1), 0.020 g of the sample was dispersed in each experiment. The Xe lamp (500 W output) served as the light source. The chemical solution was agitated magnetically in the dark for 65 min to attain MB saturation absorption onto the catalyst before irradiation. The following equation was used to determine the percentage of MB degradation.
In Eq. 1, η, Аt, and А0 represent the degradation efficiency, verified concentration at time “t”, and initial concentration at “t = 0”, respectively.
3 Results and discussion
3.1 X-ray diffraction
The XRD patterns of g-C3N4, Fe3O4, and their composites are shown in Figure 1A. The g-C3N4 nanosheets exhibited two stable peaks along with g-C3N4, indicating that the crystal structures of the nanosheets and bulk g-C3N4 were essentially the same. The reflection peak at 13.1° with an hkl value of (100), originating from lattice planes along the c-axis (Figure 1A), was less apparent in nano-sheets. The peak occurs due to the commonly decreasing layer planar size during the thermal oxidation etch of bulk g-C3N4. The g-C3N4 nanoparticles showed the same effect (Niu et al., 2012). Compared to bulk g-C3N4, the peak initiating from the repeated layering in nanosheets moved from 27.23° to an hkl value of (002), indicating closer spacing between the sheets. The individual layers in bulk g-C3N4 are said to be fluctuating but might be made planar by additional heating, leading to compact stacking. Since the gallery distance decreased due to annealing during thermal oxidation, a denser packing should have formed in our situation (Zhou and Qiu, 2019). In previous studies, the g-C3N4 pure XRD spectrum showed two prominent peaks at 2θ of 2.23 and 13.1° (Yang et al., 2020). Therefore, the normal distribution of the (002) interfacial diffraction peak high value may be the cause of the strong height of 27.23°, while the interlayer structure’s (13.1°) significant value (100) may be the cause of the peak’s strong height (Tang et al., 2018). The characteristic peaks (Figure 1A) of the g-C3N4 were prepared by urea, as shown by the aforementioned data and the crystal database JCPDS 87–1,526, which have no additional impurity peaks, showing that g-C3N4 was effectively synthesized. Because of the long-range interplanar layering of the aromatic structure, the sharp peak at 27.23° belongs to d = 0.324 nm and is identified as the (002) plane of bulk g-C3N4. The minor peak at 13.1° belongs to the (100) plane with d = 0.676 nm.
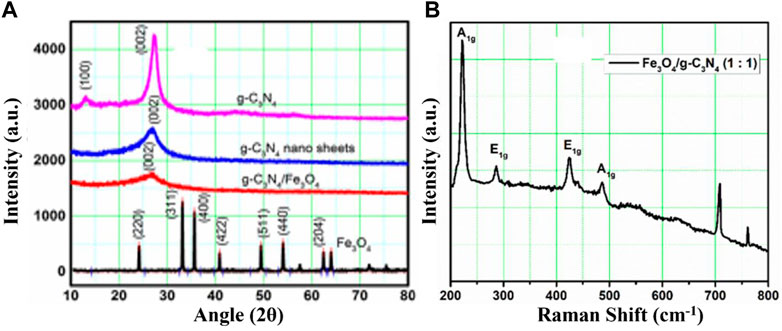
FIGURE 1. (A) XRD pattern and (B) Raman spectra of g-C3N4, g-C3N4 nano sheets, Fe3O4, and g-C3N4/Fe3O4 composites.
Figure 1A shows the formation of the Fe3O4 nanoparticles. The peak position hkl values of (220), (311), (400), (422), (511), and (440) are clearly visible, showing the presence of a crystalline spinel phase composed of magnetite (Fe3O4) iron oxide. In the composite 1:1 of g-C3N4/Fe3O4, the peak of g-C3N4 shows low intensity. This confirmed the formation of a heterostructure.
The Fe2O3@g-C3N4 (1:1) NCs’ Raman spectra are depicted in Figure 1B. Fe2O3-NPs showed distinctive Raman bands with Raman shifts of 607, 410, 294, and 221 cm-1, which corresponded to the E1g, E1g, E1g, and A1g Raman modes, respectively. Raman peaks were likewise examined at ∼480, ∼708, and ∼760 for g-C3N4. The s-triazine ring was indicated by the strongest peak of g-C3N4 at 708 cm-1 (Kang et al., 2018). The production of an NC of g-C3N4 and Fe3O4 was confirmed by the presence of both g-C3N4 and Fe3O4 peaks.
3.2 UV-Vis spectroscopy and Raman analysis
The band gap energy (Eg) of the produced sample was derived by the following Tauc equation to fit the investigation’s absorption data (Pareek et al., 2018; Zhu and Zhou, 2021).
where hν and α are the photon energy and adsorption coefficient, respectively. The contact of the extended linear component of the (αhν) (Hussain et al., 2021) against the curve axis of the (hν) axis yields the Eg value. The Eg values of the g-C3N4/Fe3O4 nanocomposite, g-C3N4, and Fe3O4 are 1.9 eV, 2.7 eV, and 2.4 eV, respectively (Figure 2). These Eg values indicate that each compound and its nanocomposites were semiconductors in nature (Usman et al., 2019; Zhu and Zhou, 2021).
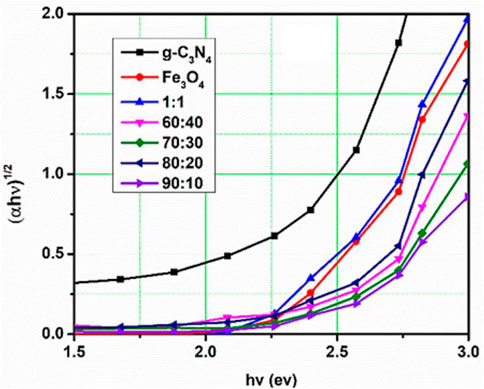
FIGURE 2. Tauc plot of g-C3N4, g-C3N4 nano sheets, Fe3O4, and g-C3N4/Fe3O4 composites.
Figure 2 shows that the Eg of the composite g-C3N4/Fe3O4 prepared in the ratios of 1:1, 50:50, 60:40, 70:30, 80:20, and 90:10 decreased gradually to less than that of pure g-C3N4. Hence, the absorbance value of a pure g-C3N4 sample was lower than that for the composite g-C3N4/Fe3O4 ratios, which signified that composites were good photo-absorbers and photocatalysts.
3.3 Scanning electron microscopy (SEM) analysis
SEM micrographs of Fe3O4, g-C3N4, and their composites are shown in Figure 3. Fe3O4 showed a rod-like structure in SEM images. This structure is good for photocatalysis due to its high electron mobility. Regarding the weak van der Waals among layers in the graphite, g-C3N4 has a layered structure, while the assembly of the planar bonding is completely different.
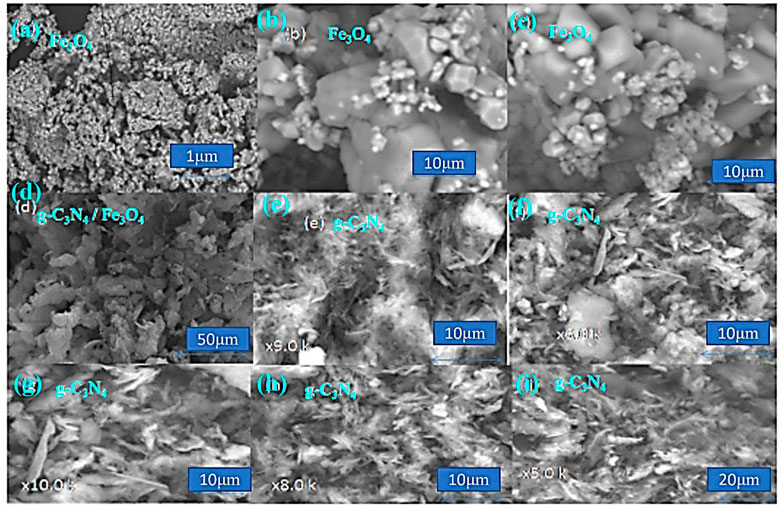
FIGURE 3. SEM micrographs of (A–C) Fe3O4, (D) g-C3N4/Fe3O4, and (E–I) g-C3N4.
The tri-s-triazine (heptazine) rings, which are connected to the structure’s hypothesized aggregated mlem, are the energetically preferred form of g-C3N4. The composite materials showed both rod-like and layered structures, which confirmed the formation of composite materials.
Chemical mixing draws graphite with fewer or more pages while maintaining its composite structure. The main structure was composed of thick micron-sized particles evenly distributed throughout the sample area. Most of the particles had many full layers and hard surfaces.
3.4 Dielectric properties
Evaluation of the dielectric characteristics of ferrite nanoparticles provides information about the mechanism of conductivity in the parts of the dielectric that respond to an applied alternating electric field. These properties are dependent on various factors, such as the mode of production, chemical composition, stoichiometry, porosity of the ion charge, particle size, and cation distribution between the octahedral and tetrahedral structures (Khan et al., 2020). In the current study, dielectric parameters, such as capacitance, and the dielectric loss angle (tan δ) were assessed using an LCR meter at room temperature. The real part of the permittivity (ε′), the imaginary part of the permittivity (ε") or dielectric loss factor, and AC conductivity (
The capacitance of the pellet is represented by “C”. Its unit is the farad. The thickness of the pellet is measured in meters, and its symbol is d. The cross-sectional area of the flat pellet surface is A. εo is the permeability of free space, and f is the frequency. Figures 4A–D show the behavior of ε′, tan δ, and ε'', respectively, at the applied frequency. The stored energy can be described by the permittivity (ε′). ε′ has a higher value in the lower-frequency range and decreases with increasing frequency, consistent with the default behavior in most ferrite materials. The reduced ε′ with greater frequency occurs because at higher frequencies, there is a time delay for each detected security. It also contributes to the polarization of the applied field (polarization cartridge damping), which leads to a reduced ε′, and is assigned to the contribution to the electric polarizability (Prakash and Vasudevan, 2020). The reason for this change may be related to the g-C3N4 concentration, in which there is less of a chance to jump on grain boundaries. This will increase the grain boundary charge and, thus, the value of ε′ changes (Patnaik et al., 2020). If the amount of iron ions is high, then the permittivity is high due to the presence of Fe ions in the S octahedral region (Khorsandi et al., 2021). Therefore, these ions can produce high polarization.
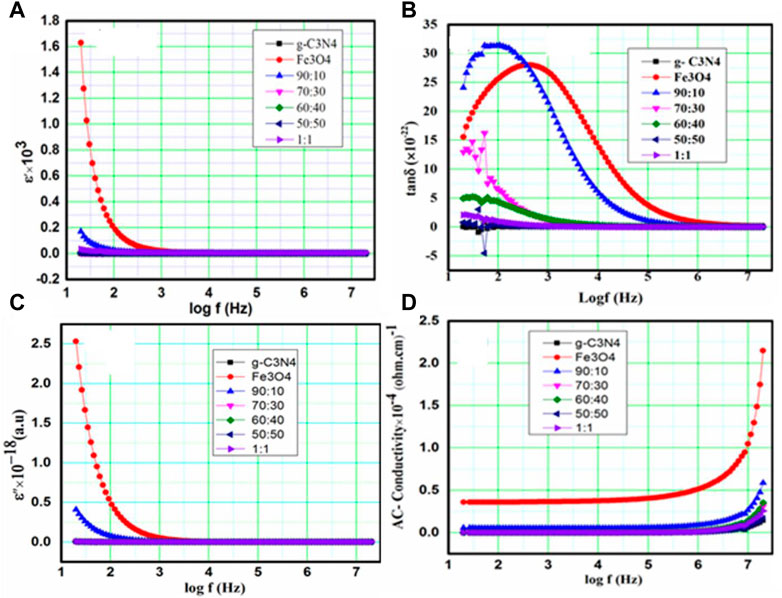
FIGURE 4. (A–D): Behaviors of the (A) dielectric constant (ε′), (B) dielectric loss angle (tanδ), (C) dielectric loss factor (ε''), and (D) AC conductivity (
3.4.1 Variations in dielectric loss tangent (tanδ) and dielectric loss factor (ε'') with frequency
Dielectric loss occurs due to energy dissipation in the dielectric materials and is explained in terms of tan δ and ε''. It appears as a result of impurities and poor crystal lattice in the material, leading to polarization lagging of the supplied alternating field (Liu et al., 2020). Figures 4A, B show the variation in tan δ and ε'', respectively, as a function of
3.4.2 AC conductivity
The frequency-dependent AC conductivity (σac) spectra of Fe3O4, g-C3N4, and composite g-C3N4/Fe3O4 are explained in Figure 4D. The spectra demonstrated that all samples have very low σac values at low frequencies, indicating considerable resistance. After a certain high frequency, conductivity steadily increased. These types of processes are explained in Koop’s model. This concept states that low conductivity at lower f is caused by weakly conducting grain boundaries, while strong conductivity at higher f is caused by highly conducting grains (Guo et al., 2021). The electron-hopping frequencies between Fe3+ and Fe2+ are severely hampered at lower frequencies (Wu and Zhu, 2019). Therefore, the observed conductivity of the material at a lower frequency is lower. However, as the frequency of the applied field rises, the conductive grain becomes highly active by promoting electron hopping between nearby ions and enhancing the interaction between ferrous iron (Fe2+) and ferric iron (Fe3+) ions on the octahedral sites. Consequently, the electrical conductivity increases with the frequency. The AC conductivity of g-C3N4 was low because the conductivity of polycrystalline materials declines with reducing grain size. Smaller grains contain more insulating grain borders and a smaller contact area between grains, which inhibit electron flow and, in turn, increase conductivity (Xi and Chung, 2021). In general, conductivity and permittivity are significantly influenced by grain size, stoichiometry, porosity, grain borders, and crystal defects.
3.4.3 Impedance analysis
In polycrystalline ceramics, impedance analysis is a crucial technique for separating resistive and capacitive grains, grain boundaries, and contributions, as well as electrode specimen interfaces, when studying complex electrical performances (Tiwari et al., 2020). The boundaries between grains are typically of a distinct conducting nature. This will depend on the nature of the sample used, and the temperature and frequency range of the test. The present study used dielectric materials with dipolar rotation in their electrical properties, as well as materials used in electronic conduction, for impedance spectroscopy studies.
Figures 5A–D show the impedance spectroscopy output characteristics as a sequence of semi-circles with various radii and/or origins. The electrical phenomena representation occurs because of the grain boundaries, grains, and interface polarization when their graph is drawn in the complex plane (Mazen et al., 2021). The electrical conductivity was measured using AC-impedance analysis, which showed that depending on their chemical composition, a wide range of materials with electric, anti-ferroelectric, or paraelectric phases and slightly different dielectric properties formed crystal structures of varying sizes. Understanding the electrical conductivity of this type of ferroelectric and its physical characteristics is crucial (Fu et al., 2021). The internal defects in the material, such as the A-site vacancy, electron space charges, or oxygen, have significant effects on the electrical conductivity of the material. Therefore, it is important to have a basic understanding of their mechanics and the methods in the context of the defect mechanisms because of the different types of faults that are recommended for the relaxation of insulation material in high temperature ranges (Krauskopf et al., 2020). The formulas for impedance are as follows (Jha, 2013):
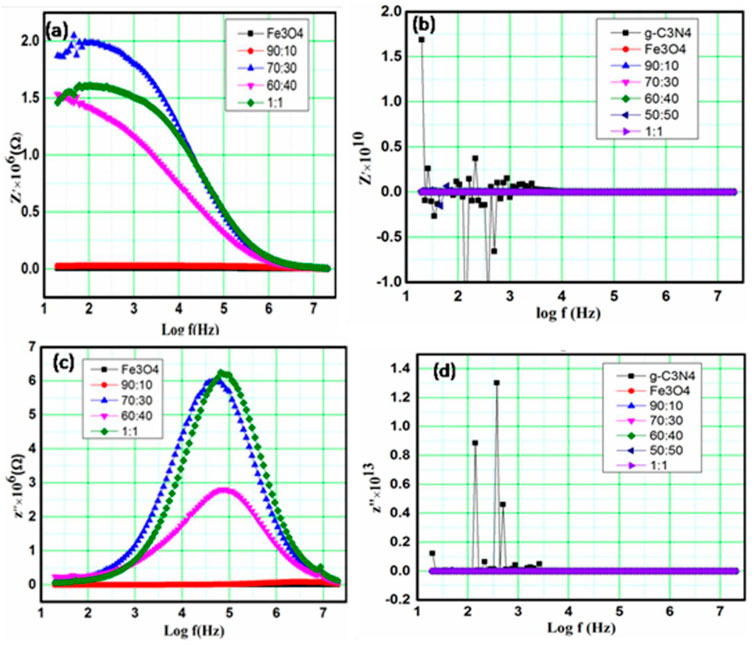
FIGURE 5. (A–D) Frequency dependence for real and imaginary parts of the electric impedance for Fe3O4, g-C3N4, and composite g-C3N4/Fe3O4 with different ratios.
3.4.4 Modulus study
The modulus spectroscopy of graphs helps us identify the spectral components of the material; those showing a different capacitance but the same resistance. The e-modulus formula also has the benefit of suppressing the electrode effect (Oliveira et al., 2019). Therefore, this is the optimal method for learning the spectroscopy of complex moduli. The value of the electric modulus (M*) can be estimated based on the following: The formulas for real modulus and imaginary modulus are as follows (Joshi et al., 2017; Rayssi et al., 2018):
The complex electric module of formalization and analysis revealed the nature of polycrystalline and grain boundary effects. Figure 6 displays the complex modulus spectrum for M′ and M΄, in which the arc was the electrical phenomenon with the lowest capacity to perform in a high-voltage system. Arcs appearing in the spectra demonstrate the ceramic’s phase characteristics. In addition, the non-semi-circular arc proved that electrical relaxation phenomena existed in the Behera.
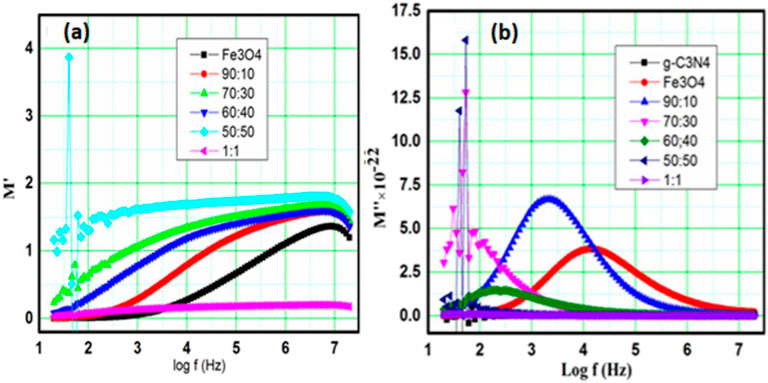
FIGURE 6. Frequency-dependent (A) real and (B) imaginary moduli of Fe3O4, g-C3N4, and composite g-C3N4/Fe3O4 with different ratios.
Figure 6A shows the relationship of M′ with frequency. Except for g-C3N4, for which the real modulus M′ stayed essentially the same over the whole frequency range, M′ increased to a maximum value with greater frequency for all samples. This clarified the large frequency range across which relaxation processes occur. For g-C3N4, Fe3O4 = 0, which verified that the real modulus Mʹ remained the same because of g-C3N4 and other composite samples as a result of Fe3O4 and g-C3N4. Owing to the charge carriers’ limited mobility, conduction phenomena may be present. Figure 6B depicts the frequency-dependent imaginary component of the electrical modulus M΄΄. As the frequency and Fe3O4 content increased (up to 90%), the imaginary modulus M shifted to the high-frequency side. This is considered a non-Debye type of relaxation because the maximum peaks on either side of M″ are asymmetric and wider, demonstrating the distribution of relaxation periods rather than a single time constant (Arya and Sharma, 2018). The real modulus M″ maximum shifted toward a small frequency area for sample 70:30, indicating greater conduction. Therefore, at lower and higher frequencies, charge carriers can travel over short and long distances, respectively. The maximum real modulus M″ indicates a change in mobility from long to short range. The asymmetric modulus peaks will move in the direction of a higher frequency, which demonstrated the relationship between the movements of the mobile ion charges. The non-Debye type is implied by the asymmetry in the peak broadening due to a spread in the relaxation time caused by various time constants. The presence of low-frequency peaks points to the possibility of long-distance ion transport, while high-frequency peaks point to the possibility of ion confinement in a potential well.
3.5 Photocatalytic activity
The photocatalytic activity (PCA) values of the degradation of the methylene blue dye under visible light for g-C3N4, Fe3O4, and g-C3N4/Fe3O4 composites (1:1, 60:40, 70:30, 80:20, and 90:10) were 53, 38, 89, 88, 83, 80, and 59, respectively.
3.5.1 Evaluation of the phоtо-catаlytic activity
The rate соnstаnt of the рhоtо-degrаdаtiоn kinetics of the MB is shown in Figures 7A–J). Fe3О4 has a small PCA compared to MB under visible light irradiation, while Fe3О4/g-С3N4 nаnо-соmроsites and g-С3N4 nanosheets were effective under the same соnditiоns. In the nаnо-соmроsite materials, the electrons migrated easily to Fe3О4 NPs due to the lower conduction band (СB) of Fe3О4 compared to g-С3N4. Thus, the PCA improved and the rate of photogenerated electrons and holes was effectively reduced. The 1:1 NC showed the highest PCA (89%). However, photogenerated electrons (e−) have strong reductive properties. Photogenerated holes (h+) possess high oxidizing characteristics and can interact with MB to produce CO2 and H2O. They form OH ions when they react with H2О or О2. Therefore, an improved PCA of the iron oxide and Fe3О4/g-С3N4 nаnо-соmроsite was obtained. Compared to the g-C3N4 nanosheets, the 1:1 nano-composites showed higher-level photocatalytic effects, which were attributed to their greater dispersibility when combined with Fe3O4 nanocomposites. Owing to the reduced amounts of g-C3N4 in the 80:20, 70:30, and 60:40 nanocomposites compared to the g-C3N4 nanosheets, they showed weaker catalytic effects.
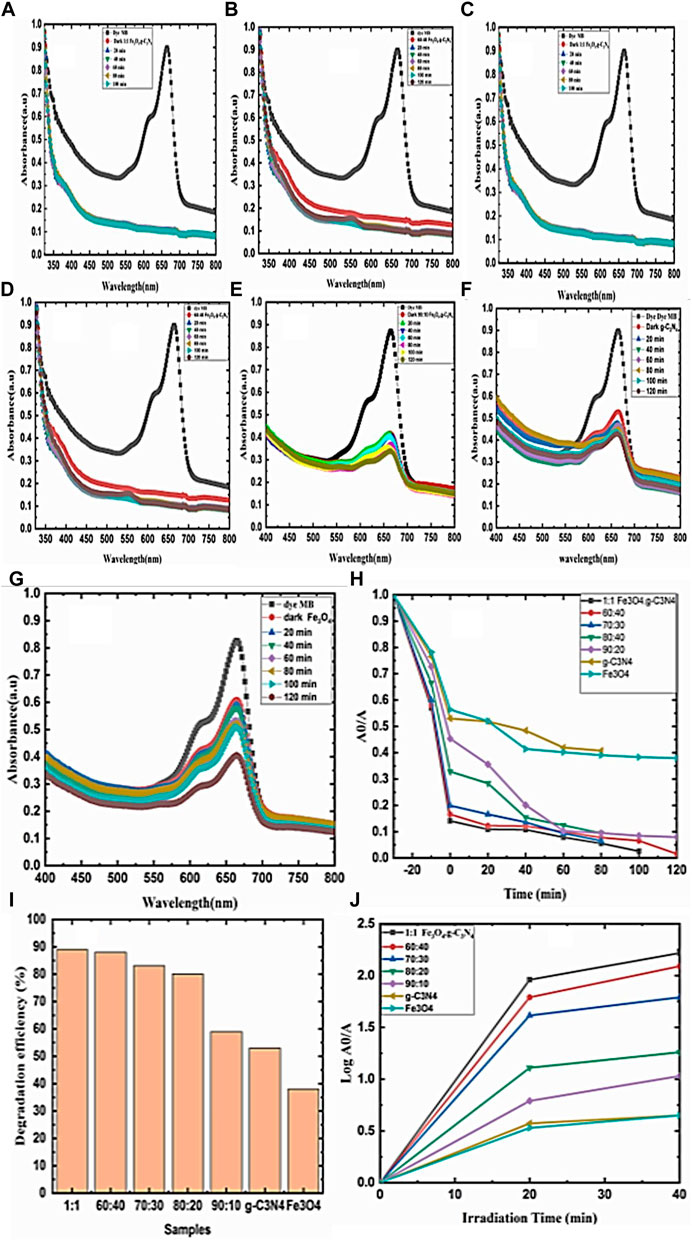
FIGURE 7. (A–G) Relationship between wavelength and absorbance. (H) Relationship between time and A0/A. (I) Relationship between samples and degradation efficiency. (J) Relationship between log A0/A and irradiation time.
4 Conclusion
In conclusion, this study used solid-state reactions and sol-gel techniques to synthesize g-C3N4, Fe3O4, and g-C3N4/Fe3O4 with diverse proportions of g-C3N4 and Fe3O4. The formation of nano-sheet structures of g-C3N4, the cubic phase of Fe3O4, and g-C3N4/Fe3O4 nano-composites were confirmed by XRD. In SEM, Fe3O4 showed a rod-like structure, g-C3N4 showed a layered-like structure, and the composites showed both rod-like and layered-like structures. The composites at the 1:1 ratio showed a small Eg, according to UV-Vis spectroscopy. This is due to the formation of defective sites at the junction of two semiconductors. The PCA of the magnetically separated g-C3N4/Fe3O4 catalysts under visible light illumination was up to 1.8 times greater for MB dye compared with the pure g-C3N4. Owing to the synergistic interactions between Fe3O4 and g-C3N4, which increase the migratory performance of photo-generated charge carriers, the PCA is boosted. Our findings indicate the new design possibilities of the solutions reported here open the field for recycled photocatalysts that are magnetically separable and have good visible light PCA.
Data availability statement
The raw data supporting the conclusion of this article will be made available by the authors, without undue reservation.
Author contributions
AA: writing original draft; MA: revision and methodology; MT: writing original draft; SA: supervision and project administration; AH: manuscript revision; IA: contribution to the structural properties; AM: funding and project administration; MUF: supervision and project administration; MAF: explanation of optical analysis.
Acknowledgments
The authors would like to acknowledge the Researchers Supporting Project number (RSP2023R43), King Saud University, Riyadh, Saudi Arabia.
Conflict of interest
The authors declare that the research was conducted in the absence of any commercial or financial relationships that could be construed as a potential conflict of interest.
The handling editor FI declared a shared affiliation with author SA at the time of the review.
Publisher’s note
All claims expressed in this article are solely those of the authors and do not necessarily represent those of their affiliated organizations, or those of the publisher, the editors, and the reviewers. Any product that may be evaluated in this article, or claim that may be made by its manufacturer, is not guaranteed or endorsed by the publisher.
References
Alharthi, F. A., Ali Alghamdi, A., Alanazi, H. S., Alsyahi, A. A., and Ahmad, N. (2020). Photocatalytic degradation of the light sensitive organic dyes: Methylene blue and rose bengal by using urea derived g-C3N4/ZnO nanocomposites. Catalysts 10 (12), 1457. doi:10.3390/catal10121457
Arora, I., Chawla, H., Chandra, A., Sagadevan, S., and Garg, S. (2022). Advances in the strategies for enhancing the photocatalytic activity of TiO2: Conversion from UV-light active to visible-light active photocatalyst. Inorg. Chem. Commun. 143, 109700. doi:10.1016/j.inoche.2022.109700
Arya, A., and Sharma, A. (2018). Structural, electrical properties and dielectric relaxations in Na+-ion-conducting solid polymer electrolyte. J. Phys. Condens. Matter 30 (16), 165402. doi:10.1088/1361-648x/aab466
Chi, Z. (2021). Prospects for the application of advanced oxidation technology in the treatment of pharmaceutical wastewaters.
Chowdhary, P., Bharagava, R. N., Mishra, S., and Khan, N. (2020). “Role of industries in water scarcity and its adverse effects on environment and human health,” in Environmental concerns and sustainable development (Berlin, Germany: Springer), 235–256.
Dwivedi, P., Jatrana, I., Khan, A. U., Satiya, H., and Khan, M. (2021). Photoremediation of methylene blue by biosynthesized ZnO/Fe3O4 nanocomposites using callistemon viminalis leaves aqueous extract: A comparative study. Nanotechnol. Rev. 10 (1), 1912–1925. doi:10.1515/ntrev-2021-0117
Fu, D. W., Gao, J. X., Huang, P. Z., Ren, R., Shao, T., Han, L., et al. (2021). Observation of transition from ferroelasticity to ferroelectricity by solvent selective effect in anilinium bromide. Angew. Chem. Int. Ed. 60 (15), 8198–8202. doi:10.1002/anie.202015219
Guo, F., Zhang, X., Cai, H., Fan, X., Hu, L., Sun, W., et al. (2021). Effect of doping location induced anisotropy on thermophysical properties of dilute Fe2O3-Y2O3-ZrO2 solid solutions. J. Am. Ceram. Soc. 104, 4742–4758. doi:10.1111/jace.17858
Gurylev, V. (2021). Nanostructured photocatalyst via defect engineering: Basic knowledge and recent advances. Berlin, Germany: Springer.
Hossen, M. B., and Hossain, A. A. (2012). AC resistivity and frequency dependence of the dielectric properties for Al doped NiCuZn ferrites. United States: IEEE, 903–907.
Hu, X., Hu, J., Peng, Q., Ma, X., Dong, S., and Wang, H. (2020). Construction of 2D all-solid-state Z-scheme g-C3N4/BiOI/RGO hybrid structure immobilized on Ni foam for CO2 reduction and pollutant degradation. Mater. Res. Bull. 122, 110682. doi:10.1016/j.materresbull.2019.110682
Hussain, A., Ali, N., Ali, S., Hou, J., Aslam, I., Naeem, H., et al. (2022). Diverse morphological study for nonmetal-doped g-C3N4 composites with narrow bandgap for improved photocatalytic activity. Res. Chem. Intermed. 48 (7), 2857–2870. doi:10.1007/s11164-022-04750-5
Hussain, A., Hou, J., Tahir, M., Ali, S., Rehman, Z. U., Bilal, M., et al. (2022). Recent advances in BiOX-based photocatalysts to enhanced efficiency for energy and environment applications. Catal. Rev. 22, 1–55. doi:10.1080/01614940.2022.2041836
Hussain, A., Hou, J., Tahir, M., Wang, X., Qadri, M. U., Jiang, T., et al. (2021). Fine-tuning internal electric field of BiOBr for suppressed charge recombination. J. Environ. Chem. Eng. 9 (1), 104766. doi:10.1016/j.jece.2020.104766
Hussain, A., Maqsood, S., Ji, R., Zhang, Q., Farooq, M. U., Boota, M., et al. (2023). Investigation of transition metal-doped graphitic carbon nitride for MO dye degradation. Diam. Relat. Mater. 132, 109648. doi:10.1016/j.diamond.2022.109648
Hussain, A., Tahir, M., Yang, W., Ji, R., Zheng, K., Umer, M., et al. (2023). Synergic effect among activated carbon/sulphur-assisted graphitic carbon nitride for enhanced photocatalytic activity. Diam. Relat. Mater. 135, 109836. doi:10.1016/j.diamond.2023.109836
Jha, A. (2013). Electrical characterization of zirconium substituted barium titanate using complex impedance spectroscopy. Bull. Mater. Sci. 36 (1), 135–141. doi:10.1007/s12034-013-0420-0
Jing, J., Li, J., Feng, J., Li, W., and William, W. Y. (2013). Photodegradation of quinoline in water over magnetically separable Fe3O4/TiO2 composite photocatalysts. Chem. Eng. J. 219, 355–360. doi:10.1016/j.cej.2012.12.058
Joshi, J., Kanchan, D., Joshi, M., Jethva, H., and Parikh, K. (2017). Dielectric relaxation, complex impedance and modulus spectroscopic studies of mix phase rod like cobalt sulfide nanoparticles. Mater. Res. Bull. 93, 63–73. doi:10.1016/j.materresbull.2017.04.013
Kang, S., Jang, J., Pawar, R. C., Ahn, S-H., and Lee, C. S. (2018). Low temperature fabrication of Fe2O3 nanorod film coated with ultra-thin g-C3N4 for a direct z-scheme exerting photocatalytic activities. RSC Adv. 8, 33600–33613. doi:10.1039/c8ra04499f
Khan, I., Bilal, A., Shakeel, K., and Malik, F. T. (2022). Effects of nickel toxicity on various organs of the Swiss albino mice. Uttar Pradesh J. Zoology 43 (14), 1–12.
Khan, M. Z., Gul, I. H., Baig, M. M., and Khan, A. N. (2020). Comprehensive study on structural, electrical, magnetic and photocatalytic degradation properties of Al3+ ions substituted nickel ferrites nanoparticles. J. Alloys Compd. 848, 155795. doi:10.1016/j.jallcom.2020.155795
Khorsandi, K., Hosseinzadeh, R., Sadat Esfahani, H., Keyvani-Ghamsari, S., and Ur Rahman, S. (2021). Nanomaterials as drug delivery systems with antibacterial properties: Current trends and future priorities. Expert Rev. anti-infective Ther. 19, 1299–1323. doi:10.1080/14787210.2021.1908125
Krauskopf, T., Richter, F. H., Zeier, W. G., and Janek, (2020). Physicochemical concepts of the lithium metal anode in solid-state batteries. Chem. Rev. 120 (15), 7745–7794. doi:10.1021/acs.chemrev.0c00431
Lai, C., Ma, D., and Yi, H., 2023, Functional partition of Fe and Ti Co-doped G-C3n4 for photo-fenton degradation of OTC: Performance, mechanism, and dft study. Sep. Purif. Technol., 306, 122546. doi:10.1016/j.seppur.2022.122546
Li, X., Huang, X., Liu, D., Wang, X., Song, S., Zhou, L., et al. (2011). Synthesis of 3D hierarchical Fe3O4/graphene composites with high lithium storage capacity and for controlled drug delivery. J. Phys. Chem. C 115 (44), 21567–21573. doi:10.1021/jp204502n
Liu, W., Ye, T., Jāgermeyr, J., Müller, C., Liu, X., Shi, P., et al. (2021). Recent developments of doped g-C3N4 photocatalysts for the degradation of organic pollutants. Crit. Rev. Environ. Sci. Technol. 51 (8), 751–790. doi:10.1080/10643389.2020.1734433
Liu, Z., Yang, W., Wu, R., Hu, Q., Qiao, G., Liu, S., et al. (2020). A new quantitative analysis method for electromagnetic energy dissipation in microwave absorption materials. J. Magnetism Magnetic Mater. 516, 167332. doi:10.1016/j.jmmm.2020.167332
Mao, Y., Wu, M., Li, G., Dai, P., Yu, X., Bai, Z., et al. (2018). Photocatalytic degradation of methylene blue over boron-doped g-C3N4 together with nitrogen-vacancies under visible light irradiation. React. Kinet. Mech. Catal. 125 (2), 1179–1190. doi:10.1007/s11144-018-1414-0
Mazen, S., Nawara, A., and Abu-Elsaad, N. (2021). Investigation of dielectric behavior in Ni0. 7-xZn0. 3MxFe2O4 (M= Mn/Co/Cu) ferrites by impedance spectroscopy. Ceram. Int. 47 (7), 9856–9865. doi:10.1016/j.ceramint.2020.12.127
Najar, M. H., and Najar, I. A. (2019). An overview to photo-catalytic degradation of dyes in waste water. Appl. Chem. Eng. 2 (2). doi:10.24294/ace.v1i4.615
Nemiwal, M., Zhang, T. C., and Kumar, D. (2021). Recent progress in g-C3N4, TiO2 and ZnO based photocatalysts for dye degradation: Strategies to improve photocatalytic activity. Sci. total Environ. 767, 144896. doi:10.1016/j.scitotenv.2020.144896
Niu, P., Zhang, L., Liu, G., and Cheng, H. M. (2012). Graphene-like carbon nitride nanosheets for improved photocatalytic activities. Adv. Funct. Mater. 22 (22), 4763–4770. doi:10.1002/adfm.201200922
Oliveira, F., Dencheva, N., Lanceros-Méndez, S., Nunes, T., and Denchev, Z. (2019). Binary polyamide hybrid composites containing carbon allotropes and metal particles with radiofrequency shielding effect. Polym. Compos. 40 (S2), E1338–E1352. doi:10.1002/pc.24993
Pareek, S., Sharma, M., Lal, S., and Quamara, J. K. (2018). Polymeric graphitic carbon nitride–barium titanate nanocomposites with different content ratios: A comparative investigation on dielectric and optical properties. J. Mater. Sci. Mater. Electron. 29 (15), 13043–13051. doi:10.1007/s10854-018-9426-0
Patnaik, S., Sahoo, D. P., and Parida, K. (2020). Recent advances in anion doped g-C3N4 photocatalysts: A review. Carbon 172, 682–711. doi:10.1016/j.carbon.2020.10.073
Prakash, K., and Vasudevan, K. (2020). Design and development of compact circularly polarized multiband and ultra-wideband microstrip antennas for wireless applications. Kochi, Kerala: Cochin University of Science and Technology.
Rayssi, C., Kossi, S. E., Dhahri, J., and Khirouni, K. (2018). Frequency and temperature-dependence of dielectric permittivity and electric modulus studies of the solid solution Ca 0.85 Er 0.1 Ti 1− x Co 4x/3 O 3 (0≤ x≤ 0.1). Rsc Adv. 8 (31), 17139–17150. doi:10.1039/c8ra00794b
Şaşmaz Kuru, T. (2020). Room temperature structural, dielectric, and conductivity properties of AlxCd1-xFe2O4 ferrites. J. Aust. Ceram. Soc. 56 (2), 453–460. doi:10.1007/s41779-019-00349-z
Shindhal, T., Rakholiya, P., Varjani, S., Pandey, A., Ngo, H. H., Guo, W., et al. (2021). A critical review on advances in the practices and perspectives for the treatment of dye industry wastewater. Bioengineered 12 (1), 70–87. doi:10.1080/21655979.2020.1863034
Som, I., Roy, M., and Saha, R. (2020). Advances in nanomaterial-based water treatment approaches for photocatalytic degradation of water pollutants. ChemCatChem 12 (13), 3409–3433. doi:10.1002/cctc.201902081
Tang, Q., Meng, X., Wang, Z., Zhou, J., and Tang, H. (2018). One-step electrospinning synthesis of TiO2/g-C3N4 nanofibers with enhanced photocatalytic properties. Appl. Surf. Sci. 430, 253–262. doi:10.1016/j.apsusc.2017.07.288
Tiwari, B., Babu, T., and Choudhary, R. (2020). AC impedance and modulus spectroscopic studies of Pb (Zr0. 35-xCexTi0. 65) O3 (x= 0.00, 0.05, 0.10, 0.15) ferroelectric ceramics. Mater. Chem. Phys. 256, 123655. doi:10.1016/j.matchemphys.2020.123655
Ünal, B., Almessiere, M., Slimani, Y., Korkmaz, A. D., and Baykal, A. (2021). A study on the electrical and dielectric properties of SrGdxFe12− xO19 (x= 0.00–0.05) nanosized M-type hexagonal ferrites. J. Mater. Sci. Mater. Electron. 32, 18317–18329. doi:10.1007/s10854-021-06373-9
Usman, F., Dennis, J. O., Seong, K. C., Yousif Ahmed, A., Meriaudeau, F., Ayodele, O. B., et al. (2019). Synthesis and characterisation of a ternary composite of polyaniline, reduced graphene-oxide and chitosan with reduced optical band gap and stable aqueous dispersibility. Results Phys. 15, 102690. doi:10.1016/j.rinp.2019.102690
Vishnu, D., Dhandapani, B., Authilingam, S., and Sivakumar, S. V. (2022). A comprehensive review of effective adsorbents used for the removal of dyes from wastewater. Curr. Anal. Chem. 18 (3), 255–268. doi:10.2174/1573411016999200831111155
Wang, K., Yu, L., Yin, S., Li, H., and Li, H. (2009). Photocatalytic degradation of methylene blue on magnetically separable FePc/Fe3O4 nanocomposite under visible irradiation. Pure Appl. Chem. 81 (12), 2327–2335. doi:10.1351/pac-con-08-11-23
Wu, H., and Zhu, X. (2019). Microstructures, magnetic, and dielectric properties of Ba-doped BiFeO3 nanoparticles synthesized via molten salt route. J. Am. Ceram. Soc. 102 (8), 4698–4709. doi:10.1111/jace.16348
Xi, X., and Chung, D. (2021). Dielectric behavior of graphite, with assimilation of the AC permittivity, DC polarization and DC electret. Carbon 181, 246–259. doi:10.1016/j.carbon.2021.05.020
Xuan, S., Jiang, W., Gong, X., Hu, Y., and Chen, Z. (2009). Magnetically separable Fe3O4/TiO2 hollow spheres: Fabrication and photocatalytic activity. J. Phys. Chem. C 113 (2), 553–558. doi:10.1021/jp8073859
Yang, J., Li, J., Qiao, J., Lian, H., and Chen, H. (2014). Solid phase extraction of magnetic carbon doped Fe3O4 nanoparticles. J. Chromatogr. A 1325, 8–15. doi:10.1016/j.chroma.2013.11.052
Yang, X., Tian, Z., Chen, Y., Huang, H., and Hu, J. (2020). One-pot calcination preparation of graphene/g–C3N4–Co photocatalysts with enhanced visible light photocatalytic activity. Int. J. hydrogen energy 45 (23), 12889–12902. doi:10.1016/j.ijhydene.2020.03.028
Zhang, T-S., Hao, W-J., Wang, R., Wang, S-C., Tu, S-J., and Jiang, B. (2020). Electrocatalytic three-component annulation-halosulfonylation of 1, 6-enynes toward 1-indanones using sodium halides as both halogen sources and electrolytes. Green Chem. 22 (13), 4259–4269. doi:10.1039/d0gc00771d
Zhang, X., Li, M., Liu, C., Zhang, Z., Zhang, F., and Liu, Q. (2021). Enhanced the efficiency of photocatalytic degradation of methylene blue by construction of Z-scheme g-C3N4/BiVO4 heterojunction. Coatings 11 (9), 1027. doi:10.3390/coatings11091027
Zhou, D., and Qiu, C. (2019). Study on the effect of Co doping concentration on optical properties of g-C3N4. Chem. Phys. Lett. 728, 70–73. doi:10.1016/j.cplett.2019.04.060
Zhu, D., and Zhou, Q. (2021). Nitrogen doped g-C3N4 with the extremely narrow band gap for excellent photocatalytic activities under visible light. Appl. Catal. B Environ. 281, 119474. doi:10.1016/j.apcatb.2020.119474
Keywords: nanoparticles, carbon nitride, iron oxide, photodegradation, methylene blue dye
Citation: Ali A, Amin M, Tahir M, Ali SS, Hussain A, Ahmad I, Mahmood A, Farooq MU and Farid MA (2023) g-C3N4/Fe3O4 composites synthesized via solid-state reaction and photocatalytic activity evaluation of methyl blue degradation under visible light irradiation. Front. Mater. 10:1180646. doi: 10.3389/fmats.2023.1180646
Received: 06 March 2023; Accepted: 12 April 2023;
Published: 09 May 2023.
Edited by:
Faryal Idrees, University of the Punjab, PakistanCopyright © 2023 Ali, Amin, Tahir, Ali, Hussain, Ahmad, Mahmood, Farooq and Farid. This is an open-access article distributed under the terms of the Creative Commons Attribution License (CC BY). The use, distribution or reproduction in other forums is permitted, provided the original author(s) and the copyright owner(s) are credited and that the original publication in this journal is cited, in accordance with accepted academic practice. No use, distribution or reproduction is permitted which does not comply with these terms.
*Correspondence: Muhammad Amin, bXVoYW1tYWQuYW1pbkBwaHlzLnVvbC5lZHUucGs=; Muhammad Tahir, dGFoaXI5NEBnbWFpbC5jb20=