 Mao-Ken Hsu1
 Chi-Hua Yu
95% of researchers rate our articles as excellent or good
Learn more about the work of our research integrity team to safeguard the quality of each article we publish.
Find out more
ORIGINAL RESEARCH article
Front. Mater. , 05 May 2023
Sec. Mechanics of Materials
Volume 10 - 2023 | https://doi.org/10.3389/fmats.2023.1179710
In response to the global trend of carbon reduction over the last few years, various industries, including the aviation and automobile industries, have gradually begun research, design, and production of carbon fiber composite materials. These have excellent mechanical properties, such as being lightweight, high strength, and of high rigidity, which provide weight reduction and energy savings in applications across many fields. When used as a load-beam structure, the weave pattern determines the primary mechanical properties of the composite material. Therefore, the production of diverse products and components can be carried out using different patterns of weaving and manufacturing according to an application’s requirements. The mechanical properties of woven fiber composites can be obtained by using simulation analysis software, which can reduce unnecessary waste during design and manufacturing. However, difficulties arise in the simulation analysis due to the complexity of the weaving method. With the continuous improvement of computer technology in recent years and the enormous amount of training data available, many research teams have begun to implement artificial intelligence (AI) technology, which has been widely used to overcome long-standing obstacles in many different fields. For example, the problems involved in the prediction of protein folding sequences and the prediction of the physics of structural materials have all been resolved by AI. We implement a convolutional neural network (CNN), a deep learning method, to establish a model that utilizes a representative volume element for the prediction of the mechanical properties of a woven fiber composite material. The predictive model significantly streamlines the computational complexity involved in analyzing woven composite materials, resulting in a substantial reduction in processing time compared to conventional methods. Unlike traditional finite element simulations, which necessitate intricate boundary conditions and interactions on a case-by-case basis, our research simplifies these complex procedures and accommodates a wide range of scenarios. This research offers substantial advantages for industrial manufacturing, particularly in the design and mass production of woven fiber composite materials.
Composite materials that possess multiple excellent mechanical properties, such as high-strength and lightweight, have been implemented in numerous fields, for example, in aerospace engineering, civil engineering, the military, motorsports, and other competitive sports products, etc., (Booysen, 2002; Tsai and Hahn, 2018). They can provide the advantages of multiple materials while overcoming the drawbacks of a single material. This has expanded their field of application, allowing them to play an important role in many domains and replace many conventional materials.
There are many kinds of composite materials, including fiber-reinforced composites, sandwich-structured composites, hybrid composites, etc., (Sheehan et al., 1994). Fiber-reinforced composites have led to the development and application of many new products due to their excellent material properties. They are composed of a matrix and fiber reinforcements. There are two matrix categories: thermoplastic and thermoset. The fabric dominates the mechanical properties of the composite material and common fabrics include glass fiber, carbon fiber, Kevlar, etc. (Savage, 1993; Dresselhaus and Avouris, 2007; Zhang et al., 2012; Edwards et al., 2013), but there are also other forms such as staple fibers, filament fibers, and yarn fiber. Different processing methods use different arrangements and weaving methods. Different characteristics of a composite material also result in different mechanical properties. However, due to the large amount of design and mass production required in the industry, the complexity of the composition of the fabric reinforcements and the matrix requires a huge consumption of time and computational resources.
Conventional material development is a slow and arduous process, especially for composite materials. To search for ideal material characteristics, researchers typically must test thousands of combinations of materials, which is too costly for most industries. Furthermore, many problems must be considered during their design and production. For example, the composition ratio between the matrix and the reinforcements has to overcome the drawbacks of using a single material and the enormous consumption of time and computational resources required for industrial application during the design and production stages also have to be considered. The development of woven fiber composites is an example of the intractable problems of this process. The outer layer of this complex model is a “wrapped-around” resin matrix and the fabric reinforcements are woven together in the interior. The composite material is formed from the combination of these two materials.
There are different weaving methods for the fabrics (Nosrat Nezami et al., 2016), such as the plain weave, twill weave, harness satin weave, etc. Different weaving methods give different mechanical performance distributions. If the analysis of the mechanical properties of woven fiber composite materials could be carried out in advance through finite element analysis, repetitive designs and production waste could be avoided. However, dealing with the complex geometric models and contact boundary conditions of FEM is very computationally expensive and time-consuming.
With the continuous improvement in computer technologies, the increase in computing power, and the vast training data available, AI technology has gradually come to be adopted by different research teams in many different fields, solving problems that were previously too hard to solve (Hamet and Tremblay, 2017; Salehi and Burgueño, 2018; Yu and Buehler, 2020; Zhao et al., 2021). By processing the features of an image, AI can solve image recognition problems. For example, with the continuous convolution of kernels, the Convolutional Neural Network (CNN) can collect an image’s features (O’Shea and Nash, 2015; Albawi et al., 2018; Yu and Buehler, 2020). It has produced notable results in object detection and classification problems. AI can also solve time series sequential data. The rise of AI has shed new light on many difficult problems that were previously unsolvable (Hamet and Tremblay, 2017; Salehi and Burgueño, 2018; Bullock et al., 2020). Researchers can now make breakthroughs on long-standing difficulties in many different fields by using AI. For example, the folding sequence of proteins (Yu et al., 2022a), the prediction of graphene crack propagation (Yu et al., 2022b), and the design of multifunctional structural materials (Yang et al., 2021) are problems that have been solved by using AI.
With the utilization of deep learning for the feature extraction of two-dimensional structures, the mechanical properties of woven fiber composite materials can be predicted (Foss et al., 2014). Information regarding woven fiber composite materials is obtained through finite element analysis, covering details such as fiber angles, resin material parameters, and the effective modulus of the woven fiber composite material. This kind of data is ideally suited for deep learning models that utilize regression analysis. However, the mechanical properties of woven fibers depend on both material properties and geometry, which cannot be addressed by solely employing a CNN model.
Here we developed a hybrid network which combined CNN model and a multilayered perceptron to learn the mechanical behavior for the given training dataset. The long-standing difficulties of using finite element analysis on the computation of woven fiber composites can be solved using this model and the complicated setup required for the mass design and production of woven fiber composites can also be simplified. The model can analyze and predict the mechanical properties of different woven fiber composite materials. In addition, we implement this model in the resin transfer molding module of the mold flow software Moldex3D (Tseng et al., 2017; Tseng, 2018; Shi et al., 2019). Figure 1 demonstrates its benefits to simulation and analysis and also to the mass design and production of the industrial woven fiber composite material process.
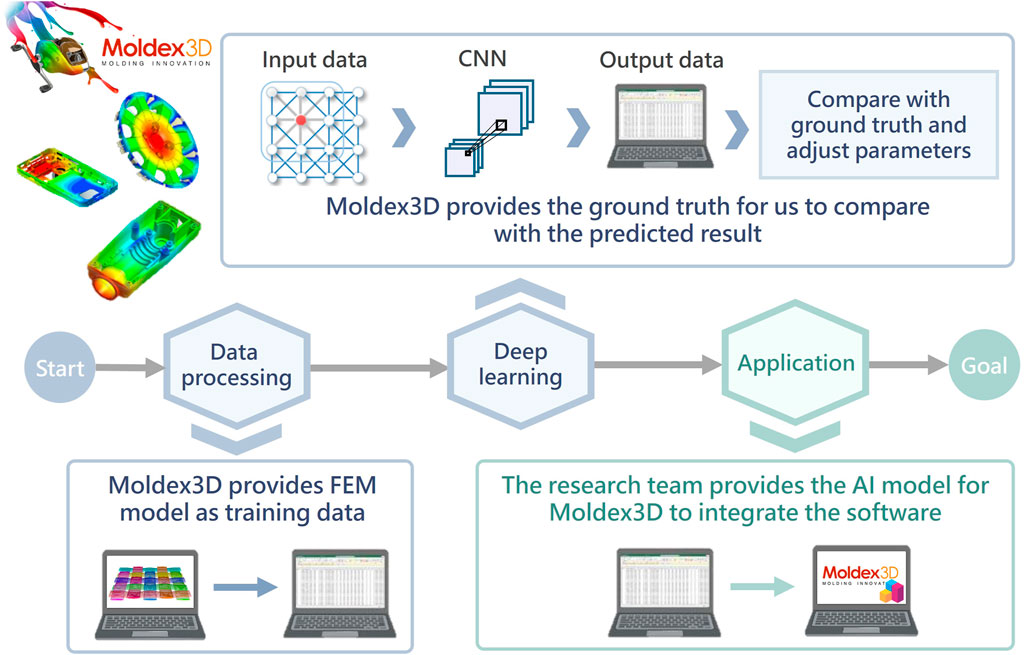
FIGURE 1. Flowchart of the collaboration process between our team and Moldex3D. Moldex3D provided data related to the woven fiber composite. For instance, the parameters of the fiber and the resin material, the diameter of the fabric, the mechanical properties, etc. We further utilized this model to establish the deep learning CNN and adjusted the prediction model’s parameter by comparing the simulation results with ground truth. Finally, the trained neural network model was integrated with Moldex3D to optimize the computational speed and resources of the original simulation module.
This research implemented finite element analysis, AI algorithms, and Representative Volume Element (RVE) to predict the mechanical properties of a woven fiber composite material, and the flowchart our proposed method is shown in Figure 2. We established the carbon fiber woven composite model through Moldex3D by adjusting the geometric parameters, such as the arrangement of the fiber and the woven angle between the fibers, and also the material parameters of the fabric and resin. Next, we simulated this model using the finite element analysis software ABAQUS. From the results of the analysis, we obtained the effective modulus of its mechanical properties, namely, of its Young’s modulus, shear modulus, Poisson’s ratio, and coefficient of thermal expansion. The effective modulus represents the material characteristics of the corresponding carbon fiber composite. The weaving method of the fabric, the material parameters of the fabric and resin, and the weaving angle, etc., Were taken as inputs, whereas the effective modulus obtained through simulation was taken as ground truth. We have built a dual-input CNN model, for the first input channel architecture, by first inputting the image information of the woven fiber composites, followed by 4 convolutional layers, 1 pooling layer and 4 fully connected layers. For the second input channel, the information of material parameters is input first, followed by 4 fully connected layers. These two inputs are combined in the middle of the overall CNN model, followed by 3 convolutional layers, 5 fully connected layers, and finally the output prediction result. The dual input channel ensures that we can learn the relation between the woven methods of the woven fiber composite, which are represented as 5*5 grids, and the material parameters. With these datasets provided for the training of the deep learning algorithm and CNN as the predictive model, we aimed to reach the goal of directly predicting the effective modulus of a carbon fiber composite.
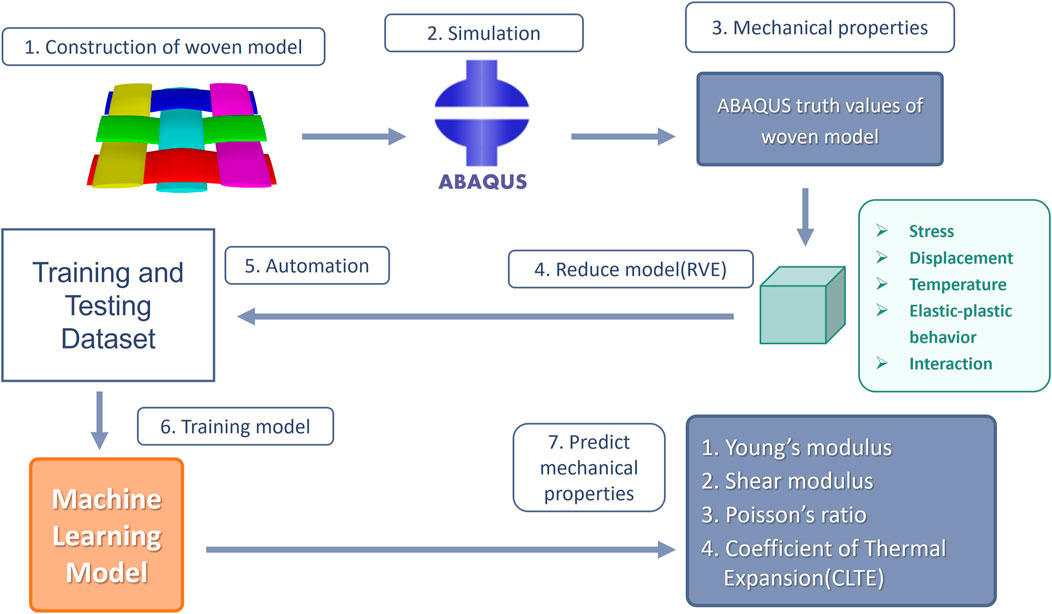
FIGURE 2. Flowchart of the procedure. First, we created the woven fiber composite model and analyzed it using finite element simulation to obtain the effective modulus of its mechanical properties for the simplification process. Next, we arranged the data of the woven fiber composite material into training datasets with features and labels. Finally, the deep learning model for the prediction of the effective modulus of the woven composite material was established.
The first step of the finite element simulation was to establish the geometric model of the woven fiber composite, which we created using the specialized open source software TexGen (Lin et al., 2011; Long and Brown, 2011). The woven fiber composite model was composed entirely of unit cells, with five horizontal fibers and five vertical fibers. When we created the model of the woven fiber composite, the geometric parameters were assigned randomly, including the material of the fibers and resin, the weaving method between the fibers, the cross-section of the fiber, the spacing between the fibers, and the angle between the fibers, to ensure randomness and diversity. Specifically, the yarn fiber and resin material can be chosen from the materials shown in Table.1 and Table.2 respectively; the weaving method of the model can be randomly generated on a grid to represent the weaving conditions; the width of the section of fibers can be randomly generated in the range between 0.2 mm and 1 mm; the height of the section of fibers can be randomly generated in the range between 0.1 mm and 0.4 mm, and the angle between fibers can be randomly chosen from 5 different angles, 90, 75, 60, 45, and 30. The weaving method of the fiber is represented as a 5*5 grid, where the black represents the horizontal fiber that weaves above, and the white represents the horizontal fiber that weaves below. A simplified representation of the weaving method is shown in Figure 3B. The parameters of the fibers and the resin materials were then fed into TexGen. We also took the weaving method, the angle between the fibers (as shown in Figure 3C), and the parameters of fibers and resins of the woven fiber composite as features of the data. Finally, the whole woven fiber composite was exported in a format compatible with ABAQUS in order to perform finite element simulation of the mechanical properties of the woven fiber composite.
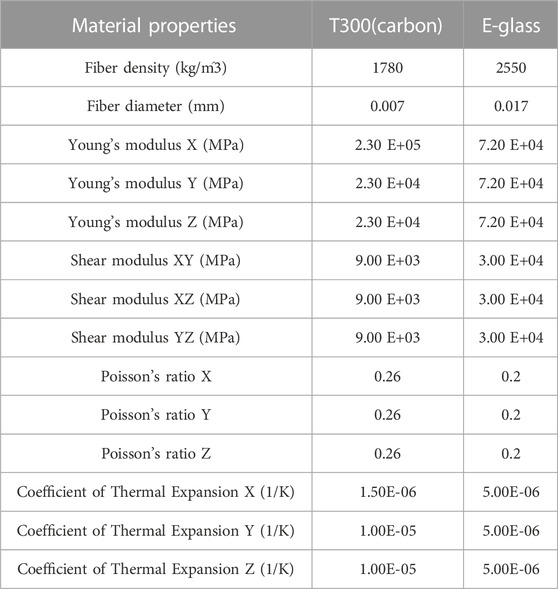
TABLE 1. Fiber material parameters.
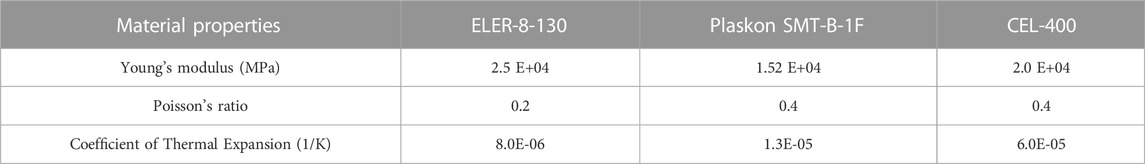
TABLE 2. Resin material parameters.
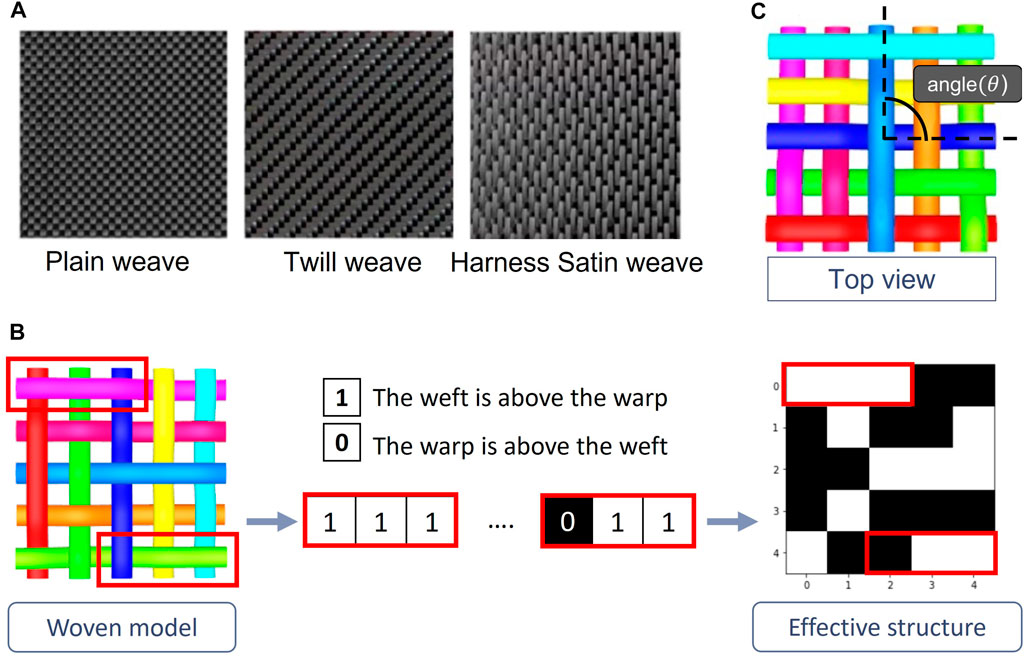
FIGURE 3. (A) Different types of weaving methods: plain weave, twill weave, and satin weave. (B) Simplification process. The black (0) represents the horizontal fiber that weaves above and the white (1) represents the horizontal fiber that weaves below. (C) Representation of the angle between the fibers of the woven fiber composite from the top view.
The mechanical properties of the woven fiber composite were obtained through finite element simulation. Then finite element simulations were performed using the geometric model of the woven fiber composite that was established using ABAQUS (Giner et al., 2009). The force was considered as concentrated on a fixed point for the boundary condition. The concentrated force was exerted on different axes at different time steps in order to analyze the effective modulus of the different axes. The magnitude of the concentrated force varied depending on the size of the model and Eq(Li and Wongsto, 2004). was used to determine the corresponding deformation and strain. When a force
The strain energy stored in the unit cell can be expressed by the macro stress and strain:
By equalizing the equation of work
With the relationship between the concentrated force and the macro scale stress obtained, we were able to obtain the effective modulus of the unit cell on the axis of interest. The equation of the effective modulus is:
The simulation setup for the woven composite material consists of the following steps. The resin envelops the fibers to form the entire model, and a master node is established at the resin material’s corner as a reference point. Constraint nodes are positioned based on the fibers' locations, which means each model’s constraint node will be set at different positions according to the specific model. We apply a fixed boundary condition to the master node and assign varying concentrated forces to the constraint node based on each model’s volume. The concentrated forces’ value is calculated as the product of the model’s width, height, and thickness. A schematic diagram depicting the simulated loading of the relevant effective modulus equation can be found in the Supplementary Material, specifically in Supplementary Figure S1. With the equation of the effective modulus above, we were able to apply different concentrated forces according to the different volumes of the woven fiber composites when configuring the simulation settings of the boundary conditions. After the strain magnitude of the composite on the desired axis was obtained from the analysis, the effective modulus was acquired by taking the reciprocal of the value.
The mechanical properties of the woven fiber composite obtained from the simulation analysis were also labelled, including the Young’s modulus, shear modulus, Poisson’s ratio, and the coefficient of heat conduction. In Figure 4 and Figure 5, we calculated the effective modulus equation to obtain the values. The figures reveal that the 3,000 data points tend to be randomly distributed, with the distribution being influenced by several factors. One such factor is the geometric parameters set during the creation of the woven fiber composite, with the angle between the fibers having a significant impact. Another influence is the material parameters in the simulation setup. We have three resin materials and two fiber materials, and each combination also affects the results of the woven fiber composite. We assign random geometric parameters and various material parameter combinations for the woven fiber composite within a reasonable range. While these are case-by-case and time-consuming for finite element simulations, our research simplifies these problems and delivers rapid results. Figure 4 and Figure 5 also shows the distributions of the mechanical properties and it can be seen that the labelled data of the neural network training dataset is scattered evenly. This means that our training dataset possessed randomness and interpretability, providing great benefit for the learning of the neurons of the neural network.
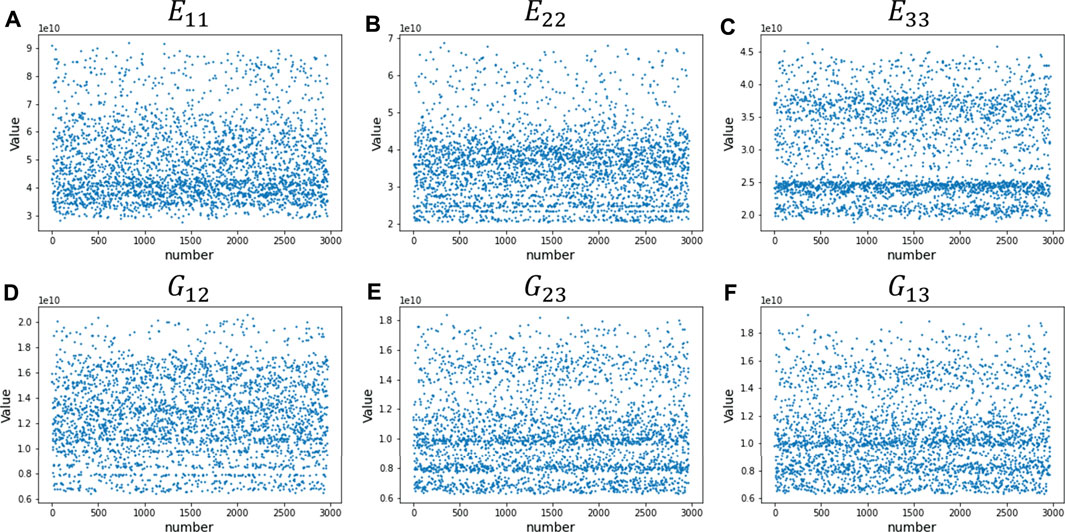
FIGURE 4. Distribution of the effective modulus for the woven fiber composite obtained from the simulation analysis. (A)Young’s modulus along the x-axis. (B)Young’s modulus along the y-axis. (C)Young’s modulus along the z-axis. (D) Shear modulus on the xy-plane. (E) Shear modulus on the yz-plane. (F) Shear modulus on the xz-plane.
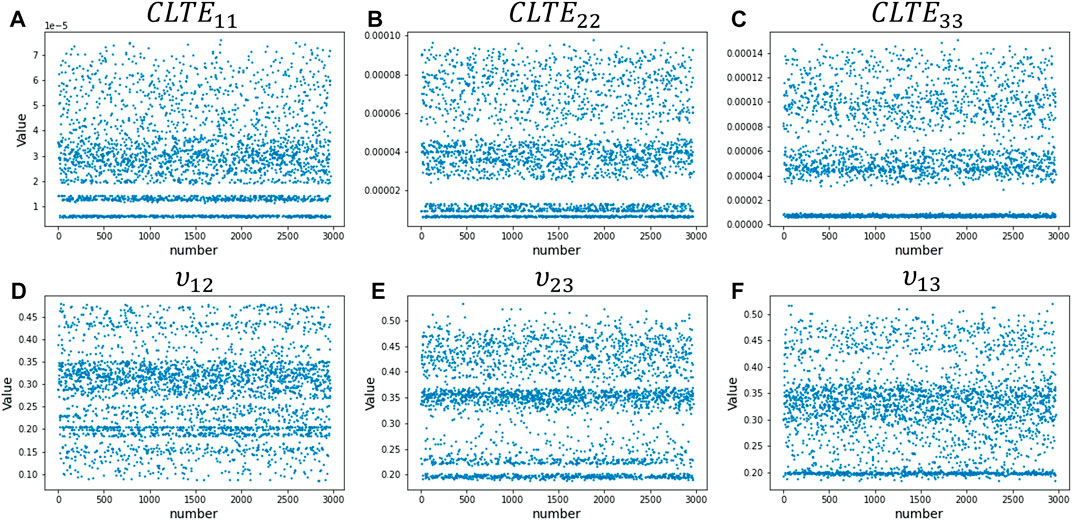
FIGURE 5. Distribution of the effective modulus for the woven fiber composite obtained from the simulation analysis. (A) Coefficient of heat conduction along the x-axis. (B) Coefficient of heat conduction along the y-axis. (C) Coefficient of heat conduction along the z-axis. (D) Poisson’s ratio on the xy-plane. (E) Poisson’s ratio on the yz-plane. (F) Poisson’s ratio on the yz-plane.
A convolution neural network (CNN) was chosen as the predictive model out of all the available deep learning models based on the features of the training dataset. CNN consists of one or many convolution layers, pooling layers, and fully connected layers. This structure enables it to extract features from the two-dimensional structure of the input data(Fred Agarap, 2017). CNN is capable of obtaining better prediction results than other deep learning structures in the field of image and speed recognition (Yamashita et al., 2018) and it performs well at finding the complex relationships between woven fibers. However, for models using the same weaving method, combinations of different fiber and resin materials may be produced. To prevent this, we adopted the dual input CNN model. The weaving method of the fiber, represented using a checkerboard, is the first input as an image together with the geometric parameters, the parameters of the fiber and resin, etc., is the second input. We provide detailed input and output information for our deep learning models in Supplementary Table S1 of the Supplementary Material. With our task being data regression analysis, we choose the classical Mean Square Error (MSE) as the loss function to train the model. The CNN created using this bi-directional structure is shown in Figure 6.
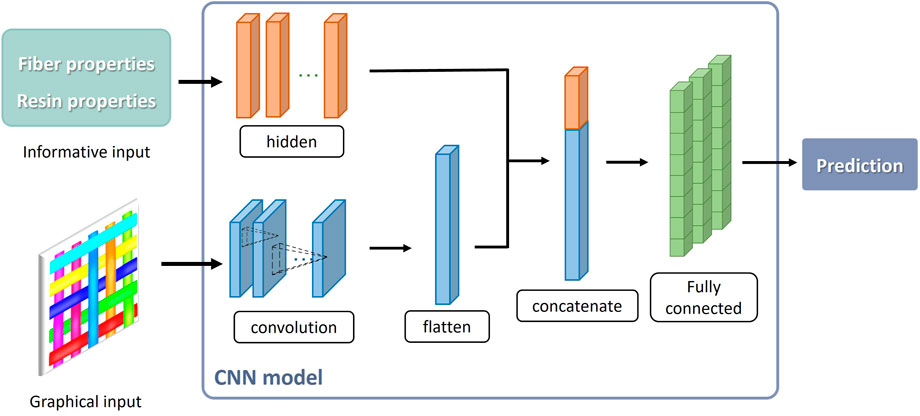
FIGURE 6. Dual input CNN structure. The input of the fiber and resin material parameters and the geometric parameters, together with the top view of the weaving method treated as an input image. The equivalent moduli were predicted through the hidden layer, convolution layer, flatten layer, and the combination of the data through the fully connected layer.
We obtained the mechanical properties of the woven fiber composite through simulation, including the stress, strain, displacement, temperature, etc. Furthermore, the effective modulus was computed through the aforementioned formula, which uses the Young’s modulus, shear modulus, Poisson’s ratio, and the coefficient of heat expansion. The effective modulus of the woven fiber composite was treated as the material parameters of models of the same size. Through simplifying the complex conditions of the model, such as the boundary conditions, mechanical conditions, interaction on contact, etc., together with the utilization of a cube to represent the RVE model of the woven fiber composite, analysis results of the same high level of accuracy could be obtained with much less time required. On this basis, we implemented AI technology to learn the process of determining the mechanical properties of the woven composite material through training deep learning, aiming to directly predict the equivalent moduli. The predicted equivalent moduli were then used as the material parameters of the representative element in combination with RVE. The goal was to obtain results of the same high level of accuracy in much reduced time, hence we named this method “Smart RVE”.
Woven fiber composites are composed using fiber as reinforcement and resin as the matrix, and the mechanical properties are mainly determined by the fiber. A material database was provided by Moldex3D. The RTM module of its mold flow software contains a rich database of fibers and resins, with modelling parameters available for research purposes. When creating the model of the woven fiber composite, two types of fiber materials and three types of resin materials were chosen. The diameter, Young’s modulus, shear modulus, and Poisson’s ratio values are listed in Table.1 and Table.2. The chosen materials were all anisotropic materials. Woven fiber composite material is composed of the resin material as the outer layer and the fiber material as the inner layer. The combination of all materials could generate a total number of 500 woven fiber composite models with random geometric parameters. The dataset with a total of 3,000 woven fiber composites with randomness and interpretability was generated and used as the training dataset for the deep learning model.
The geometric modelling of the woven fiber composite, conditions for the finite element simulation, distribution of the analysis results, methodology of specifying the material parameters of the fiber and resin, creation of the deep learning model, and the application of the Smart RVE predictive model were introduced in the previous sections. The effect of the variation of the geometric parameters of the woven fiber composite and the astonishing predictive performance of the dual input CNN deep learning model are exhibited in the following sections. The differences between the implementation of our Smart RVE method and conventional finite element simulation for several types of woven fiber composites are also presented.
The dataset utilized for training the deep learning network was generated by introducing a wide range of parameter variations to the simulation model of the woven fiber. These variations included: 1) the yarn fiber material, 2) the resin material, 3) the weaving conditions, and 4) the weaving angle between the fibers. Among these parameters, we focused on examining the effects of the angle between fibers, as its influence on the overall properties is less intuitive. The Young’s modulus is taken into account when comparing the impact of different weaving angles on the woven fiber composite, as depicted in Figure 7A. It is evident that the variation in weaving angle significantly affects the Young’s modulus of the model. Due to its special crystal structure of carbon fibers, it has a higher strength in the direction of the fiber, making it a brittle material that is capable of enduring a relatively high axial load. With the decrease of the angle between the fibers, the fiber that was originally oriented along the y-axis is increasingly rotated towards the x-axis (see Figure 7B), resulting in the increase of the Young’s modulus in the x-direction increases, and the increases axial load it can endure along the x-axis increases. Therefore, the Young’s modulus on the x-axis increases with the decrease in the weaving angle between the fibers. On the contrary, when the weaving angle between the fibers decreases, the carbon fiber, which has a low radial load capacity, becomes more brittle. Thus, the load bearing capacity along the y-axis decreases. Due to the relatively low thickness of our woven fiber composite model, the adjustment of the weaving angle is performed only on the xy-plane, thus, the Young’s modulus on the z-axis is not greatly affected. To validate our data generation approach, we have presented the distributions of the resulting effective modulus in Figures 4, 5. Figure 4 displays the distribution of Young’s modulus and shear modulus, while Figure 5 illustrates the distribution of the coefficient of heat conduction and Poisson’s ratio. As depicted in these distributions, our data generation method effectively produces a dataset with evenly distributed properties, which in turn provides the deep learning model with diverse information concerning the relationship between parameter variations and the associated mechanical properties.
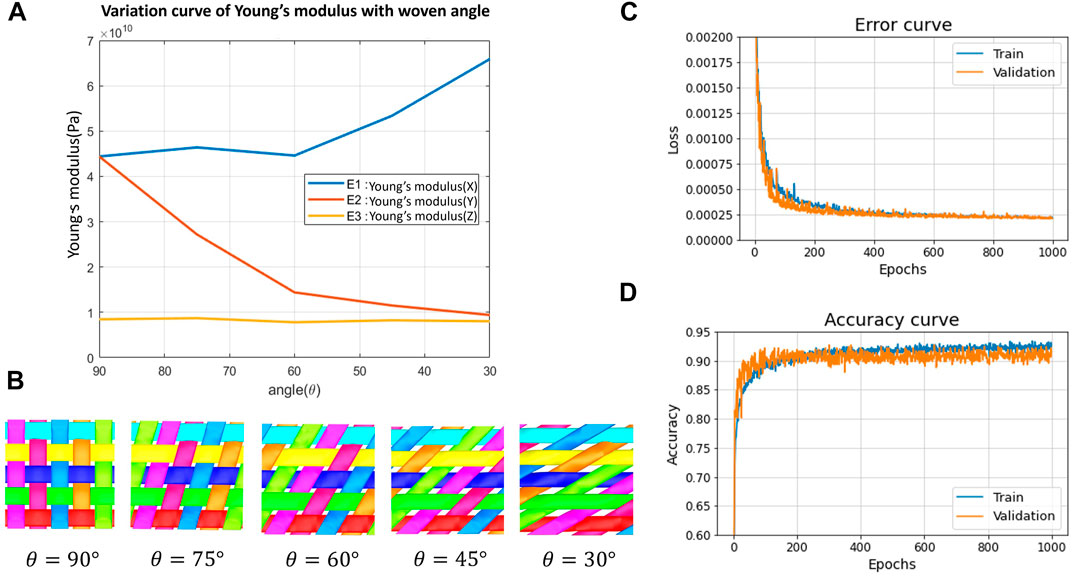
FIGURE 7. (A) Comparison of the effect of the weaving angle on the Young’s modulus of the woven fiber composite. (B) Top view of the woven fiber composite with various weaving angles. (C) Continuous iteration of the loss functions during the training process. (D) Continuous iteration of the accuracy functions during the training process.
A single woven fiber composite model alone requires an enormous amount of computational time and resources, which is a serious issue for businesses specializing in the design and production of woven fabric composites. If the advantages and disadvantages of a proposed woven fiber composite could be analyzed and designed at the simulation stage, this would have a significant impact on their design and manufacture. Therefore, our team developed a predictive model that is capable of dealing with various simulated conditions for woven fiber composites. Even using data that is unseen during the training of the deep learning model, the effective modulus of a woven composite can still be accurately predicted. This accelerates the speed of the simulation of woven fiber composites while reducing the enormous amount of computational resources that would otherwise be required.
The mechanical properties of the woven fiber composite obtained from the finite element analysis are represented by the effective modulus and our deep learning model exhibited superior predictive capability in predicting the corresponding effective modulus using model properties. The training process of the loss function of the neural network is shown in Figure 7C. We adopted the mean-square error as the loss function in order to evaluate the accuracy and performance of the neural network. The loss of the training data, represented by the blue line, dropped from 0.1015 to 0.0018 within the first 10 iterations. When validating the data, represented by the orange line, the same tendency was exhibited and the loss dropped from 0.0228 to 0.0014 within the first 10 iterations. When the number of iterations for the training of the neural network reached 1,000, the loss of the training dataset converged to a magnitude of
The comparison between the predicted values obtained using the deep learning model and the ground truth simulated by ABAQUS demonstrates that this predictive model possesses a strong ability to predict the effective modulus of woven fiber composites. The prediction results shown in Figure 8 include Young’s modulus and shear modulus, and the prediction results shown in Figure 9 include the coefficient of heat expansion and Poisson’s ratio. The x-axis of the distribution graph represents the ground truth of the effective modulus obtained from finite element analysis. The y-axis represents the value predicted by the CNN deep learning model. It can be observed most of the points are approximately positioned along the diagonal
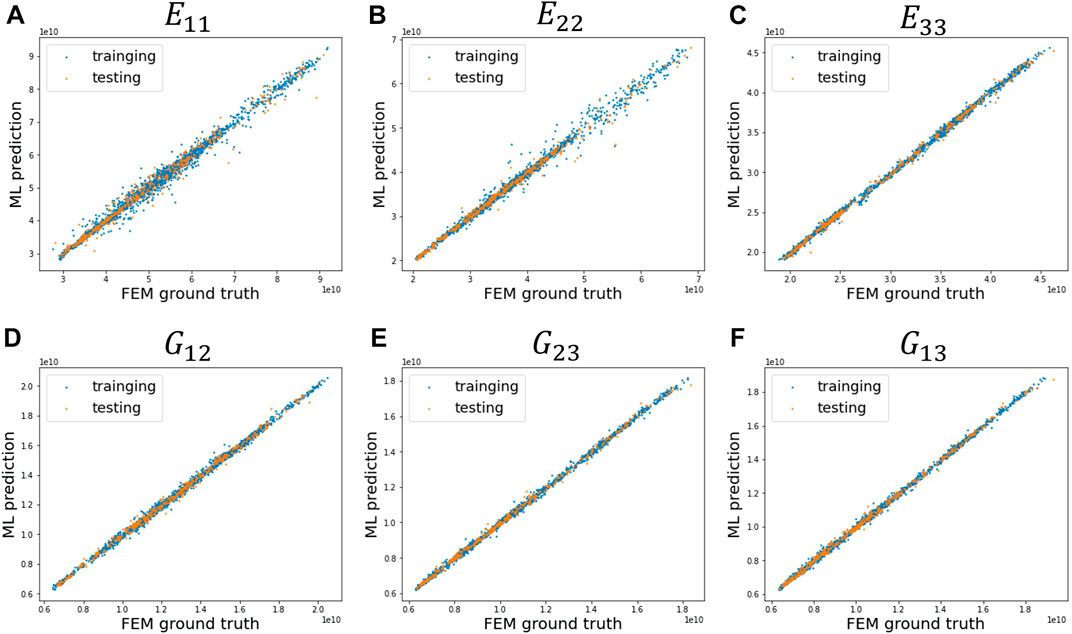
FIGURE 8. Distribution graphs of the values predicted by the CNN neural network and the ground truth obtained from the FEM simulation. (A) Young’s modulus along the x-axis. (B) Young’s modulus along the y-axis. (C) Young’s modulus along the z-axis. (D) Shear modulus on the xy-plane. (E) Shear modulus on the yz-plane. (F) Shear modulus on the xz-plane.
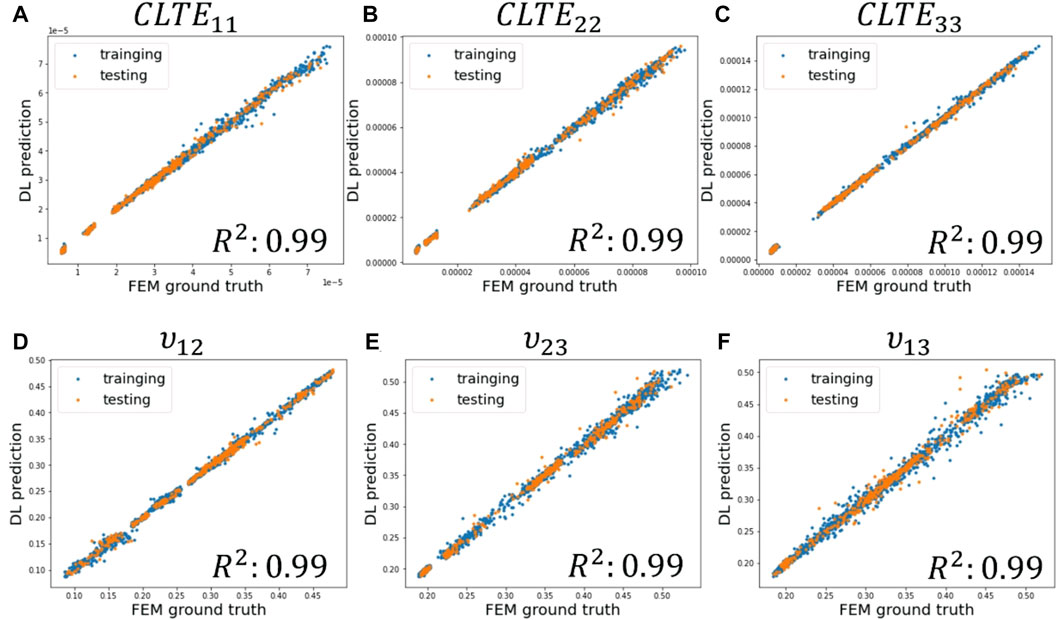
FIGURE 9. Distribution graphs of the values predicted by the CNN neural network and the ground truth obtained from the FEM simulation. (A) Coefficient of heat expansion along the x-axis. (B) Coefficient of heat expansion along the y-axis. (C) Coefficient of heat expansion along the z-axis. (D) Poisson’s ratio on the xy-plane. (E) Poisson’s ratio on the yz-plane. (F) Poisson’s ratio on the xz-plane.
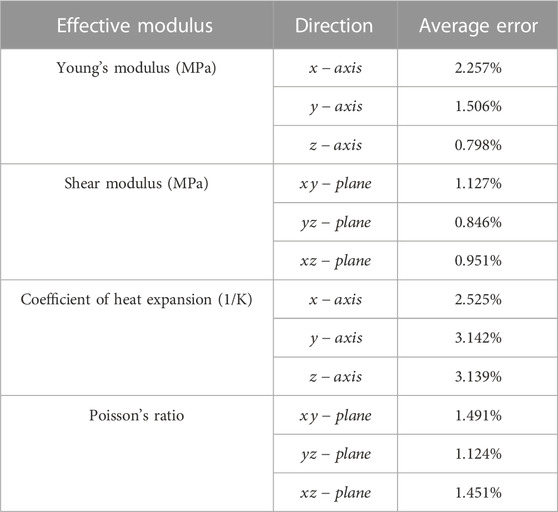
TABLE 3. The average error of effective modulus in each direction.
The dual input CNN demonstrated excellent performance in the prediction of the effective modulus of the woven fiber composite and this could help us further reduce the model. We thus created a geometric model that was of the same size as the original woven fiber composite model and input the homogeneous material parameters obtained from the prediction of the neural network, producing the reduced model. Compared to the original complex woven fiber composite model composed of fiber and resin materials, the computation time and resources could be reduced for the simulation analysis while obtaining similar mechanical behavior. We simulated two kinds of mechanical experiments for the woven fiber composite and the fiber material, respectively the shear test and the ball impact test. The material parameters of T300 (Table 1) were chosen for the reinforcements and of ELER-8-130 (Table 2) for the matrix of the woven fiber composite. The staggered-weaving plain weave method was adopted with a 90-degree weaving-angle, ensuring uniform loading on both axes. The finite element model of the woven fiber composite was created according to the material and geometric parameters described above in order to further develop the finite element analysis simulation.
The first simulation demonstrated the stress concentration after the model was subjected to a shear force. A stress concentration will lead to the model being damaged more easily but finite element simulation of the woven fiber composite allows us to better understand the load capacity of the composite material and avoid this. It also enables us to further optimize the material. We compared the results of the simplified model obtained from the prediction of the Smart RVE and the simulation of the woven fiber composite obtained using the conventional finite element method. The simulation conditions for both modelling methods were as follows. The geometric parameter of an inverse L-shape cube was used, consisting of five unit cells 0.422 mm in height and 7.77 mm in length and width. The boundary condition was specified such that the corner of the model was fixed, with the lower plane and left plane set as rolling contacts. The top of the model was subjected to a 10,000 N shear force. To comprehensively analyze the complex model of the woven fiber composite, the mesh size of the conventional finite element simulation was set to 625,000 elements, in contrast to the 150,544 elements of the homogenous RVE model. The stress concentration on the corner of both models when subjected to the stress distribution generated under the application of the shear force on the fiber can be observed in the results of the analysis. As can be seen in Figure 10B, deformation to the right side was produced when the model was subjected to the shear force, and a local stress concentration was created on the corner of the model with the bending location on the right. The fibers of the composite were stagger-weaved inside the resin material. Therefore, distinct local stresses would be expected to occur at the woven section of the model. Nevertheless, the stress concentration at the corner and the bending on the right resulted in an extremely similar distribution to the RVE model. Considering the cross-sectional view at the half position of the z-plane for both models, it can be observed that the stress distribution is not only impacted at the corner and the bending on the right, but also by the orientation of the fibers because of the method of weaving. Nevertheless, careful observation reveals that the stress distribution generated on the fibers remains identical to the stress distribution of the RVE model. Both show concentrations at the corner and on the right-bending position of the model. The simple and homogenous RVE model represents the stress distribution in an evenly distributed manner. It can be seen from this analysis that the stress distribution determined by the RVE model is extremely similar to the results obtained using the complex woven fiber composite, while requiring substantially reduced computing time. The simulation time of the original complex woven fiber composite was 90 min, whereas the RVE model only required a mere 60 s for it to produce similar results, as shown in Figure 10.
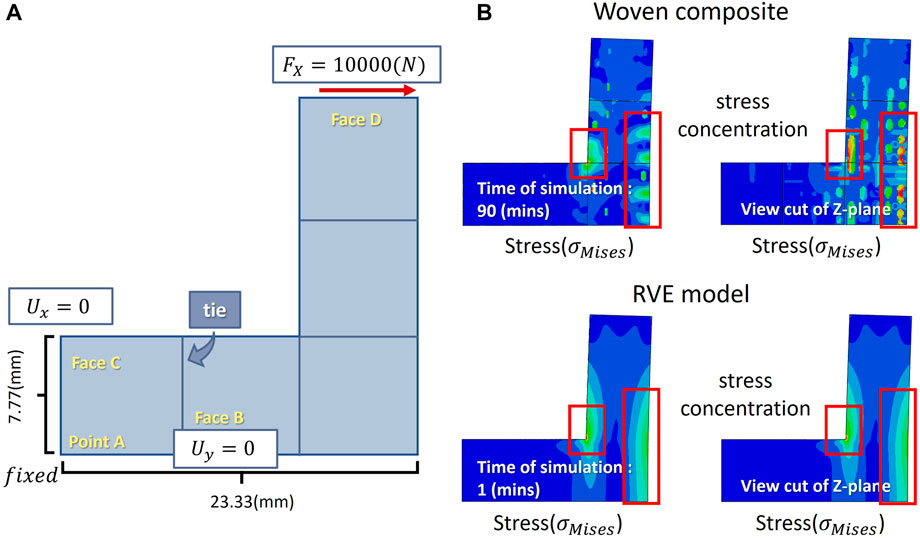
FIGURE 10. (A) Simulation conditions for the examination of local stress concentrations produced under shear stress. The woven composite material was assembled using five unit cells. The boundary conditions for the simulation were: Point A set as fixed; Face B set with no displacement on the y-axis; Face C set with no displacement on the x-axis; Face D was subjected to a 10,000 N shear force. (B) Woven composite model assembled from five unit cells and the simplified model obtained using RVE.
The second simulation revealed the distribution of stress and displacement generated in the woven composite material under the ball impact test. The light weight and high strength of woven composite materials make them applicable in all sorts of industries, including those that involve frequent impact by external forces. For example, to reduce the weight of an aircraft while ensuring that it remains capable of continuing flight when subjected to external impact, an aircraft manufacturer could use woven composites that comply with the requirements as the material for the fuselage. Therefore, this scenario was chosen as the condition of our finite element simulation. We also compared the results obtained from the simplified model predicted and built by Smart RVE with the simulation results of the woven fiber composite obtained using conventional finite element methods. The conditions for the simulation for both methods were as follows. The model was a cuboid of 0.422 mm height and 23.33 mm length and width. The four sides of the model were fixed and the ball was set as a rigid body in order to observe the deformation of the woven composite material after an impact. The ball was given 2.54 mm of displacement. To comprehensively analyze the complex model of the woven fiber composite, the mesh size of the conventional finite element simulation was set at 625,000 elements, in contrast to the 150,544 elements of the homogenous RVE model. When the woven composite material was subjected to the impact of a ball falling from above, a hole was produced in the center of the model, which bore the weight of the ball. The deformation on the surface of the model caused by the impact of the ball and the stress distribution produced after the impact on both models can be observed in the cross-sections of the analysis. The deformation of the model produced by the impact of the ball can be seen in Figure 11B, as well as the stress distribution of the fiber under magnification at the point of impact. It can be that the deformation is similar in both models subject to the same force of impact, although the woven fiber composite material shows a local stress dispersion phenomenon due to the fiber weaving. Nevertheless, it can still be seen that the trends of the stress distribution under the ball impact test are identical. Both the RVE model and the more complex woven composite material both exhibited very similar simulation results for the distribution of stress and displacement after deformation. However, the simulation time to complete the entire analysis for the RVE model required only 1/600 of the time required to simulate the woven composite material. This significant reduction of computing time and computational resources required for finite element simulation is shown in Figure 11.
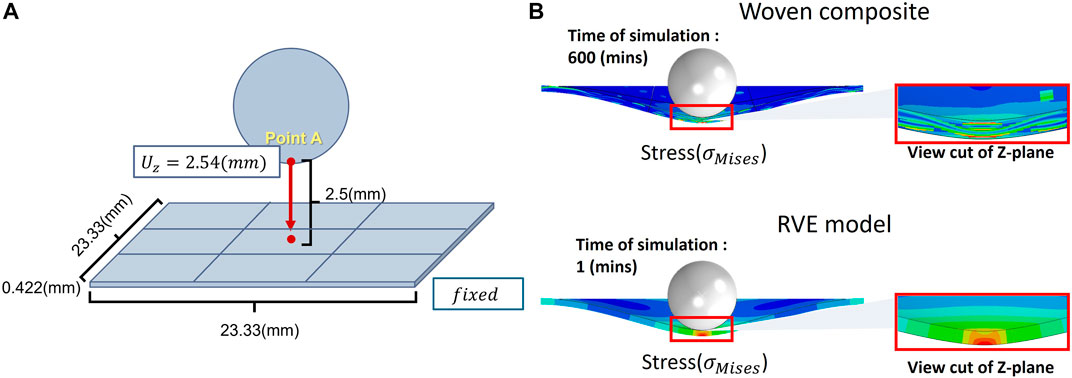
FIGURE 11. (A) Simulation conditions for the simulation of stress and displacement distributions generated by the impact of a dropping ball. (B) Woven composite model assembled from nine unit cells.
The method of simplifying the model by predicting the equivalent moduli using the neural network is termed “Smart RVE”. By implementing this method on the RVE model and the woven composite materials, significant improvements were obtained. By replacing the complex woven composite material in the original simulation with an RVE model of homogeneous material that had similar characteristics, very similar mechanical characteristics were exhibited under the identical simulation conditions. However, the computing time required for the finite element analysis was significantly reduced. The results are shown in Figure 12. The simplification of the model enables us to better predict models and improve integration with different software modules while significantly reducing the computing time required compared to the original method of finite element analysis.
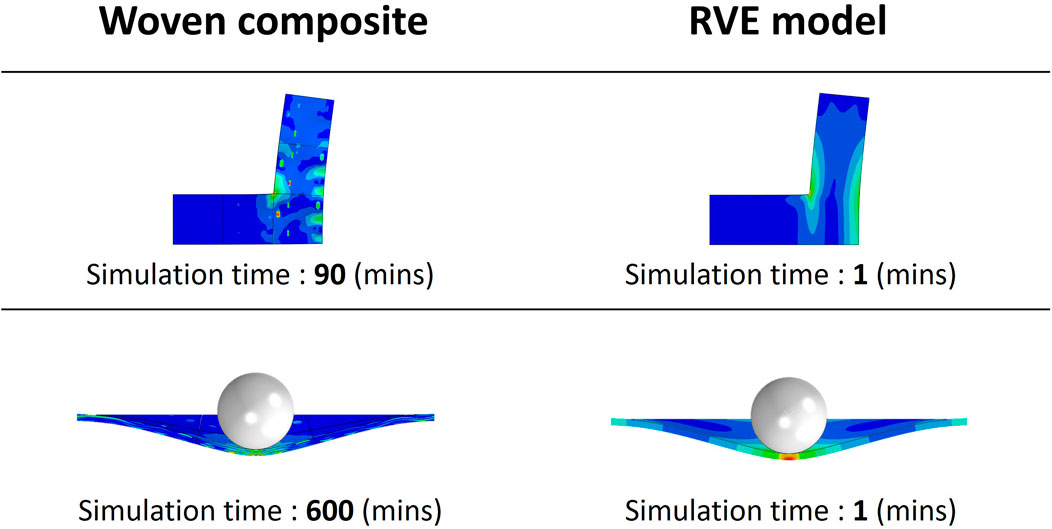
FIGURE 12. Comparison between Smart RVE modelling and conventional finite element simulation for the woven composite material.
In our current work, our primary focus is on unit elements of single-layer woven fiber composites, which restricts the direct applicability to multi-layer woven fiber composites. Nonetheless, integrating additional simulations related to multi-layer materials into the dataset could potentially overcome this limitation and enable precise predictions for multi-layer woven fibers. Another challenge arises from the material parameters. Our study investigates linearly elastic materials, making it difficult to predict parameters for nonlinearly elastic materials. Broadening the material parameter data to include plasticity cases may allow for more accurate predictions for such materials. Augmenting the dataset with nonlinear material data is a viable and effective strategy to enhance the model’s predictive capabilities.
Focusing on woven fiber composites, our team developed a structural model using a dual input CNN deep learning model to predict mechanical properties, as shown in Figure 13. We created a model using this process and integrated it with Moldex3D, obtaining valid analytical results with an analysis speed that was several times faster compared to conventional finite element analysis. The first step of the research was to process the data of the woven composite material, with Moldex3D providing the relevant material properties (fiber and resin) for preprocessing. Next, we created a model of the woven composite material using the opensource software TexGen. The mechanical properties of the woven composite was further analyzed by simulation using ABAQUS. It was then used as the training database for the deep learning algorithm. During the creation of the deep learning model, the parameters of the neural network were continuously iterated and updated by comparing the results with the ground truth obtained through finite element analysis in order to optimize the prediction capability. After the neural network model was created, we provided Moldex3D with the structure and the trained neural network. Through this model, the corresponding equivalent moduli of the woven composite material could be obtained directly using only data conforming to the format of the neural network. By integrating this prediction module into the original RTM module in Moldex3D, the computation speed of the finite element analysis was successfully accelerated, while the analytical results were of a comparably high level of accuracy with conventional finite element analysis.
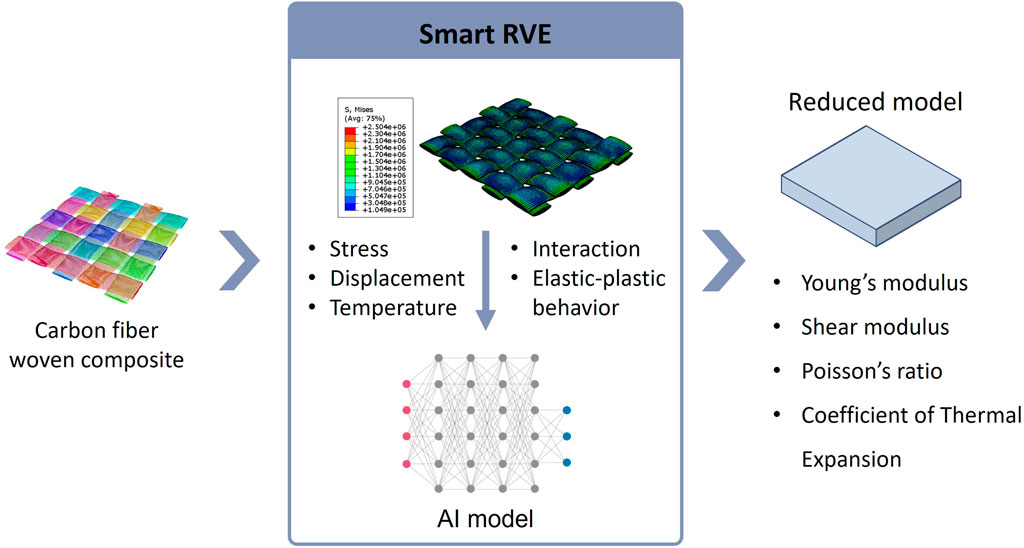
FIGURE 13. The proposed framework of the direct prediction of the equivalent moduli for woven composite materials using the AI model.
We developed a predictive model using deep learning to solve the computing problem faced by finite element analysis, i.e., to reduce computing time while also exhibiting excellent performance when implemented on industrial software, demonstrating that AI can be feasibly used with simulation software for finite element analysis. A patent has also been successfully filed. It is anticipated that this method could be extended to more and more simulation modules in order to solve other long-standing problems faced by practitioners of finite element analysis, especially for the semiconductor and injection molding industries in which the precision of design is crucial.
The raw data supporting the conclusion of this article will be made available by the authors, without undue reservation.
C-HY contributed to the concept and design of the study. M-KH, WC, and B-YH developed the computational framework. M-KH organized the data with B-YH and M-KH designed the neural network with C-HY, M-KH, WC, and C-HY wrote the first draft. All authors participated in progress discussion.
The National Science and Technology Council, Taiwan: MOST 111-2314-B-006-047.
The authors would like to acknowledge the financial support of the National Science and Technology Council (MOST 111-2314-B-006-047), Taiwan. The authors are also grateful to the National Center for High-performance Computing and Simutech Solution Corporation (Taiwan) for providing computational resources.
Authors L-HS, C-HH, and R-YC were employed by the company CoreTech System (Moldex3D).
The remaining authors declare that the research was conducted in the absence of any commercial or financial relationships that could be construed as a potential conflict of interest.
All claims expressed in this article are solely those of the authors and do not necessarily represent those of their affiliated organizations, or those of the publisher, the editors and the reviewers. Any product that may be evaluated in this article, or claim that may be made by its manufacturer, is not guaranteed or endorsed by the publisher.
The Supplementary Material for this article can be found online at: https://www.frontiersin.org/articles/10.3389/fmats.2023.1179710/full#supplementary-material
Albawi, S., Mohammed, T. A., and Al-Zawi, S. (2018). Understanding of a convolutional neural network. Proc. 2017 Int. Conf. Eng. Technol. ICET 2017, 1–6. doi:10.1109/ICENGTECHNOL.2017.8308186
Booysen, F. (2002). An overview and evaluation of composite indices of development. Soc. Indic. Res. 59 (2), 115–151. doi:10.1023/A:1016275505152
Bullock, J., Luccioni, A., Hoffman Pham, K., Sin Nga Lam, C., and Luengo-Oroz, M. (2020). Mapping the landscape of artificial intelligence applications against COVID-19. J. Artif. Intell. Res. 69, 807–845. doi:10.1613/JAIR.1.12162
Dresselhaus, M. S., and Avouris, P. (2007). “Introduction to carbon materials research,” in Carbon nanotubes (Berlin, Germany: Springer), 1–9. doi:10.1007/3-540-39947-X_1
Edwards, I., Marsh, H., and Menendez, R. (2013). Introduction to carbon science. Available at: https://www.google.com/books?hl=zh-TW&lr=&id=Oif9BAAAQBAJ&oi=fnd&pg=PP1&dq=carbon&ots=Icr5gGJWEF&sig=CnQqmJRC95-jsZUj79b_iQGpXh4 (Accessed April 8, 2022).
Foss, P. H., Tseng, H. C., Snawerdt, J., Chang, Y. J., Yang, W. H., and Hsu, C. H. (2014). Prediction of fiber orientation distribution in injection molded parts using Moldex3D simulation. Polym. Compos. 35 (4), 671–680. doi:10.1002/PC.22710
Fred Agarap, A. M. (2017). An architecture combining convolutional neural network (CNN) and support vector machine (SVM) for image classification. Available at: http://arxiv.org/abs/1712.03541 (Accessed April 8, 2022).
Giner, E., Sukumar, N., Tarancón, J., and Fuenmayor, F. (2009). An Abaqus implementation of the extended finite element method. Eng. Fract. Mech. 76 (3), 347–368. doi:10.1016/J.ENGFRACMECH.2008.10.015
Hamet, P., and Tremblay, J. (2017). Artificial intelligence in medicine. Metabolism 69, S36–S40. doi:10.1016/J.METABOL.2017.01.011
Li, S., and Wongsto, A. (2004). Unit cells for micromechanical analyses of particle-reinforced composites. Mech. Mater. 36 (7), 543–572. doi:10.1016/S0167-6636(03)00062-0
Lin, H., Brown, L. P., and Long, A. C. (2011). Modelling and simulating textile structures using TexGen. Adv. Mater. Res. 331, 44–47. doi:10.4028/www.scientific.net/amr.331.44
Long, A. C., and Brown, L. P. (2011). 8-Modelling the geometry of textile reinforcements for composites: TexGen. Compos. Reinf. Optimum Perform. 2011, 239–264. doi:10.1533/9780857093714.2.239
Nosrat Nezami, F., Gereke, T., and Cherif, C. (2016). Analyses of interaction mechanisms during forming of multilayer carbon woven fabrics for composite applications. Compos. Part A Appl. Sci. Manuf. 84, 406–416. doi:10.1016/J.COMPOSITESA.2016.02.023
O’Shea, K., and Nash, R. (2015). An introduction to convolutional neural networks. Available at: http://arxiv.org/abs/1511.08458 (Accessed April 8, 2022).
Salehi, H., and Burgueño, R. (2018). Emerging artificial intelligence methods in structural engineering. Eng. Struct. 171, 170–189. doi:10.1016/J.ENGSTRUCT.2018.05.084
Savage, G. (1993). The properties of carbon-carbon composites. Carbon-Carbon Compos. 1993, 277–322. doi:10.1007/978-94-011-1586-5_8
Sheehan, J. E., Buesking, K. W., and Sullivan, B. J. (1994). Carbon-carbon composites. Annu. Rev. Mater. Sci. 24 (1), 19–44. doi:10.1146/ANNUREV.MS.24.080194.000315
Shi, X., Ni, X., Wang, Y., Wu, C., Li, R., and Gu, M. (2019). Injection mold analysis based on Moldex3D car dashboard back cover casting System. IOP Conf. Ser. Earth Environ. Sci. 252 (2), 022103. doi:10.1088/1755-1315/252/2/022103
Tsai, S. W., and Hahn, H. T. (2018). Introduction to composite materials. Introd. Compos. Mater. 2018, 9780203750148. doi:10.1201/9780203750148
Tseng, H.-C. (2018). “Latest molding simulation and mechanical performance prediction for long fiber composites using Moldex3D and digimat,” in SPE ACCE Conference 2018, Michigan, September 2018.
Tseng, H., Hsu, C., and CoreTech, R. C. (2017) Long fiber orientation and structural analysis using Moldex3D, Digimat and Abaqus simulations. Available at: https://www.researchgate.net/publication/318670458 (Accessed 24 February 2023).
Yamashita, R., Nishio, M., Do, R. K. G., and Togashi, K. (2018). Convolutional neural networks: An overview and application in radiology. Insights into Imaging 9 (4), 611–629. doi:10.1007/S13244-018-0639-9
Yang, Z., Yu, C. H., and Buehler, M. J. (2021). Deep learning model to predict complex stress and strain fields in hierarchical composites. Sci. Adv. 7 (15), eabd7416. doi:10.1126/SCIADV.ABD7416
Yu, C.-H., and Buehler, M. J. (2020). Sonification based de novo protein design using artificial intelligence, structure prediction, and analysis using molecular modeling. Apl. Bioeng. 4 (1), 016108. doi:10.1063/1.5133026
Yu, C.-H., Chen, W., Chiang, Y.-H., Guo, K., Moldes, Z. M., Kaplan, D. L., et al. (2022a). End-to-End deep learning model to predict and design secondary structure content of structural proteins. ACS Biomaterials Sci. Eng. 8 (3), 1156–1165. doi:10.1021/ACSBIOMATERIALS.1C01343/SUPPL_FILE/AB1C01343_SI_001.ZIP
Yu, C.-H., Wu, C.-Y., and Buehler, M. J. (2022b). Deep learning based design of porous graphene for enhanced mechanical resilience. Comput. Mater. Sci. 206, 111270. doi:10.1016/J.COMMATSCI.2022.111270
Zhang, J., Chaisombat, K., He, S., and Wang, C. H. (2012). Hybrid composite laminates reinforced with glass/carbon woven fabrics for lightweight load bearing structures. Mater. Des. 36, 75–80. doi:10.1016/J.MATDES.2011.11.006
Keywords: finite element method, deep learning, representative volume element (RVE), carbon fiber woven composite material, mechanical properties
Citation: Hsu M-K, Chen W, Huang B-Y, Shen L-H, Hsu C-H, Chang R-Y and Yu C-H (2023) A deep learning empowered smart representative volume element method for long fiber woven composites. Front. Mater. 10:1179710. doi: 10.3389/fmats.2023.1179710
Received: 04 March 2023; Accepted: 25 April 2023;
Published: 05 May 2023.
Edited by:
Reza Abedi, The University of Tennessee, Knoxville, United StatesReviewed by:
Anna Tarakanova, University of Connecticut, United StatesCopyright © 2023 Hsu, Chen, Huang, Shen, Hsu, Chang and Yu. This is an open-access article distributed under the terms of the Creative Commons Attribution License (CC BY). The use, distribution or reproduction in other forums is permitted, provided the original author(s) and the copyright owner(s) are credited and that the original publication in this journal is cited, in accordance with accepted academic practice. No use, distribution or reproduction is permitted which does not comply with these terms.
*Correspondence: Chi-Hua Yu, am9ubnl5dUBncy5uY2t1LmVkdS50dw==
Disclaimer: All claims expressed in this article are solely those of the authors and do not necessarily represent those of their affiliated organizations, or those of the publisher, the editors and the reviewers. Any product that may be evaluated in this article or claim that may be made by its manufacturer is not guaranteed or endorsed by the publisher.
Research integrity at Frontiers
Learn more about the work of our research integrity team to safeguard the quality of each article we publish.