 Yeermulati Muhadeer1
 Hao Peiwen
95% of researchers rate our articles as excellent or good
Learn more about the work of our research integrity team to safeguard the quality of each article we publish.
Find out more
ORIGINAL RESEARCH article
Front. Mater. , 02 May 2023
Sec. Structural Materials
Volume 10 - 2023 | https://doi.org/10.3389/fmats.2023.1179114
This article is part of the Research Topic Recent Advances in Testing and Modeling of Performance-related Mechanical Properties of Asphalt Mixtures View all 6 articles
Traditional design methods seldom consider accumulation properties, which influence the structure of asphalt mixtures. Therefore, this study is the first to put forward a modified compressible packing model. The filling characteristics of coarse aggregate were studied. Different matrix compaction indexes
The traditional Marshall, Superpave, and SAC design methods all select volume design as the basis. Moreover, the optimum proportion is identified according to improved gradation. However, none of these methods consider the accumulation properties of aggregates. Coarse aggregates in the skeleton structure bear the load, while fine aggregates, mineral powder, and asphalt fill the air voids. The mixture is referred to as a framework-pore structure when excessive air voids remain after filling. When the coarse aggregates are separated by fillers, the mixture is referred to as a suspend-dense structure. When the mortar fills the air voids and does not destroy the coarse aggregate structure, the mixture is referred to as a framework-dense structure. Therefore, it is necessary to study the accumulation properties of aggregate. The present study applied the compressible packing model (CPM) (De Larrard, 1999) to explore aggregate accumulation properties.
The aggregate accumulation theory is based on geometric interactions between aggregates of different sizes. Accumulation density is calculated based on the density of different size distributions. The common models include the Furnas model (Furnas, 1929), Toufar model (Toufar et al., 1976), Dewar model (Dewar, 2002), Furnas model (Stovall et al., 1986), and CPM (De Larrard, 1999). The present study used the CPM to design asphalt mixture proportions. The CPM mainly optimizes gradation (Thushara and Murali Krishnan, 2022) and has been applied to different asphalt mixture types, including cold-emulsified asphalt mixtures (Wang and Dong, 2021), high-modulus asphalt mixtures (Moghaddam and Baaj, 2020), large stone porous asphalt mixtures (Yuan et al., 2020), and high-performance asphalt concretes (Olard and Perraton, 2010; Olard, 2012). Digital techniques have also been introduced to further explore the accumulation properties of mixtures (Bressi et al., 2016; Tan et al., 2017; Xing, 2018; Wang et al., 2022). However, the accumulation properties of RAP materials are seldom considered (Ding et al., 2019) and require further study.
The third-generation compressible packing model proposed by LCPC better represents the interactions between different sizes of particles based on mathematical equations. The CPM establishes a correlation between the virtual packing density and the actual packing process. The CPM proposes a loosing effect coefficient, wall effect coefficient, and compaction index, as well as the virtual packing density (γ) and residual bulk density (β). A characteristic particle size exists among the size ranges. Moreover, the packing structure of a specified size class is influenced by particles of other size classes. The diameters of particles with different sizes (1, 2, and 3) are assumed, as shown in Eq. 1, in which particles
The particles
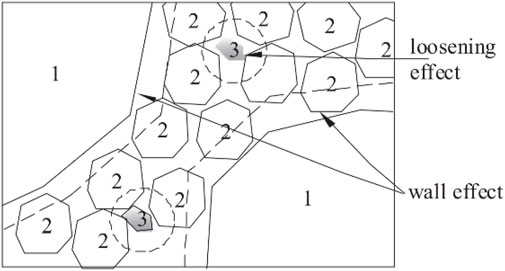
FIGURE 1. System for the packing of multiple particles.
The packing density of ternary accumulation is calculated using Eqs 2 and 3:
Eqs 2 and 3 can be used to determine the packing density γi of n-ary accumulation, as shown in Eq. 4:
The loosing effect coefficient
where “d” is the characteristic size, which is calculated in Eq. 7:
Larrard proposed the compaction index K and found that the K value is determined only by the actual packing process, which is defined in Eq. 8:
where
Thus, K is deduced in Eq. 10:
The actual density is calculated using Eq. 11, in which
For the accumulation of the same particles, K is calculated as shown in Eq. 12:
The K value reflects the compactness when different classes of particle sizes occupy the majority. As the K value increases, the actual accumulation density increases to the virtual accumulation density.
The packing density is correlated with particle and particle morphology. However, in CPM, Eqs 4 and 5 only calculate the loosing and wall effects. The particle morphology is not considered, leading to differences between the predicted and actual accumulation densities. Therefore, the loosing and wall effects should be modified to consider the particle morphology.
The size ranges (4.75–9.5mm, 9.5–13.2 mm) were selected to allow binary accumulation at different proportions. The accumulation density was calculated (Table 1.
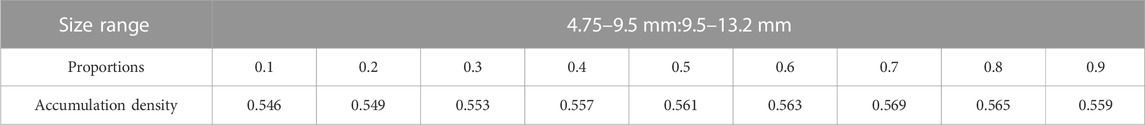
TABLE 1. ccumulation densities of binary packing.
Based on De Larrard's research on the interaction coefficient, the expressions of the loosing and wall effect coefficients are shown in Eqs 13 and 14:
The expression can be translated into Eqs 15 and 16:
According to the definition, the interaction coefficient and the ratio of characteristic particle sizes are 0–1. Thus, Eqs 15 and 16 can be translated to Eqs 17 and 18.
where
According to Eqs 13, 14,17, and 18, the morphology values are calculated, as shown in Table 2.

TABLE 2. Morphology values of the binary accumulations.
The function expressions of f (
where
The modified loosing and wall effect coefficients were then brought into the CPM. The results of virtual and actual accumulation densities are shown in Table 3.
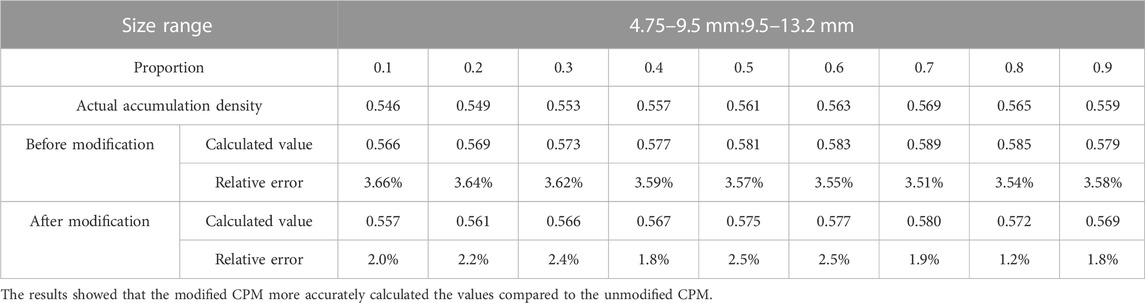
TABLE 3. Differences in packing density.
The interlocking structure is easily influenced by the filling effect of the coarse aggregate. Therefore, the filling characteristics of coarse aggregate must be evaluated. The modified CPM can predict the density of coarse aggregate, which is directly correlated with the interlocking structure. This section mainly discusses the modified CPM in asphalt mixture design.
The matrix compaction index
The area coefficient (A) is the ratio of total surface area to the maximum total surface area that the n-ary particles can achieve different proportions, which is expressed as shown in Eq. 24:
The equivalent spherical diameter is defined as the weighted average sum of the average size in each class of aggregate, which is expressed as shown in Eq. 25:
where
The density, matrix compaction index
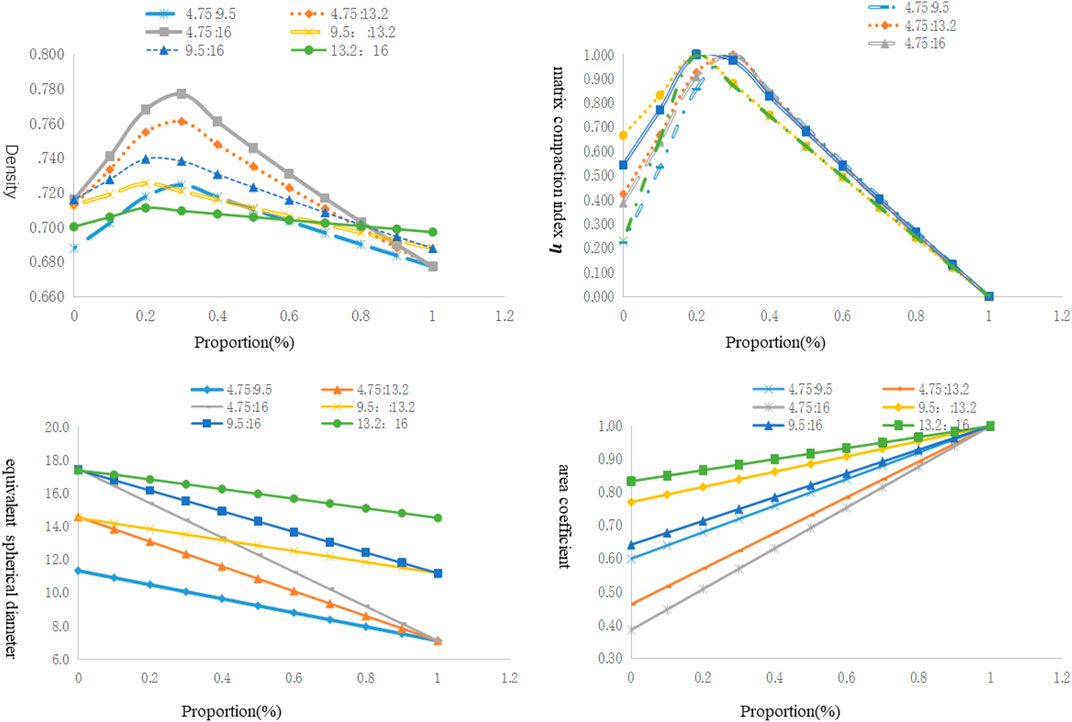
FIGURE 2. Variation diagrams in binary accumulation.
Based on Figure 2, the peak density value and the changing rate around the peak
The CPM model was applied in AC-13 mixture designs containing different matrix compaction indexes. The pass rates of 13.2 mm, 4.75 mm, and 0.075 mm were assumed to be 95%, 35%, and 7%. The matrix compaction indexes were set to 1, 0.8, 0.6, 0.4, and 0.3. The designed gradations are shown in Table 4.
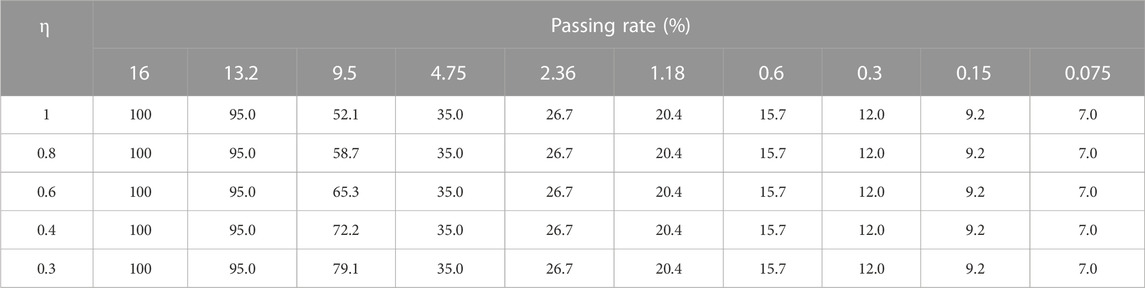
TABLE 4. Gradations on AC-13 containing different matrix compaction indexes.
The volumetric parameter variation with asphalt content is shown in Figure 3, where γ is the virtual accumulation density except for the mineral powder.
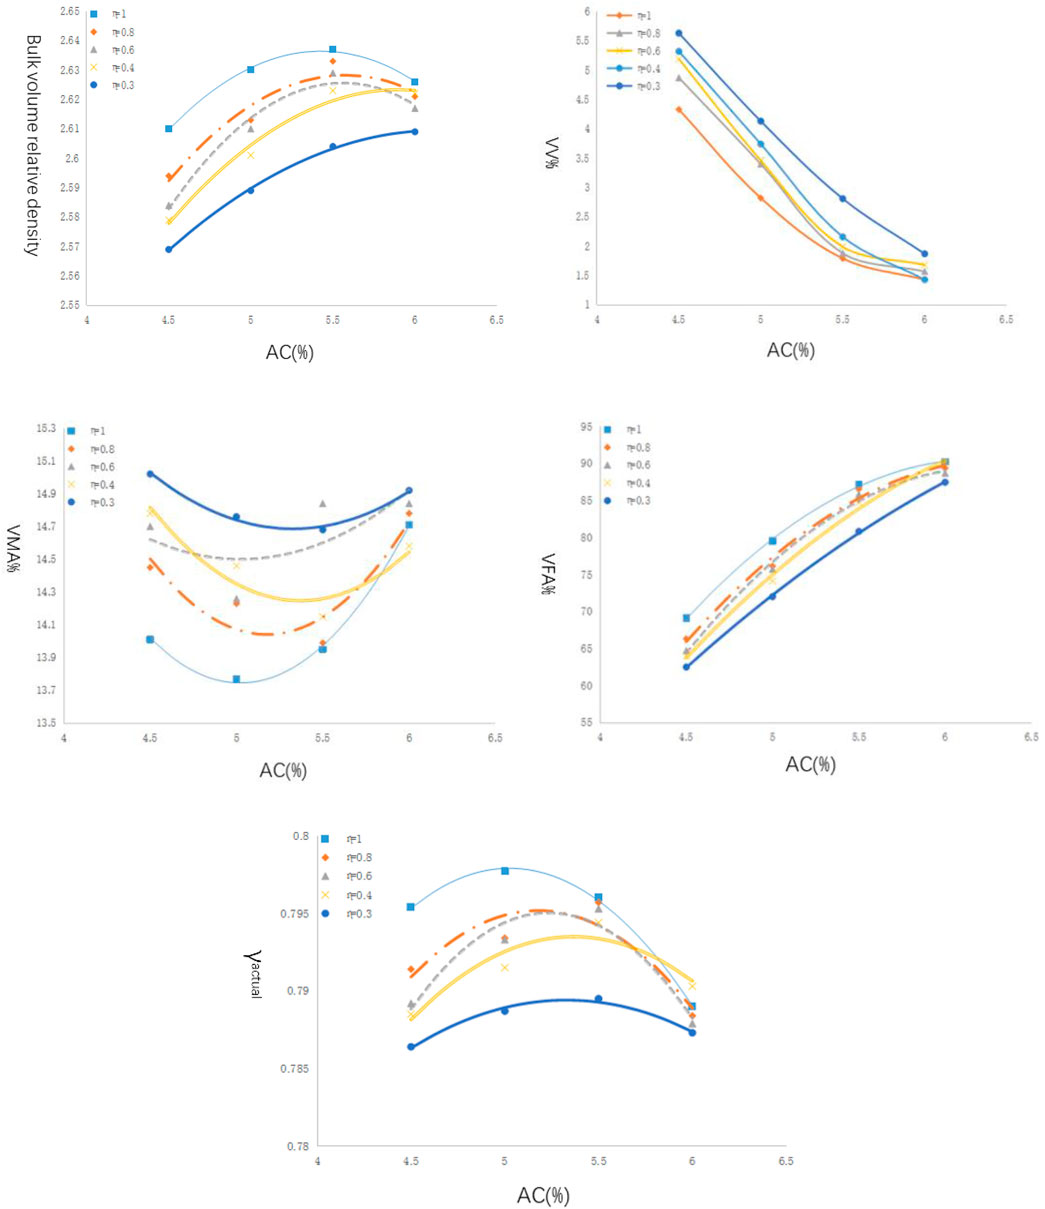
FIGURE 3. volumetric parameters with asphalt content.
According to Figure 3, the two methods were selected to determine the optimum asphalt content.
Method 1: The volumetric parameters were determined based on a 4% air void, as shown in Table 5.
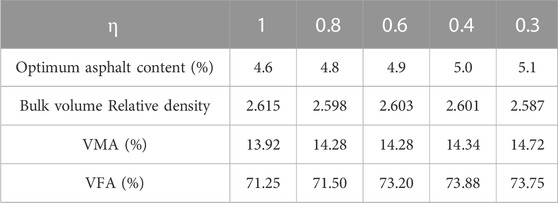
TABLE 5. Volumetric parameters based on a 4% air void.
Method 2: The volumetric parameters were determined based on the minimum VMA, as shown in Table 6.

TABLE 6. olumetric parameters based on the minimum VMA.
The volumetric properties and pavement performance of AC-13 containing different η based on the CPM were assessed. The pass rates of 13.2 mm and 0.075 mm were set to 95% and 6%. Moreover, η = 1. The pass rate for 4.75 changed. The designed gradations are shown in Table 7.
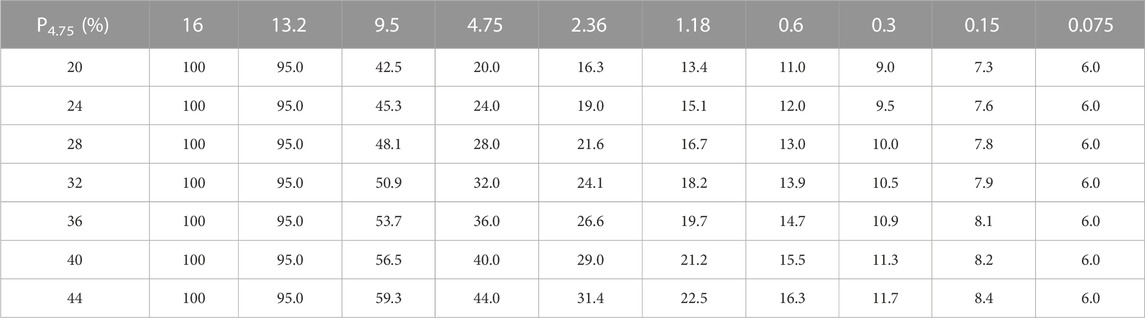
TABLE 7. Pass rates of gradations containing different contents of coarse aggregates.
The parameters measured by the Marshall tests are shown in Table 8.
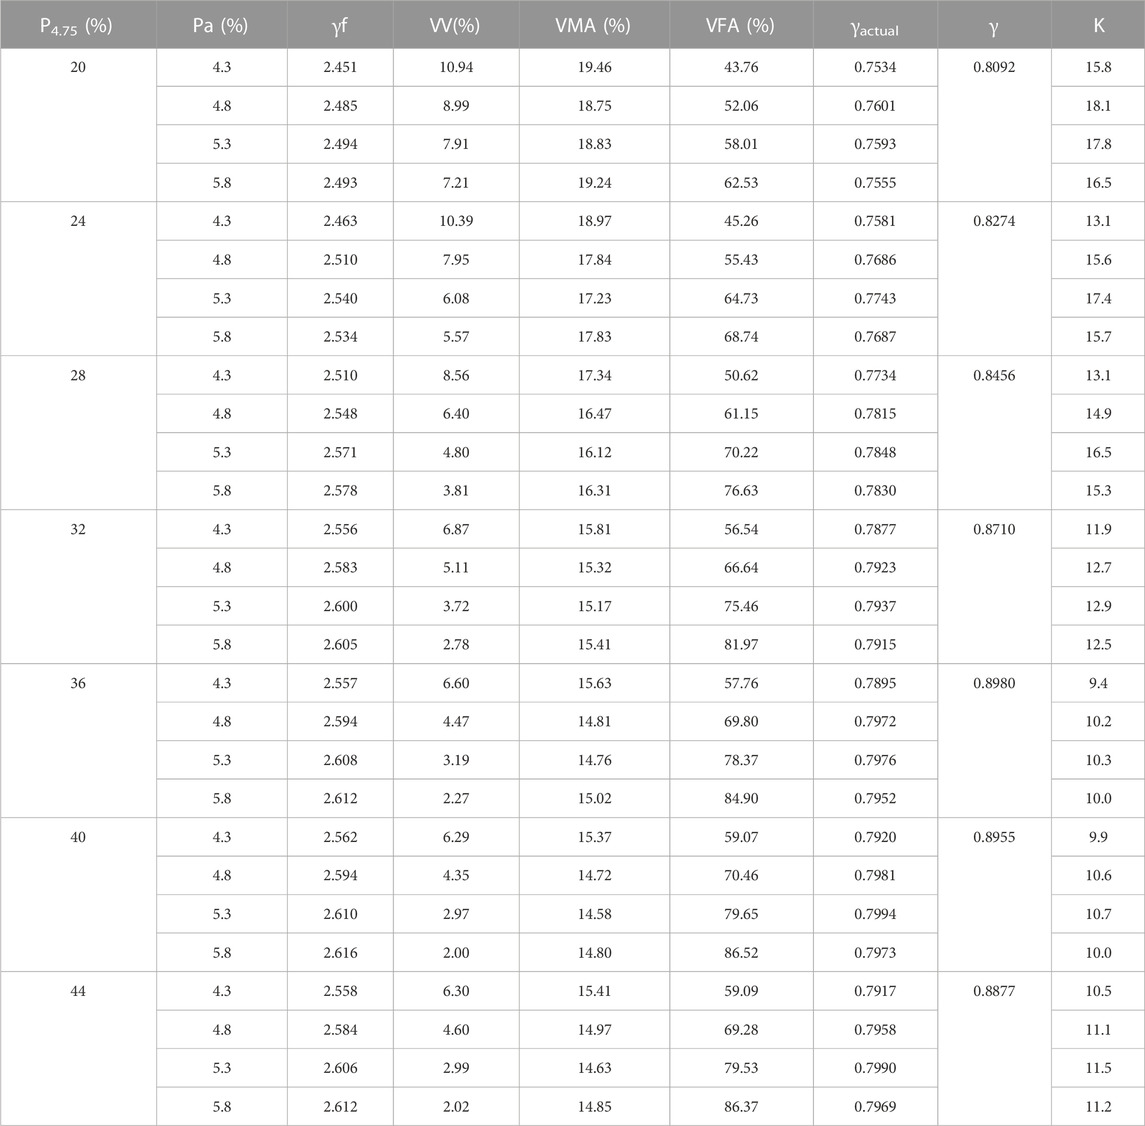
TABLE 8. Marshall test results.
Methods 1 and 2 were applied to determine the optimum asphalt content and volumetric parameters. The results are shown in Table 9.
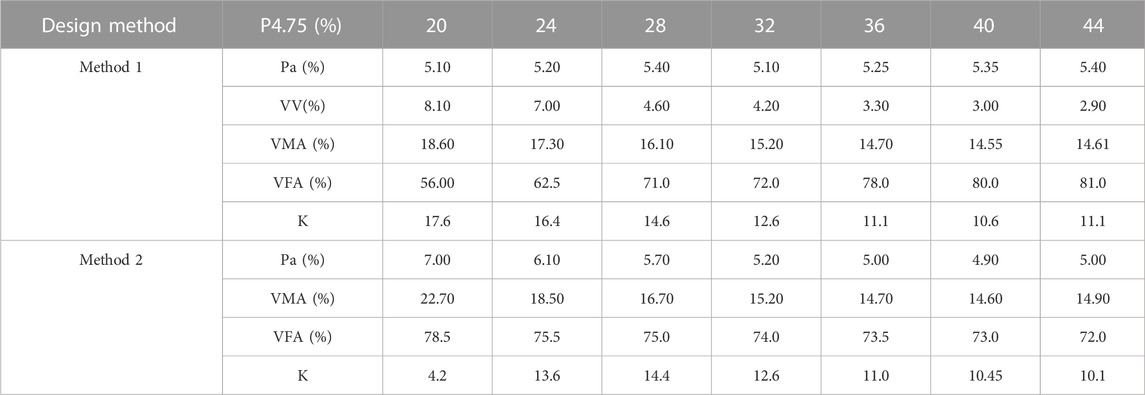
TABLE 9. Parameters for different design methods.
The correlations between the optimum asphalt content and coarse aggregates are shown in Supplementary Figure S1. As the content of coarse aggregate increased, the optimum asphalt content based on method 2 first increased and then decreased. The minimum value, which was approximately 4.9, appeared at 60% content. As the content of coarse aggregates increased, the density decreased. In mixture design based on method 2, increasing asphalt improved the mixture density. However, the asphalt content could not be increased in terms of the asphalt film thickness. According to Supplementary Figure S1, the gradation corresponding to the minimum value of asphalt content was defined as the optimum gradation in method 2.
In method 1, the maximum and minimum values of optimum asphalt content were 68% and 72%, corresponding to 5.2% and 5.4%. In the anterior segment of the curve, as the content of coarse aggregate increased, the content of fine aggregate decreased. Meanwhile, the specific surface area decreased, causing reduced asphalt content. Between the minimum and maximum values, as the coarse aggregates increased, the VMA increased and there was enough space for asphalt. A tendency for increased optimum asphalt content was observed. Therefore, the minimum value for optimum asphalt content corresponded to the optimum gradation.
As the coarse aggregate content increased, the VMA increased. If more asphalt was added, the excess asphalt was easy to flow and a maximum value was obtained.
Supplementary Figure S2 shows a pie chart of K values and 4.75 mm passing rates. At the same virtual accumulation density, the actual accumulation density increases as the K value increases. The K value designed by method 2 is larger than that designed by method 1; thus, at a 4.75 mm passing rate, the K value and VMA can characterize the compactness. When the 4.75 mm passing rate is 20%, the K value designed by method 2 is larger than that designed by method 1. While the OAC for method 1 is 7%, the asphalt content is excessive, lowering the aggregate density. When the 4.75 mm passing rate is between 32% and 36%, the K values designed by the two methods are similar, showing that this range can satisfy both the air void and VMA requirements.
The relationship curves between the VMA, air void, and 4.75 mm passing rate are shown in Figure 4. According to the results, at the 32%–36% range, the VMA and air void obtained by the two methods are similar, which corresponds to the law similar to the K value as discussed previously.
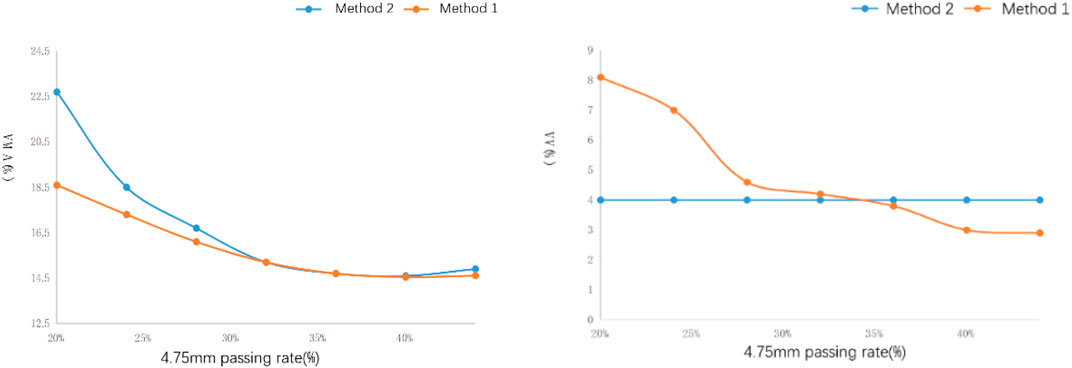
FIGURE 4. Relationships among the VMA, VV, and 4.75 mm passing rate, (A)VMA. (B)VV.
The K values at different η are analyzed. The relationships between K values and asphalt content are shown in Figure 5. The data were fitted to a quadratic polynomial and showed good correlation. In the Figure 5, at 35%, P4.75 and the K value at each η all increase and then decrease as the asphalt content increases because when the asphalt content increases to a certain value, the redundant asphalt interferes with the virtual accumulation density, which reduces the K value. As η decreases, the corresponding K value increases because the stacking clearance rate is lower at higher η. The proportion of coarse aggregate is high. At the same compaction, fine aggregates show lower compaction, causing a low K value. When the η is lower, the skeleton clearance rate is higher. The free space of fine aggregate increases, lowering the dry packing accumulation density.
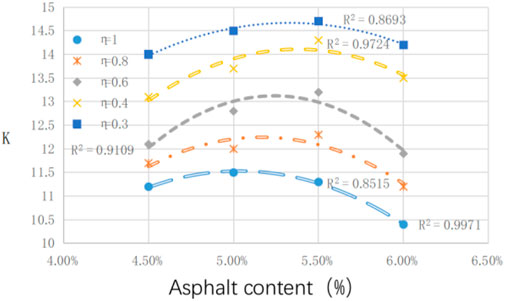
FIGURE 5. K values for different asphalt contents.
Therefore, the correlation between the K value and asphalt content must be determined. The regression model is as follows:
where K is the compaction index and A, B, C, D, and E are the fitting parameters.
The quaternion regression was conducted using SPSS software. The results are shown in Table 10. R2 was 0.958, and the model showed good precision.
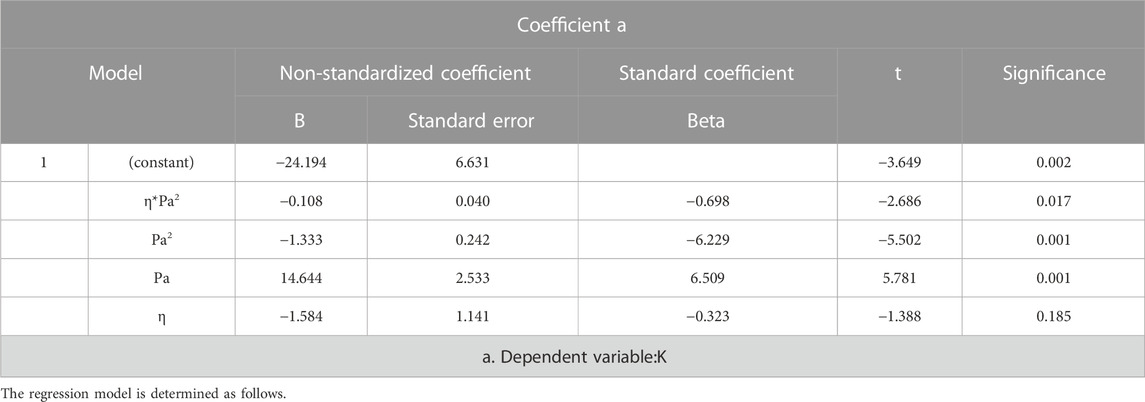
TABLE 10. Regression coefficients.
The asphalt content corresponding to the VMA minimum value is the optimum asphalt content, which was determined as described previously. The design process is as follows.
1) For gradation with different nominal sizes, after selecting the maximum nominal size passing rate, the η, 4.75 mm passing rate P4.75, and 0.075 mm passing rate P0.075 for different group mixtures are identified. Then, the corresponding gradations and mineral powder contents are determined through the compressible packing model.
2) The η, P4.75, and OAC (usually 4.5%, 5.0%, 5.5%, 6%, or 6.5%) are set as the inputs in the K value prediction model to obtain the K values for different asphalt contents of each gradation.
3) The virtual accumulation density is calculated through the CPM. The VMA is calculated using the mineral power volume. The actual accumulation density is calculated by the K value. The VV is then calculated by subtracting the asphalt volume absorbed by aggregate from the total asphalt volume.
4) After selecting the minimum VMA, the gradation with an acceptable VV range (usually 3%–5%) is selected as the optimum gradation.
5) The optimum asphalt content of the optimum gradation is determined through the minimum VMA design method and the parameter indexes; for instance, VV, is checked to satisfy the design requirements.
6) The pavement performance tests are conducted at the optimum proportions.
The flow chart is shown in Figure 6.
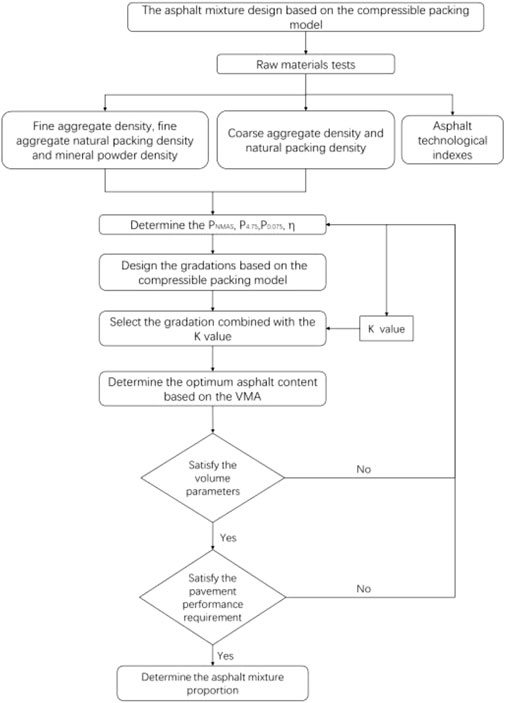
Figure 6. Verification of asphalt mixture design based on the compressible packing model.
Diorite aggregate and mineral powder were chosen. SBS asphalt was selected for asphalt mixture design. The design air void range was 3%–5%. The minimum VMA was 13%. The chosen gradations are shown in Table 11.
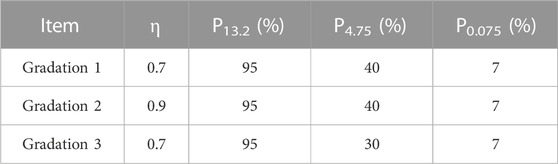
TABLE 11. Gradation design parameters.
The passing rates through the CPM are shown in Table 12.
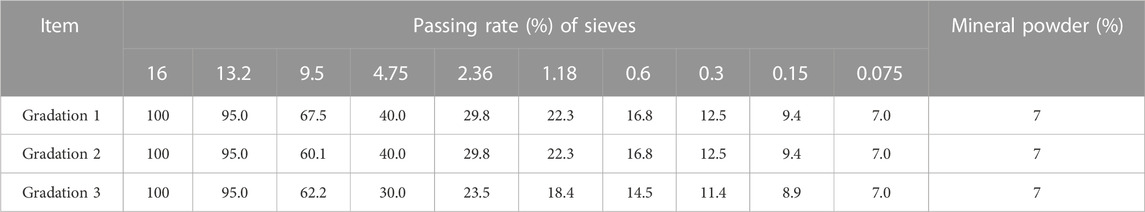
TABLE 12. Passing rates of the three gradation types.
The η, P4.75, asphalt contents (4.5%,5.0%,5.5%,6%, and 6.5%) are the inputs into the K value regression model. The K values of gradations with different asphalt contents are shown in Table 13.
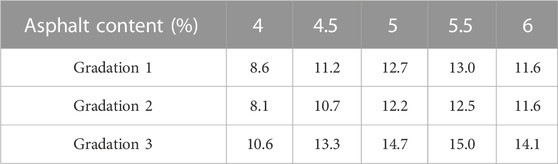
TABLE 13. K values for different asphalt contents.
The proportion of each sieve aggregate, virtual accumulation density, and actual accumulation density are shown in Table 14 and Table 15.
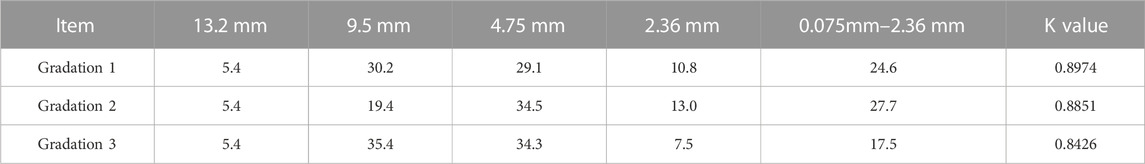
TABLE 14. Proportion and K value of the aggregates.
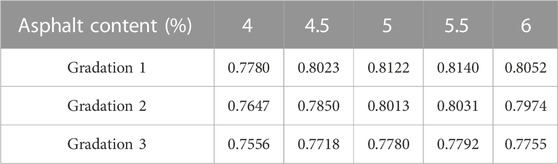
TABLE 15. ctual accumulation of the gradations for different asphalt contents.
The volumetric parameters are calculated, as shown in Tables 16, 17.
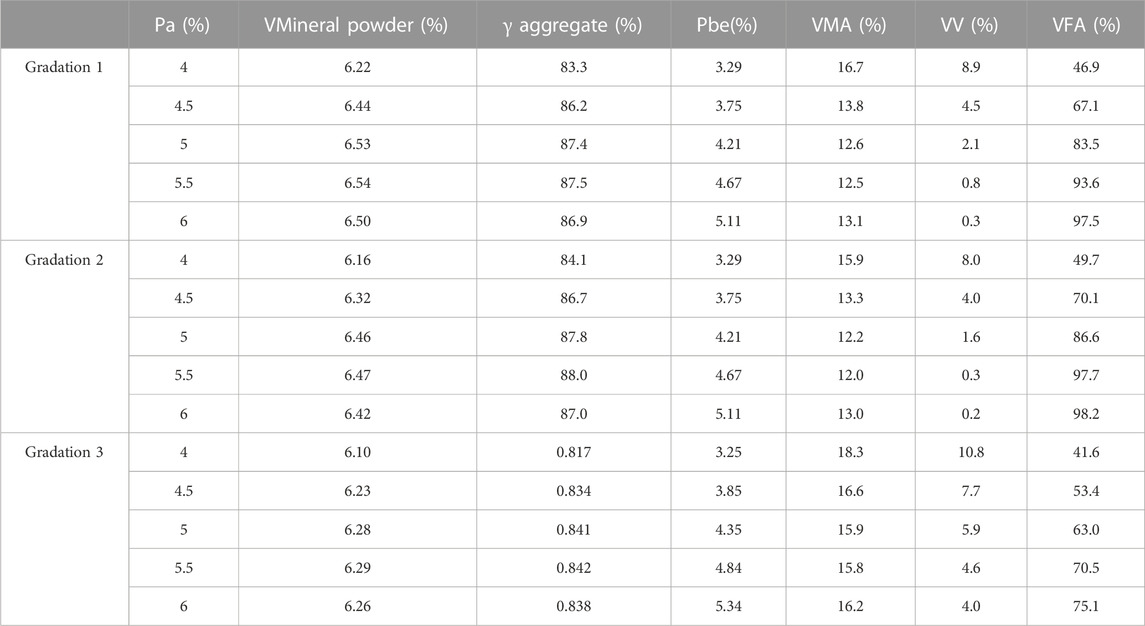
TABLE 16. Mixture parameters.
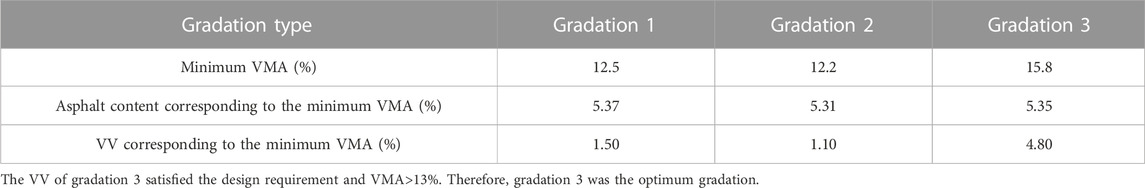
TABLE 17. Calculated parameters.
The relationships among asphalt content, VMA, and VV are shown in Supplementary Figure S3.
According to the Figure 7, the volumetric parameters are shown in Table 17.
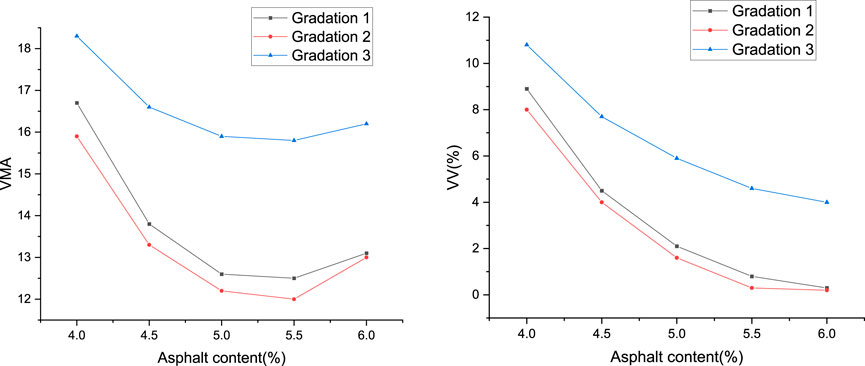
FIGURE 7. elationships among VMA, VV, and asphalt content.
The Marshall tests of gradation 3 were conducted, and the volumetric parameters were measured. The results are shown in Table 18.
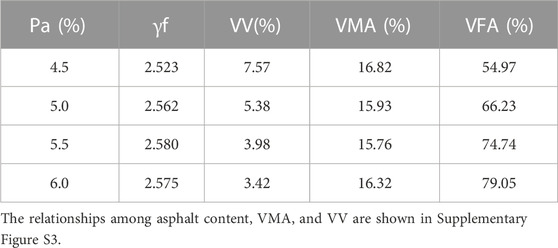
TABLE 18. Marshall test results for gradation 3.
When the VMA is chosen as the minimum, Pa was 5.3% and the corresponding VV was 4.40%, which satisfied the VV requirement. The pavement performance tests were conducted at 5.3% Pa. The results are shown in Table 19.
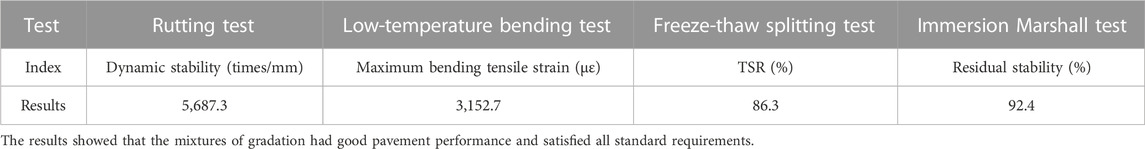
TABLE 19. Pavement performance for gradation 3.
This study designed asphalt mixtures by changing the parameters based on the compressible packing model and conducted pavement performance tests for different gradation types. Based on our results, we proposed an asphalt mixture design based on the compressible packing model. The main conclusions are as follows.
1. The matrix compaction index
2. Analysis of the three gradations based on the proposed CPM design method showed that when the 4.75 passing rate was <28%, the optimum asphalt content based on the 4% air void method was higher. When the 4.75 passing rate was between 28% and 36%, the optimum asphalt contents of both methods were similar. When the 4.75 mm passing rate was >36%, the optimum asphalt content based on the 4% air void was lower.
3. K values were calculated based on volumetric parameters and the compressible accumulation model. At fixed gradation, the K peak value emerged as the asphalt content increased. At a fixed 4.75 mm passing rate, the K value increased as the matrix compaction index
4. An asphalt mixture design was suggested based on the modified compressible packing model. The results showed that the mixtures of gradation had good pavement performance and satisfied all standard requirements.
The original contributions presented in the study are included in the article/Supplementary Material. Further inquiries can be directed to the corresponding author.
YM and SL: data acquisition; HP: critical revision of the manuscript for important intellectual content; LN and WJ: data analysis and manuscript drafting.
Authors YM and SL were employed by CRCC Xinjiang Jing Xin Expressway CD, Ltd.
The remaining authors declare that the research was conducted in the absence of any commercial or financial relationships that could be construed as a potential conflict of interest.
All claims expressed in this article are solely those of the authors and do not necessarily represent those of their affiliated organizations, or those of the publisher, the editors, and the reviewers. Any product that may be evaluated in this article, or claim that may be made by its manufacturer, is not guaranteed or endorsed by the publisher.
The Supplementary Material for this article can be found online at: https://www.frontiersin.org/articles/10.3389/fmats.2023.1179114/full#supplementary-material
Bressi, S. A. R. A., Dumont, A. G., and Partl, M. N. (2016). An advanced methodology for the mix design optimization of hot mix asphalt. Mater. Des. 98 (15), 174–185. doi:10.1016/j.matdes.2016.03.003
De Larrard, F. (1999). Concrete mixture proportioning: A scientific approach. Boca Raton, FL, USA: CRC Press.
Ding, X., Chen, L., Ma, T., Ma, H., Gu, L., Chen, T., et al. (2019). Laboratory investigation of the recycled asphalt concrete with stable crumb rubber asphalt binder. Constr. Build. Mater. 203, 552–557. doi:10.1016/j.conbuildmat.2019.01.114
Furnas, C. C. (1929). Flow of gases through beds of broken solids. Washington, DC, USA: US Government Printing Office.
Moghaddam, T. B., and Baaj, H. (2020). The use of compressible packing model and modified asphalt binders in high-modulus asphalt mix design. Road Mater. Pavement Des. 21 (4), 1061–1077. doi:10.1080/14680629.2018.1536611
Olard, F. (2012). GB5 mix design: High-performance and cost-effective asphalt concretes by use of gap-graded curves and SBS modified bitumens. Road Mater. Pavement Des. 13, 234–259.
Olard, F., and Perraton, D. (2010). On the optimization of the aggregate packing characteristics for the design of high-performance asphalt concretes. Road Mater. Pavement Des. 11, 145–169.
Stovall, T., De Larrard, F., and Buil, M. (1986). Linear packing density model of grain mixtures. Powder Technol. 48 (1), 1–12. doi:10.1016/0032-5910(86)80058-4
Tan, Y., Xing, C., Ren, J., and Zhang, L. (2017). Research on mesostructured characteristics of asphalt mixture based on particle packing theory[J]. China J. Highw. Transp. 30 (7), 1–8.
Thushara, V. T., and Murali Krishnan, J. (2022). A comprehensive particle packing-based design of bituminous mixtures and its mechanical characterisation. Int. J. Pavement Eng., 1–15. doi:10.1080/10298436.2022.2113786
Toufar, W., Born, M., and Klose, E. (1976). Beitrag zur Optimierung der Packungsdichte polydisperser körniger Systeme. Freiberger Forschungsh. 558 (29-44), 201.
Wang, L., and Dong, C. (2021). Gradation optimization of dense grading cold emulsified asphalt mixture based on particle packing theory[J]. Highw. Eng. 46 (03), 284–288+294. doi:10.19782/j.cnki.1674-0610.2021.03.043
Wang, N., Chen, F., Ma, T., Luan, Y., and Zhu, J. (2022). Compaction performance of cold recycled asphalt mixture using SmartRock sensor. Automation Construction,Volume140 140, 104377. doi:10.1016/j.autcon.2022.104377
Xing, C. (2018). Mesostrcture and stress strain transfer mechanism of skeleton filling system of asphalt mixture. Jiang Sheng, China: Harbin Institute of Technology.
Keywords: asphalt mixture, gradation design, compressible packing model, optimization, compaction
Citation: Muhadeer Y, Liang S, Peiwen H, Ningbo L and Junbiao W (2023) Optimization of asphalt mixture design based on the compressible packing model. Front. Mater. 10:1179114. doi: 10.3389/fmats.2023.1179114
Received: 03 March 2023; Accepted: 03 April 2023;
Published: 02 May 2023.
Edited by:
Hanqi Liu, Hefei University of Technology, ChinaReviewed by:
Derun Zhang, Huazhong University of Science and Technology, ChinaCopyright © 2023 Muhadeer, Liang, Peiwen, Ningbo and Junbiao. This is an open-access article distributed under the terms of the Creative Commons Attribution License (CC BY). The use, distribution or reproduction in other forums is permitted, provided the original author(s) and the copyright owner(s) are credited and that the original publication in this journal is cited, in accordance with accepted academic practice. No use, distribution or reproduction is permitted which does not comply with these terms.
*Correspondence: Hao Peiwen, c3VwZXJwYXZlQDE2My5jb20=
Disclaimer: All claims expressed in this article are solely those of the authors and do not necessarily represent those of their affiliated organizations, or those of the publisher, the editors and the reviewers. Any product that may be evaluated in this article or claim that may be made by its manufacturer is not guaranteed or endorsed by the publisher.
Research integrity at Frontiers
Learn more about the work of our research integrity team to safeguard the quality of each article we publish.