 Oliver Döbrich
 Christian Brauner
95% of researchers rate our articles as excellent or good
Learn more about the work of our research integrity team to safeguard the quality of each article we publish.
Find out more
ORIGINAL RESEARCH article
Front. Mater. , 30 March 2023
Sec. Polymeric and Composite Materials
Volume 10 - 2023 | https://doi.org/10.3389/fmats.2023.1154655
This article is part of the Research Topic ECCM Research Topic on Advanced Manufacturing of Composites View all 14 articles
Although the structural design of composite structures has already been carried out on a virtual level, composite mechanical properties remain sensitive to fiber orientation and therefore to the quality and reliability of the production process. Considering both manual single-unit manufacturing and advanced mass-unit fabrication, requirements on the production quality may differ, but certainty on the achieved result is crucial. A digital twin model, deterministically derived from produced parts, can be transferred into a virtual simulation environment to check for potential deviations of fiber alignment, resulting from variations in source material or composite production. Transferring that deterministic information into a virtual simulation environment allows for an estimation of the part’s structural potential despite any possible deviations by carrying out numerical simulation predictions on that model. This step of quality assessment can help reduce scrap parts by relying on simulation data that may demonstrate the feasibility of parts despite the containment of deviations with an otherwise uncertain impact. Therefore, further steps toward digitalization of the composite production process chain, especially on the characterization of the production quality, are aspired. In this contribution, a vision system based on a Microsoft Azure Kinect RGB-D camera is introduced which is used to digitalize the composite preform configuration from machine vision data by evaluating the achieved local fiber orientation as result of the complex preform draping process by digital image processing. A digital workflow is introduced that enables to feed the captured real-world data back into a digital environment where numerical simulations with the “as-built” fiber orientation can be carried out. The obtained results are used for assessing production quality and composite performance in the presence of possible deviations. The system, which consists of a camera array of consumer grade, can acquire real-world data and then transfer the data into a virtual environment.
Composite components have excellent mechanical properties at a low specific density compared to conventional construction materials such as metals. This combination results in a wide range of applications for components in the high-performance sector. For fiber-based composite components, the orientation of the fiber is crucial for the exploitation of the mechanical potential.
Since the manufacturing of complex-shaped parts from composite materials is a sequential process characterized by either manual or automated handling of unstable and flexible reinforcement fabrics, deviations from an ideal “as-planned” configuration are likely to be observed. The deviations can vary depending on the robustness of the process, as shown in Figure 1.
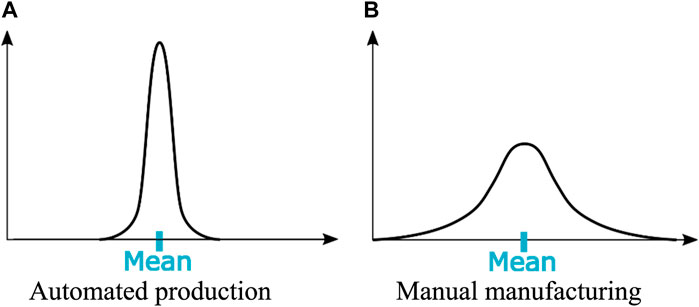
FIGURE 1. Schematic deviation from aspired production results depending on the production method. (A) Automated production. (B) Manual manufacturing.
The designing of composite parts is regularly carried out with only small reserves in mechanical capacity due to the general lightweight motivation and high material costs when using fiber-reinforced composites. Deviations in fiber orientation and defects from the manufacturing process may result in reduced structural stiffness or unpredicted failure due to reduced strength. Therefore, the use of machine vision to digitalize the quality assessment of composite production is aspired.
Nevertheless, due to the high cost and effort, fiber orientation is rarely digitally verified in practice. In this paper, a system that determines the fiber orientation at the ply level of a complex-shaped textile-reinforced composite part during preforming processes using an inexpensive RGB-D camera is presented. The Azure Kinect camera, initially launched by Microsoft for entertainment purposes, can provide both depth measurement for obtaining geometry data and texture information using an RGB sensor. A point cloud captured by the time-of-flight (TOF) IR camera is used to detect positioning of the structural geometry to identify the position in space and allocate location-based data such as fiber orientation. Based on the color image taken by the camera, the local texture is projected onto the component geometry, and the orientation of the fiber is determined using open-source image analysis. The system presented in this paper is characterized by low investment costs and a high degree of automation as well as open-source Python libraries, which allows a customization of the system and enhances the system flexibility and usability.
Optical evaluation systems are already being used in composite research, as well as in the composite industry. Algorithms for image analysis are applied at the material level to analyze geometrical features, such as voids, or at the structural level to observe macroscopic features such as fiber orientation or global defects like wrinkles.
Early computational evaluation methods were based on camera images where edge detection algorithms were applied on fast Fourier transformed images of technical reinforcement braids (Lian et al., 2000; Mersmann, 2011). Stationary cameras were used on these steady production processes where no geometrical information was required. The obtained values were used for quality assessment (Lian et al., 2000) and process control (Mersmann, 2011; Lekanidis and Vosniakos, 2020), simple damage detection (Wilhelmsen and Ostrom, 2016), and for importing material relevant input data (fiber orientation) into a virtual environment finite element analysis (FEA) models for further use in numerical simulation (Stender et al., 2019; Döbrich et al., 2021). Studies on using composite machine vision in material research to study the fatigue behavior of glass–fiber-reinforced composites are also found in the literature (Song et al., 2022). In addition, studies on using machine vision systems to investigate wrinkling caused by shearing in dry textile drape processes are found (Döbrich et al., 2013; Pasco et al., 2019).
The field of view for those applications is rather small and is limited to a specific section of composite parts or composite production processes. The digital image evaluation at the component level of composite structures is carried out by hand-guided or robot-guided camera systems (Kunze et al., 2020; Döbrich et al., 2021). Commercially available systems are provided by Hexagon (Sweden, formerly Apodius) [hand-guided inspection system (Stender et al., 2019; Antoniou et al., 2020; Döbrich et al., 2021)] or CIKONI (Germany) [robot-guided Hexagon system (Pasco et al., 2019)]. These systems can easily adapt to the shape of the structural part (Malhan et al., 2018). However, the process is time-consuming and requires either manual guidance or a geometry-specific teaching of the robotic guidance system. Another setback is that generally only the visible top layer is evaluable. This requires a sequential examination of every single layer that is draped over or added to a stack of reinforcement layers. Time- and labor-consuming semi-automated evaluation methods directly increase the assessment time when they must be carried out multiple times. However, common RGB camera images have been proved to be sufficient for the evaluation of fiber orientation features (Lian et al., 2000; Mersmann, 2011; Stender et al., 2019).
The introduced systems mostly rely on expensive hardware and specific software packages and are vulnerable to changes in environmental conditions. The general requirement for a diffuse illumination system is pointed out by most of the authors from the relevant literature due to the reflecting nature of technical reinforcement fibers, especially mandatory for analyzing carbon fibers. To address this particular challenge, novel inspection systems have been introduced that make use of the polarization effects found in carbon fibers (Ernst et al., 2016). By using this effect, fiber trace and thus fiber orientation can be determined not only on the dry textile or unconsolidated prepreg but also on the composite parts, since the polarization effect only affects the fiber and not the matrix (Atkinson et al., 2021; Schommer et al., 2023).
However, it is also not possible to analyze layers within the composite, since here, too, only the surface of reinforcement textiles and composites can be considered. Systems that can evaluate a stack of reinforcement layers are known as well. Micro-CT scans (Desplentere et al., 2005), as well as X-ray micro-CT scans (Bernardini et al., 1999a), have been used to build composite unit cell models to predict the mechanical properties. An application of this technique at the structural level is difficult to carry out and generally limited by the sample size, the duration of the method, and the costs. The eddy current sensor data can be used to evaluate the result of the preforming process (Bardl et al., 2016). Unfortunately, this technique is limited to carbon or metal fibers due to the need of electrical conductivity within the material.
In the summary of the already existing systems, it can be stated that the extraction of composite-related data is possible by simple RGB image evaluation. Composite materials are suitable for such an optical evaluation due to their heterogeneous structure, where the most important features can be determined at the mesoscopic level (yarn level). However, currently, image analysis is only used in stationary cameras for simple and continuous processes, such as braiding, where information on the positioning in space is not important, and relevant information can be extracted by observing a planar field of interest or by systems that apply an extended effort in terms of camera guidance for capturing complex geometries along with local features like fiber orientation. Methods that allow an analysis of the entire reinforcement stack are only applicable with advanced analysis methods and expensive technology, whereas sequential ply-by-ply analyses are only implemented with non-stationary systems, for which the evaluation time is high and therefore an industrial implementation is unlikely.
Therefore, a system is introduced that does not rely on manual or guided camera/sensor movement but offers an environmental observing stationary camera array that is able to capture the geometry and the texture information in a single shot. The system is fast enough that a sequential evaluation of multiple layers can be carried out without additional expenses in process time and therefore be applicable in mass consumer industries, whereas the open-source software libraries and the use of consumer hardware make it suitable for small manufacturing enterprises and research institutes. The mutual determination of structural geometry and composite relevant features derived from image processing along with adaptable open-source algorithms characterizes the novelty of the introduced system.
A twill woven fabric prepreg system composed of 200 tex carbon HT-3k multifilament yarns and epoxy resin produced by Krempel Group (Fa. Krempel GmbH, Vaihingen, Germany) was studied. The characteristics of the material are shown in Table 1 along with an image of the material.
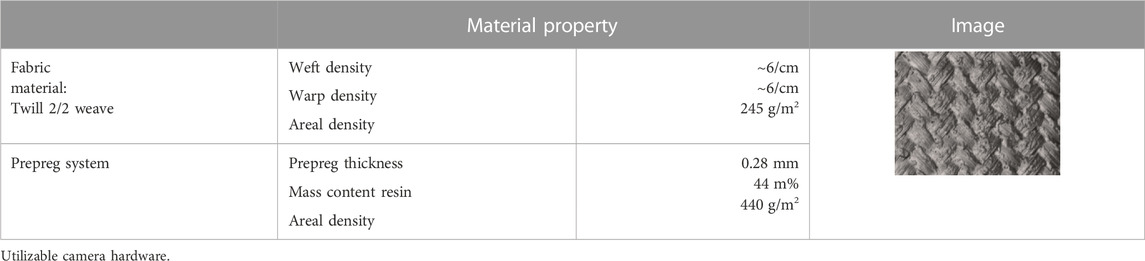
TABLE 1. Krempel KGBX 2508 prepreg system.
The approach presented in this contribution introduces a fiber orientation evaluation system based on the Microsoft Azure Kinect camera (Figure 2A). Recently, the third-generation Kinect cameras have been introduced not only for entertainment and gaming purposes but also for industrial applications. The current generation Kinect camera is equipped with a 1-MP depth sensor (IR-TOF) and a 12-MP camera for RGB image capturing. The Azure cameras are especially low-priced compared to existing composite evaluation products and come with a sync port to set up a camera array, as shown in Figure 2B.
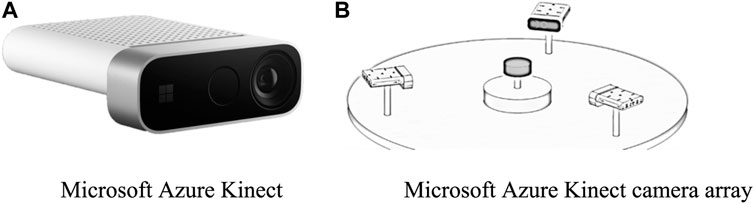
FIGURE 2. (A) Microsoft Azure Kinect. (B) Microsoft Azure Kinect camera array [image source: Microsoft].
The developed method for the detection of fiber orientation using the Microsoft Azure Kinect camera is shown in Figure 3. The camera array a) captures a single RGB image and a single point cloud per camera b) which is merged in regards to the positioning of the cameras by performing a rigid body transformation of the point clouds related to the designated master camera’s position (Figure 5), according to Eq. (1). The combined point cloud contains all points captured by the camera array. These are points captured not only from the composite part itself but also related to the surroundings (mounting, positioning table, etc.) and the environment (opposite cameras, respective tripods, other objects in the lab/tool shop, etc.). By the definition of a space of interest, that is, related to the composite part size and position within the camera array, captured points outside the designated space can be removed from the merged point cloud. The remaining point cloud is still very dense and must be used for meshing of the surface of composite parts. The number of points within the point cloud exceeds the number of points required for a useful mesh. A relevant mesh size can be derived from the textile characteristics, such as yarn density and yarn count, as the fiber orientation will be evaluated using the captured RGB image locally cropped onto the mesh element size. The captured point cloud density depends on the object distance from the camera. Related values are shown in Table 2.
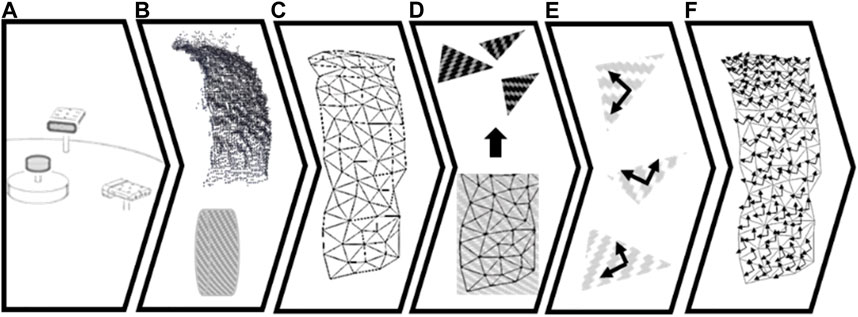
FIGURE 3. Procedure to evaluate local fiber orientation by stationary machine vision (A) camera array arrangement, (B) point cloud capture, (C) point cloud cleaning and meshing, (D) UV texture mapping, (E) evaluation of fiber orientation, and (F) assignment of fiber orientation to object mesh.
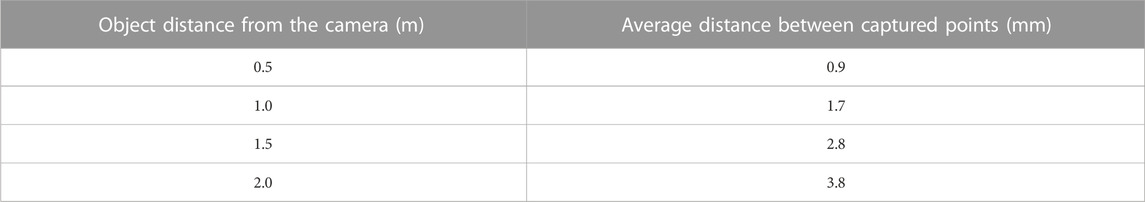
TABLE 2. Distance-related point cloud density.
Therefore, MeshLabs open API accessible by Python library PyMeshLab (Muntoni and Cignoni, 2021) was used to reduce the number of points to meet the desired mesh size (10 mm for the material introduced in Section 3.1). The simplified cloud was meshed using ball pivot meshing algorithms c), as shown in Figure 6. The meshing was performed using Python´s Open3D library (Zhou et al., 2018).
By using UV-transformation, the texture image related to every element of the generated mesh is taken from the captured RGB color image and cropped to the size of interest related to the mesh element size d). For these images, the main orientations, not in regard to fiber orientation, but in regard to color gradients within the picture, are determined e) using image processing methods, like the histogram of oriented gradients (HOG) (Lindeberg, 1998) and edge detection algorithms (Dalal and Triggs, 2005) available in Python´s Open-Source Computer Vision (OpenCV) library (Bradski, 2000). Particularly, for continuous fiber surface textures, the color gradient and the main trace of the edges correlate with the main fiber orientations (Lian et al., 2000). The established orientation vector (or several vectors when observing biaxial reinforcement textiles) must be transformed considering the positioning of the surface element toward the camera to account for tilted surfaces causing distortions in the captured image f).
With regard to the positioning of the investigable composite part, the distance to the camera is dependent on the camera´s capturing mode, narrow field of view (NFOV) or wide field of view (WFOV), as shown in Figure 4. A minimum distance of 25 cm is achievable in WFOV. However, better results have been achieved in NFOV, which also corresponds to the RGB camera´s field of view. The TOF sensor shows different sensitivities in NFOV, as shown in Figure 4B. Therefore, a distance of 50 cm from the camera has proven to be recommendable by several trial studies. The size of the structural part that is to be investigated does not necessarily need to fit in this field of view as this field can be extended by another camera. A recommendation related to a minimum size cannot be made as this has not been investigated. However, the point cloud density shown in Table 2 can be used as orientation as it indicates the sensitivity of the camera.

FIGURE 4. (A) Azure Kinect capture modes. (B) Azure Kinect capture modes and minimal distance to the object [image source: Microsoft].
This general approach is applicable to a single RGB-D camera only. However, when pursuing a stationary camera system, an increasing number of cameras forming the array improves the level of detail in the captured point cloud and increases the possibility to capture the whole structural geometry in a single shot. The low investment costs for consumer hardware cameras make this upscale considerable. Depending on the composite structural geometry, the number of cameras required for capturing all surfaces and details may vary. For very complex geometries containing undercuts or surfaces not visible to an observer from outside, this stationary approach may even be insufficient. The number of cameras may be reduced for complex geometries by using a rotatable mounting for the composite structure. This allows for captures from multiple angles by a single camera, which is ruled out in this study.
To use Microsoft Azure Kinect cameras as a camera array, a rigid transformation matrix must be set up for every slave camera to transform the captured information into the master camera coordinate system, according to Eq. (1). The rotation matrix and the transformation vector can be found by using a least-square fitting method (Arun et al., 1987). For this, a calibration pattern needs to be captured for every camera, and the specific parameters
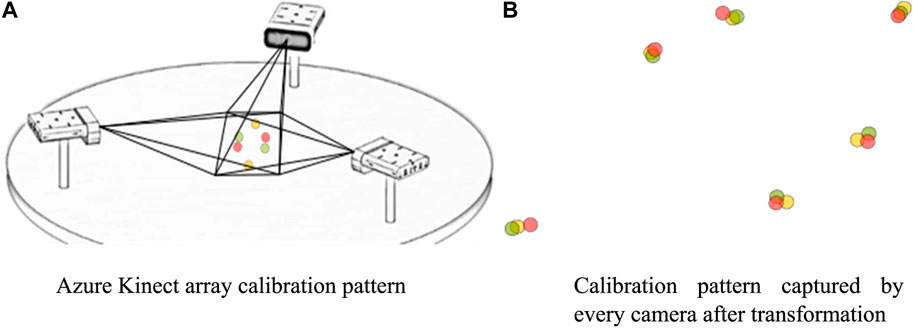
FIGURE 5. Determination of a rigid transformation matrix from the slave camera to the master camera. (A) Azure Kinect array calibration pattern. (B) Calibration pattern captured by every camera after transformation.
For converting the point cloud into a surface mesh, ball pivoting (Bernardini et al., 1999b) is used as part of the Open3D library (Zhou et al., 2018). The meshing can be adjusted by parameters to regulate the point distance and element size. An example of the result obtained from this step is shown in Figure 6.
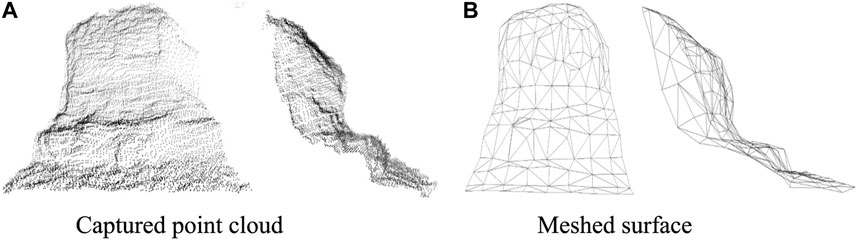
FIGURE 6. Point cloud and meshed surface derived from ball pivot meshing algorithms (Bernardini et al., 1999b). (A) Captured point cloud. (B) Meshed surface.
To map the surface texture captured by the RGB camera onto the corresponding mesh element, a pre-evaluation is conducted to determine the alignment of the elements toward the camera. The texture that is to be evaluated must not be tilted too much to guarantee a successful examination and assignment of the fiber orientation. Therefore, the element normal vector
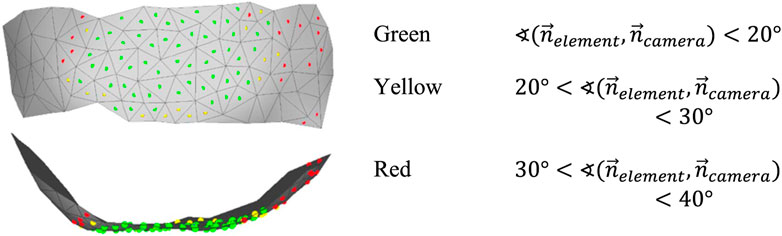
FIGURE 7. Evaluation of element orientation toward the camera.
The texture that corresponds to the location of every element must be determined by UV-transformation. In general, the captured color image is 2D, containing texture information in a UV system. The point cloud and the derived mesh exist in an XYZ-Cartesian coordinate system. By performing UV-transformation, every location in XYZ-space becomes related to the specific area in the UV image. For this, the center of the elements is used as a reference. By using the intrinsic parameters and the focal length of the camera setting (specific for every camera), the position of every point in XYZ-space can be observed on the UV image on the camera’s digital sensor, as shown in Figure 8 and explained in Eq. (2).
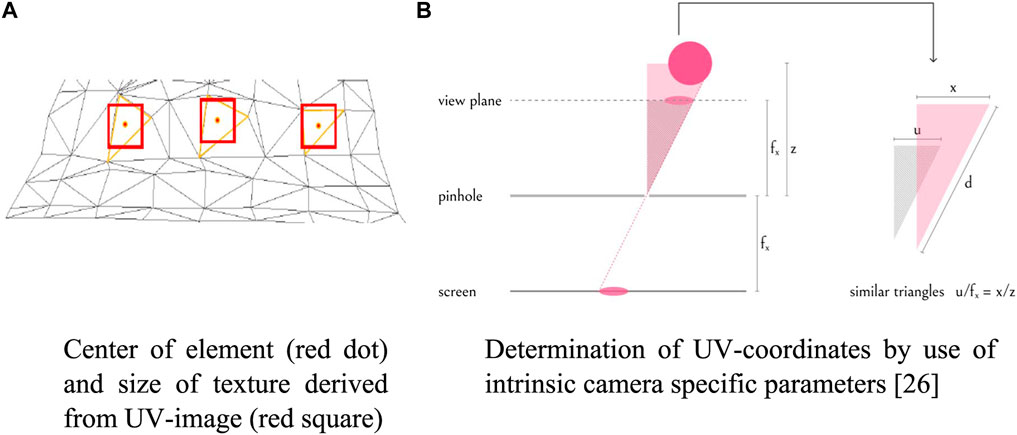
FIGURE 8. Basic parameters used in UV-transformation. (A) Center of element (red dot) and size of texture derived from the UV image (red square). (B) Determination of UV-coordinates using intrinsic camera-specific parameters (From depth map to point cloud, 2020).
The histogram of oriented gradients (HOG) is formed from feature vectors of images or image sections. In contrast to pure edge detection methods, the feature vector of the HOG primarily contains information about the color gradient in discrete directions within a certain evaluation cell. These direction vectors are displayed in a histogram or by plotting them onto the specific area of the image (Figure 9C). The HOG plot represents the main orientation of lines in the test image (Figure 9B) for every evaluation cell (Figure 9A). For textile textures, the main orientation of surface texture gradients is assumed to be in correlation with the trace of the reinforcement yarns, namely, the local fiber orientations. The orientation gradients are classified into a defined number of angles. Therefore, the number of existing main orientations can be evaluated by investigating the histogram’s local maxima. The number of local maxima corresponds to the number of local fiber systems (1—UD reinforcement, 2—weave, and 3—open reed weave). The algorithms used for the presented results are part of the OpenCV library (Bradski, 2000).
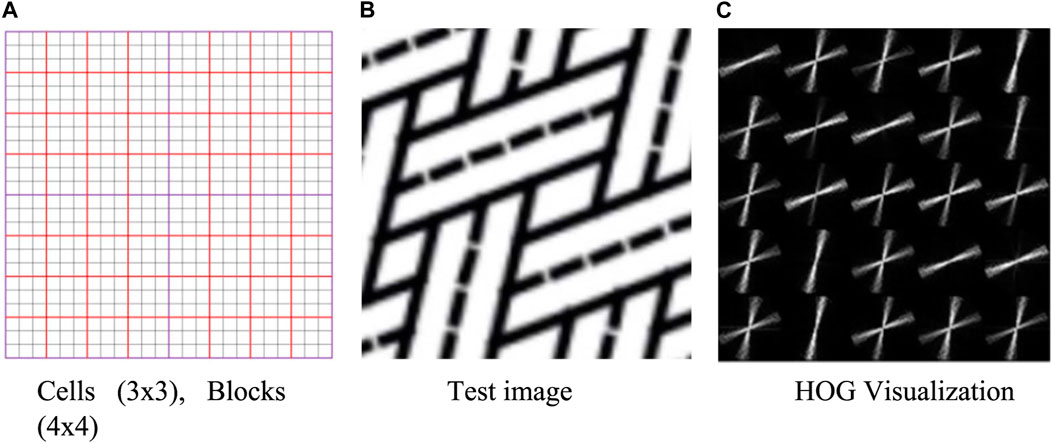
FIGURE 9. Histogram of oriented gradients. (A) Cells (3 x 3) and blocks (4 x 4). (B) Test image. (C) HOG visualization.
The evaluation of image sections captured by the Microsoft Azure Kinect camera is shown in Figures 10C, D. The quality of data that is provided by applying HOG algorithm depends significantly on the image quality. Therefore, adequate illumination (strong, diffuse) and a certain maximal distance (depending on the reinforcement rapport and yarn count) for capturing texture images are required. However, the main orientations could be evaluated successfully even for fuzzy images, but the system is also flexible in this regard that Microsoft Azure Kinect embedded RGB camera may be substituted with an even better camera to capture more detailed images of the texture in the first place. The main orientations have been determined by finding the local maxima along the histogram of orientation vectors. For the test image (Figure 10A), one main direction is assigned, whereas two directions have been found for the images showing weave textures (Figures 10B–D).
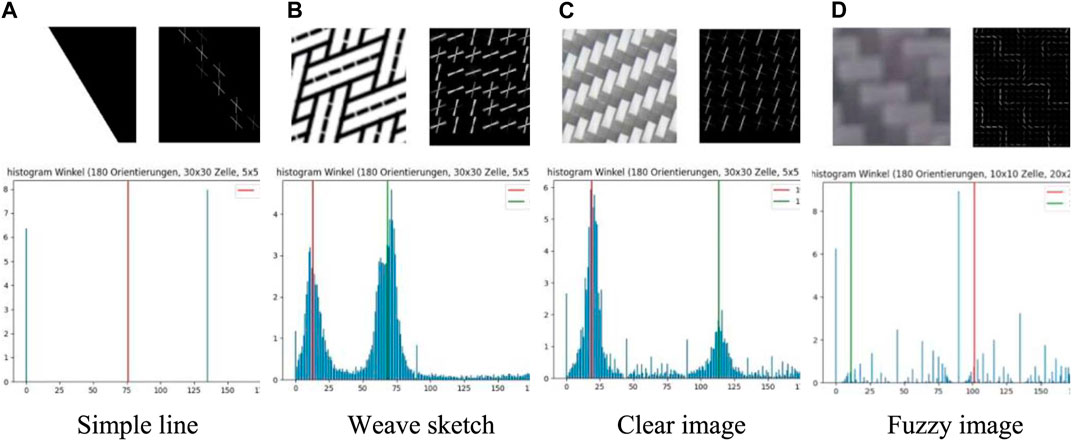
FIGURE 10. Detection of fiber orientation with an HOG descriptor. (A) Simple line. (B) Weave sketch. (C) Clear image. (D) Fuzzy image.
Figure 11 shows the result of the evaluation system. The sample geometry prepared from twill woven carbon fiber prepregs in a manual and sequential preform draping process is determined using the infrared depth sensor, and a meshed surface topology could be generated. Texture evaluation is only carried out for elements that are oriented toward the camera within the introduced tolerances. The local fiber orientations are determined by the HOG algorithm and mapped onto the discrete elements of the meshed surface. The result presented is created with a single shot and covers most of the structural surface parts visible for a single camera. The introduced algorithm has been executed on a local personal computer, although the Azure Kinect camera can be used for Microsoft Azure cloud computing services. The average duration for evaluation of a single shot performed by one camera (including all the steps shown in Figure 3) was
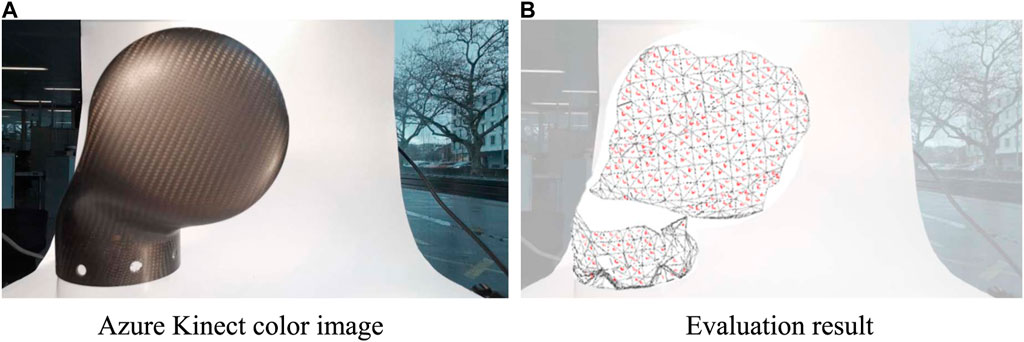
FIGURE 11. Results of the established machine vision system for assessing the composite fiber orientation. (A) Azure Kinect color image. (B) Evaluation result.
A novel machine vision approach is introduced that enables the evaluation of composite material local fiber orientation along with the corresponding location on the structure by scanning the surface texture and the geometry by utilizing RGB-D camera of consumer-grade that is capable of examining composite parts at the structural level by a single shot. The utilized cameras can be built up as a camera array that allows for a multi-shot evaluation within the same time frame as a single shot. The introduced methods are efficient for the quantification of the orientation values. The element-wise evaluation can be used directly as input for FEA simulation to carry out “as-built” numerical simulations, digitalize processes, assess the production quality, and archive production data. The low investment costs and the availability of the introduced methods by relying on open-source libraries can boost the application in the composite industry, especially for small- and middle-scale businesses, and help increase the digitalization by enabling the digital twin pre-processing of composite materials and structures. The simple, fast, and supervision-free method is suitable for mass consumer production since production processes can be observed without the handling of cameras or manually initiating the scanning process. The system mainly targets the sequential processes found in draping of complex composite structures or the stacking of reinforcement layers. In future, continuous production processes are targeted, for which the fast evaluation algorithms and the possibility to move the workload into a cloud service are beneficial. However, data-related challenges occurring when capturing, evaluating, and storing of continuous data are to be pursued.
The original contributions presented in the study are included in the article/Supplementary Material; further inquiries can be directed to the corresponding author.
Study conception, conceiving the idea, collecting data, analysis and interpretation of results, drafting the manuscript, preparation, and design: OD. Supervision of the project: CB.
The research was supported by Open Access Funding by Zurich University of Applied Sciences (ZHAW).
The authors would like to thank their Student Matthias Hansmann for his support, effort, and work toward this project.
The authors declare that the research was conducted in the absence of any commercial or financial relationships that could be construed as a potential conflict of interest.
All claims expressed in this article are solely those of the authors and do not necessarily represent those of their affiliated organizations, or those of the publisher, the editors, and the reviewers. Any product that may be evaluated in this article, or claim that may be made by its manufacturer, is not guaranteed or endorsed by the publisher.
Antoniou, A., Mikkelsen, L. P., Goutianos, S., Bagemiel, O., Gebauer, I., Flindt, R., et al. (2020). Influence of the glass non-crimp fabric intrinsic undulation on the stiffness of the composite ply: A micromechanical approach. IOP Publ. 942 (1), 012017. doi:10.1088/1757-899x/942/1/012017
Arun, K. S., Huang, T. S., and Blostein, S. D. (1987). Least-squares fitting of two 3-D point sets. IEEE Trans. pattern analysis Mach. Intell. PAMI-9 (5), 698–700. doi:10.1109/tpami.1987.4767965
Atkinson, G. A., O’Hara Nash, S., and Smith, L. N. (2021). Precision fibre angle inspection for carbon fibre composite structures using polarisation vision. Electronics 10, 2765. doi:10.3390/electronics10222765
Bardl, G., Nocke, A., Cherif, C., Pooch, M., Schulze, M., Heuer, H., et al. (2016). Automated detection of yarn orientation in 3D-draped carbon fiber fabrics and preforms from eddy current data. Compos. Part B Eng. 96, 312–324. doi:10.1016/j.compositesb.2016.04.040
Bernardini, F., Mittleman, J., Rushmeier, H., Silva, C., and Taubin, G. (1999). The ball-pivoting algorithm for surface reconstruction. IEEE Trans. Vis. Comput. Graph. 5 (4), 349–359. doi:10.1109/2945.817351
Bernardini, F., Mittleman, J., Rushmeier, H., Silva, C., and Taubin, G. (1999). The ball-pivoting algorithm for surface reconstruction. IEEE Trans. Vis. Comput. Graph. 5 (4), 349–359. doi:10.1109/2945.817351
Dalal, N., and Triggs, B. (2005). “Histograms of oriented gradients for human detection,” in Proceedings of the 2005 IEEE computer society conference on computer vision and pattern recognition (CVPR'05), San Diego, CA, USA, June 2005 (IEEE), 886–893.
Desplentere, F., Lomov, S. V., Woerdeman, D. L., Verpoest, I., Wevers, M., and Bogdanovich, A. (2005). Micro-CT characterization of variability in 3D textile architecture. Compos. Sci. Technol. 65 (13), 1920–1930. doi:10.1016/j.compscitech.2005.04.008
Döbrich, O., Anderegg, A., Gort, N., and Brauner, C. (2021). Machine vision for as-built modeling of complex draped composite structures. Materials 14 (3), 682. doi:10.3390/ma14030682
Döbrich, O., Gereke, T., and Cherif, C. (2013)., A finite element based approach for the accurate determination of the shear behaviour of textiles with the picture-frame shear test. Key Eng. Mater. 554. Trans Tech Publications Ltd, 1105–1115.
Ernst, J., Junger, S., and Tschekalinskij, W. (2016). U.S. Patent No. 9. Washington, DC: U.S. Patent and Trademark Office.
From depth map to point cloud, (2020). Published online: Map for robots. www.medium.com.
Kunze, Eckart, Schwarz, B., Weber, T., Muller, M., Bohm, R., and Gude, M. (2020). Forming analysis of internal plies of multi-layer unidirectional textile preforms using projectional radiography. Procedia Manuf. 47, 17–23. doi:10.1016/j.promfg.2020.04.110
Lekanidis, S., and Vosniakos, G. C. (2020). Machine vision support of VARI process automation in composite part manufacturing. Int. J. Mechatronics Manuf. Syst. 13 (2), 169–183. doi:10.1504/ijmms.2020.109799
Lian, B., Jiang, L., McGrath, J. J., and Jaranson, J. (2000). Quantitative determination of morphological features of triaxially braided composites by the use of machine vision. Compos. Sci. Technol. 60 (2), 159–166. doi:10.1016/s0266-3538(99)00115-3
Lindeberg, T. (1998). Edge detection and ridge detection with automatic scale selection. Int. J. Comput. Vis. 30, 117–156. doi:10.1023/a:1008097225773
Malhan, R. K., Kabir, A. M., Shembekar, A. V., Shah, B., Gupta, S. K., and Centea, T. (2018). “Hybrid cells for multi-layer prepreg composite sheet layup,” in Proceedings of the 2018 IEEE 14th International Conference on Automation Science and Engineering (CASE) (IEEE), 1466–1472.
Mersmann, C. (2011). Industrializing metrology—machine vision integration in composites production. CIRP Ann. 60 (1), 511–514. doi:10.1016/j.cirp.2011.03.056
Pasco, C., Khan, M., and Kendall, K. (2019). A novel discrete method of shear angle measurement for in-plane shear properties of thermoset prepreg using a point-tracking algorithm. J. Compos. Mater. 53 (14), 2001–2013. doi:10.1177/0021998318813193
Schommer, D., Duhovic, M., Hoffmann, T., Ernst, J., Schladitz, K., Moghiseh, A., et al. (2023). Polarization imaging for surface fiber orientation measurements of carbon fiber sheet molding compounds. Compos. Commun. 37, 101456. doi:10.1016/j.coco.2022.101456
Song, S., Jing, J., and Cheng, W. (2022). Online monitoring system for macro-fatigue characteristics of glass fiber composite materials based on machine vision. IEEE Trans. Instrum. Meas. 71, 1–12. doi:10.1109/tim.2022.3151142
Stender, S., Magura, N., Fischer, K., and Emonts, M. (2019). Function-orientated production of FRP components. Lightweight Des. Worldw. 12 (1), 18–25. doi:10.1007/s41777-018-0065-1
Wilhelmsen, C. A., and Ostrom, L. T. (2016). IEEE, 316–322.Remote aircraft composite inspection using 3D imagingProceedings of the 2016 9th International Conference on Human System Interactions (HSI)July 2016. Portsmouth, UK
Keywords: machine vision, composite, digital twin, modeling, finite element analysis
Citation: Döbrich O and Brauner C (2023) Machine vision system for digital twin modeling of composite structures. Front. Mater. 10:1154655. doi: 10.3389/fmats.2023.1154655
Received: 30 January 2023; Accepted: 14 March 2023;
Published: 30 March 2023.
Edited by:
Baris Caglar, Delft University of Technology, NetherlandsReviewed by:
Masoud Bodaghi, Luxembourg Institute of Science and Technology (LIST), LuxembourgCopyright © 2023 Döbrich and Brauner. This is an open-access article distributed under the terms of the Creative Commons Attribution License (CC BY). The use, distribution or reproduction in other forums is permitted, provided the original author(s) and the copyright owner(s) are credited and that the original publication in this journal is cited, in accordance with accepted academic practice. No use, distribution or reproduction is permitted which does not comply with these terms.
*Correspondence: Oliver Döbrich, b2xpdmVyLmRvZWJyaWNoQHpoYXcuY2g=
Disclaimer: All claims expressed in this article are solely those of the authors and do not necessarily represent those of their affiliated organizations, or those of the publisher, the editors and the reviewers. Any product that may be evaluated in this article or claim that may be made by its manufacturer is not guaranteed or endorsed by the publisher.
Research integrity at Frontiers
Learn more about the work of our research integrity team to safeguard the quality of each article we publish.