 Konrad Rienesl
 Philipp S. Stelzer1
 Zoltán Major
 Chih-Chung Hsu
 Li-Yang Chang
 Kepa Zulueta
- 1Institute of Polymer Product Engineering, Johannes Kepler University, Linz, Austria
- 2Moldex3D CoreTech System Co., Ltd, Hsinchu, Taiwan
- 3Leartiker S. Coop., Markina-Xemein, Bizkaia, Spain
Injection molded short fiber reinforced components reveal a sound light weight potential with moderate costs and thus are widely used in many demanding engineering applications. The accurate determination of the fiber orientation (FO) is essential for predicting the overall mechanical behavior of discontinuous (short or long, with varying aspect ratio) fiber reinforced composites. The simulation of the FO requires a proper modeling of the hydrodynamics, the closure transformation of the FO tensor and optionally the application of specific correction functions. The determination of parameters for the fiber orientation models commonly used in injection molding simulations is a challenging task because they cannot be determined directly in experiments. Hence, a novel way is shown in our paper to derive these parameters faster, more efficiently and accurately by the usage of an automated metamodel optimization. For this, injection molding simulations were performed iteratively by an optimization program until a minimal deviation error of the simulated parameters was reached. The optimization was performed based on proper computed tomography FO data of selected regions of interest. The new approach was tested for a rotationally symmetric Venturi tube geometry made from short glass fiber reinforced polyamide (PA-GF). The fiber orientation distribution models chosen were the iARD-RPR equation with 3 parameters and the novel anisotropic IISO equation with 5 parameters. It was shown that the optimization method is feasible for the calibration of fiber orientation models. Furthermore, the IISO equation with its 2 additional parameters allowed a more accurate prediction of the fiber orientation distribution, especially of the core layer of the injection molded part.
1 Introduction
Due to their anisotropy, injection molded short fiber-reinforced plastics (SFRPs) show a complex mechanical behavior. The accurate determination of the fiber orientation (FO) is essential for predicting the overall mechanical behavior of discontinuous (short or long, with varying aspect ratio) fiber reinforced composites.
To cope with the problem of the complexity of the fiber orientation and the loading conditions of SFRP materials and corresponding components a complexity map was generated and is shown in Figure 1. The complexity of the geometry and fiber orientation as well as the complexity of the relevant loading conditions are the axes of the diagram.
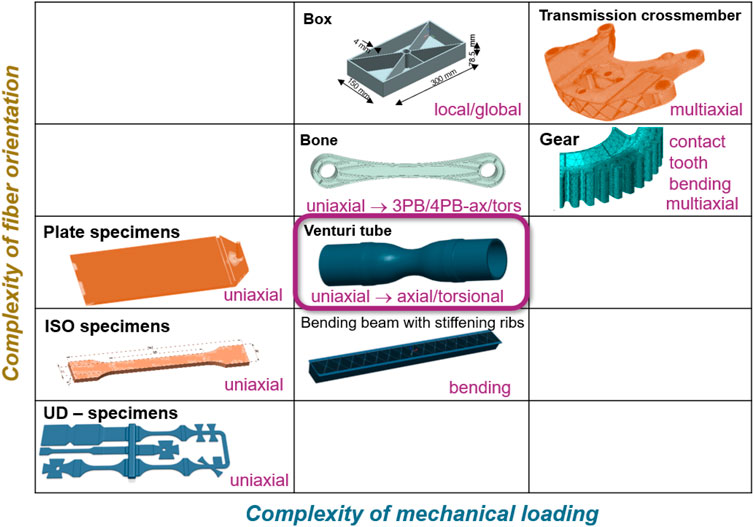
FIGURE 1. Complexity map for injection molded short fiber reinforced specimens and composites.
To gain more insight into our overall methodology for SFRP components, the laboratory specimens and model as well as real industrial components were designed, produced and used in our investigations. To improve the perceptiveness these are positioned in this diagram where three main regimes can be identified.
• Low complexity: laboratory specimens, UD-specimens
• Medium complexity: components designed for supporting simulation efforts (bone, Venturi tube, Doka box, A-K part)
• High complexity: transmission cross member, gear
The integrative simulation methodology was successfully applied in the past for prediction the mechanical behavior of injection molded SFRP components (Adam and Assaker, 2014; Doghri et al., 2021). This methodology consists of the simulation of the injection molding process to predict the fiber orientation and fiber length distribution, the micromechanical modelling of the microstructure using proper material model for the matrix and also for the fiber/matrix interface and the structural simulation of the macroscopic component behavior.
The injection molding simulation requires a model which properly predicts the fiber orientation. These models consist typically of equations which use a hydrodynamic description of the flow field, a closure approximation of the fourth-order FO tensor, specific correction functions and parameters which vary from material to material.
The verification of the FO of the part at the end of the filling stage of the simulation necessitates FO measurement on produced parts via proper microscopic analysis or by computed tomography images. The latter is widely used in many scientific and engineering investigations and recently became a quasi-standardized tool for the verification (Salaberger et al., 2011; Quintana et al., 2020). Due to the existing previously verified results, the Venturi tube was selected for further analysis in this paper. The previous work using the 3-parameter iARD-RPR equation and a factorial design of experiment was performed and published by (Quintana et al., 2020).
With its thin wall thickness, rotational symmetry and circumferential gate, the Venturi tube inhibits a characteristic fiber orientation distribution which is mainly in flow and circumferential direction. It is especially suitable as its change in diameter and thickness leads to a diverse flow field which helps to determine the parameters for general applications. The CAD geometry and a selected sample of an injection molded Venturi tube along with gate system are shown in Figure 2.
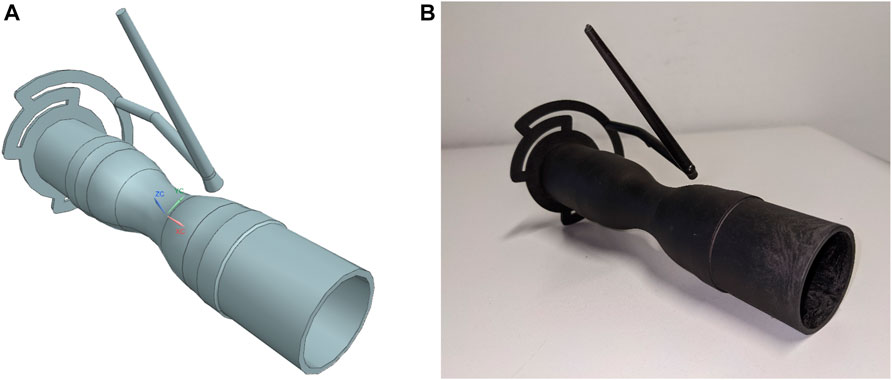
FIGURE 2. The Venturi tube with gate as CAD model (A) and after production (B).
The Venturi tube specimen was designed to represent a specific biaxial initial stress state. We are going perform axial (tension/compression) and torsion tests under both monotonic and cyclic test conditions. To apply micromechanical models for the proper characterization of the mechanical behavior the Venture tube the accurate determination of the fiber orientation is essential. Hence, with reference to our previous paper, the objectives of this paper are.
• Improved prediction of the FO using IISO model for anistropic viscosity with 5 parameters
• Introduction of the optimization procedure for determining the fiber orientation model parameters mentioned above
• Comparison of the IISO results with the results of the previous paper by (Quintana et al., 2020) which were generated with the simpler iARD-RPR model
To establish a solid background for the first objective of the paper a short overview about the evolution/development of the FO models will be provided. Then, this paper introduces in the second part a practical application of a novel optimization methodology to determine the parameters necessary for the fiber orientation by using an optimal experiment design which is executed automatically and iteratively by a self-developed software tool. The fiber orientation of specimen was determined and verified at 3 locations (see Figure 3).
• the curvature near to the gate
• in the minimum cross-section in the center
• in the curvature far from the gateInjection molding simulations with several parameter values were then performed until the difference between experimental measurement or simulation output was small enough or a predefined number of iterations was reached. Finally, the new results are compared with the results of the previous paper using the same injection molding model with and without parameter optimization and using the novel anisotropic viscosity model with optimization.
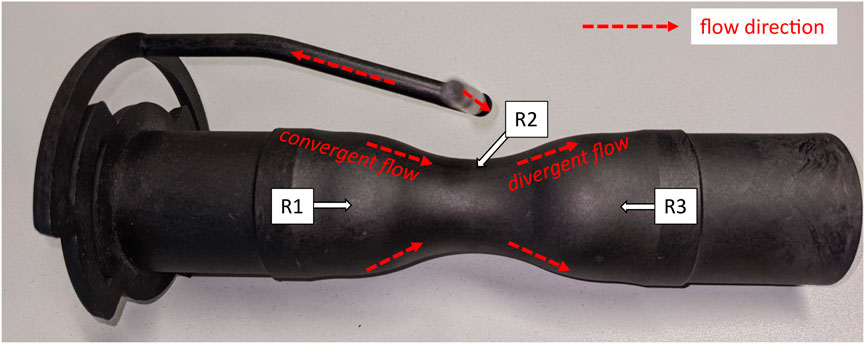
FIGURE 3. Flow directions and location of regions of interest (RoI) for fiber orientation evaluation.
2 Theory
2.1 Short overview of the existing predictive fiber orientation models
The filling of an injection molding cavity is a highly transient flow process. Hence, a representation of the change of the fiber orientation tensor over time is necessary to numerically predict the fiber orientation of the finished part. This is done with its material derivative, which is denoted as
Jeffery pioneered with a hydrodynamics model for the motion of rigid elliptical rods immersed in dilute Newtonian solutions Jeffery (1922). This model can be reformulated for the change of the fiber orientation tensor
It is dependent on the vorticity tensor W, the rate of deformation tensor D (which describe the flow field) and the shape factor ξ:
which can be derived with the aspect ratio of the particles ar. For a cylindrical fiber the aspect ratio is defined as the ratio of its length over its diameter.
The fourth order tensor A4 which is defined as
cannot be calculated directly and has to be approximated with orthogonal closure methods.
Jeffrey’s hydrodynamics model does not consider fiber-fiber interactions, which become relevant for highly-filled polymer solutions.
The Isotropic Rotary Diffusion Model (IRD) was developed by Folgar and Tucker (1984) and can be formulated as:
where I is the identity matrix, the scalar
Tseng et al. (2016) further improved the Folgar-Tucker models by introducing the Improved Anisotropic Rotary Diffusion (iARD) model in combination with a Retarding Principal Rate (RPR). The iARD model expands the Rotary Diffusion term from the Folgar-Tucker model with an anisotropic steric barrier (SB) term to consider fiber-matrix interactions:
Adding a term with Retarding Principal Rate (RPR), the complete iARD-RPR model with three parameters is defined as:
Up to this point all fiber orientation models are dependent on the flow field, but not vice versa. In the works of Tseng et al. (2017b); Favaloro et al. (2018), the Informed Isotropic (IISO) viscosity ηIISO is introduced as:
Recently, (Tseng and Favaloro et al., 2019) developed the revised IISO equation which describes the coupling of flow field and fiber orientation.
with ηs as the shear viscosity calculated from the flow field, RT as the dimensionless Trouton ratio parameter (which is dependent on the shear rate
All of the above models assume that the fiber concentration does not change during the filling phase and is uniform in the finished part. Furthermore, the effects of fiber breakage are usually neglected in injection molding simulations and the shape factor used in fiber orientation models (Eq. 3) is not sensitive to changes in fiber length for the high aspect ratios of the fibers used in SFRPs.
To the best knowledge of the authors, there exist no feasible measurement methods to measure any fiber orientation parameters directly from experiments with the exception for the interaction parameter CI. Some empirical relationships were estimated for the fiber aspect ratio, fiber volume fraction and the shear rate Nguyen Thi et al. (2014); Phan-Thien et al. (2002).
Non-etheless, in the past, the fiber orientation model parameters were either chosen based on experience or determined via trial-and-error and/or optimization. The iARD-RPR model was successfully applied using these methods, for example, in Foss et al. (2014); Gao et al. (2022); Reitinger et al. (2020); Caton-Rose et al. (2012); Tseng et al. (2017a, 2018) and the IISO model in Huang and Lai (2020).
2.2 Parameter estimation with metamodels
Numerical simulations can be viewed abstractedly as black boxes where certain parameters are put into, which are then - with a range of complex calculations performed inside - transformed into an output response. A metamodel is an abstraction of such a simulation trying to replicate its input-output behavior with a simpler analytical description. The advantage of a metamodel lies in the increased calculation speed and mathematical practicability. A useful way to calibrate a model, which describes a material’s property, is to build such a metamodel with a set of input-output relations derived from numerical simulation. With the help of optimization algorithms, the metamodel is refined until the simulation output is close to experimental measurement values. This requires however a careful selection of the reference ranges of interest (RoI) in the specimens and the proper experimental determination of the FO. For latter the procedures of Fachhochschule Wels, Austria (Kastner et al., 2012; Salaberger, 2019; Stelzer et al., 2022) were applied.
The combination of these two procedures allows for the determined of optimal material model parameters for the injection molded simulations.
The optimization cycles can be performed in specialized programs such as LS-Opt (Livermore Software Technology Corporation, 2019). They are usually structured as followed.
• First, a Design of Experiment (DoE) is defined, where certain combinations of parameter values (called points or design variables) are chosen to build the metamodel. The parameters are sampled using a D-optimal design.
• Then, these parameter combinations are used as input for a solver, e.g. a simulation program. After the simulations have finished, the program uses the output to build a metamodel consisting of response surfaces. The domain of the design space is narrowed around the optimal solution, a new set of input points determined and the cycle starts again.
• The optimization problem is solved when the target is reached, i.e. the deviation between simulation output and empirical measurements is minimized.
3 Materials and methods
3.1 Experiment
The Venturi tube parts were injection molded at Leartiker in Markina-Xemein in Spain with the settings from Table 1. The material Akulon K224 HG8 is a heat-stabilized polyamide filled with 40 percent by weight short glass fibers which is manufactured by DSM Engineering Materials.
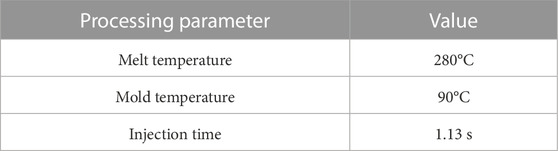
TABLE 1. Processing conditions of the Venturi tube.
Three samples of size 5 mm × 5 mm were cut from regions R1, R2 and R3 of a produced tube (see Figure 3). The fiber orientation distributions of the samples were measured with the micro-CT xray technique using a GE Phönix X-ray Nanotom 180 NF. The effective measurement volumes were 4 mm × 4 mm x 2.5 mm for regions R1 and R3 and 4 mm × 4 mm x 1 mm for region R2. A more detailed description of the procedure can be found in Quintana et al. (2020); Emerson et al. (2017); Salaberger (2019).
3.2 Simulation
The injection molding simulation was created and performed in Moldex3D Studio 2022 (developed by CoreTech System Co., Ltd., ChuPei City, Taiwan). Therefore the processing parameters were set according to Table 1. A material card of the used polyamide (containing viscosity, heat capacity, etc.) was available in the internal material database and its models were added to the supplementary material of this publication.
The mesh of the runner consisted of tetrahedral elements while tube was meshed with a Boundary Layer Mesh (BLM) which is a mixture of prismatic and tetrahedral elements (see Figure 4). This creates a multilayered mesh which provides a resolution high enough to cover all significant changes in fiber orientation in through-thickness direction.
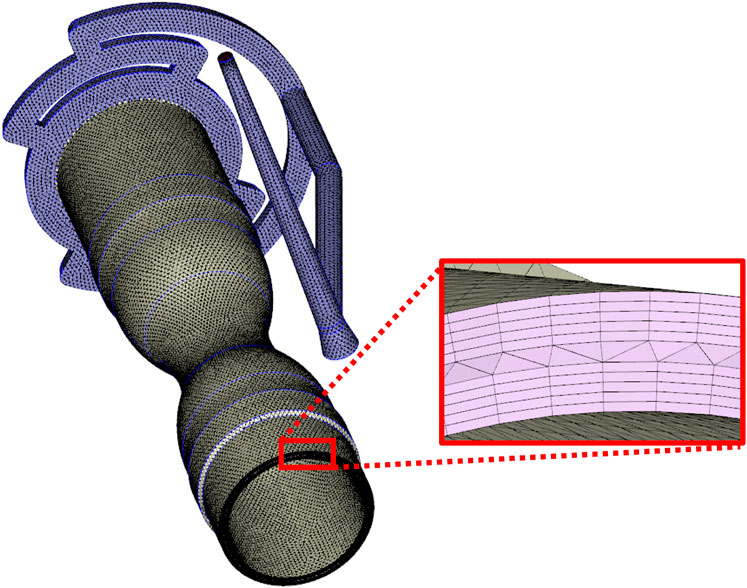
FIGURE 4. Detail of the meshed Venturi tube geometry (blue: runner, yellow: part).
This type of mesh is generated by the program by first creating a triangular surface mesh and then generating a defined number of boundary layers of prismatic elements in thickness direction. The remaining space along the midplane is filled with tetrahedral elements. Thus, a mesh with a total of 10 layers with hexahedral elements and a center layer with tetrahedral elements was created (see Table 2). The high number of nodes across the thickness was deemed as necessary to take the substantial variation of the fiber orientation into account.

TABLE 2. Mesh properties.
A Python script interacting with the Moldex3D API (Application Program Interface)—which allows to start simulation runs with defined fiber orientation parameters remotely–was written (Figure 5). This script acts as a bridge between the optimization program LS-Opt and the simulation program Moldex3D. It passes the fiber parameters of the optimization cycle to the simulation run and extracts the results after the simulation has finished.
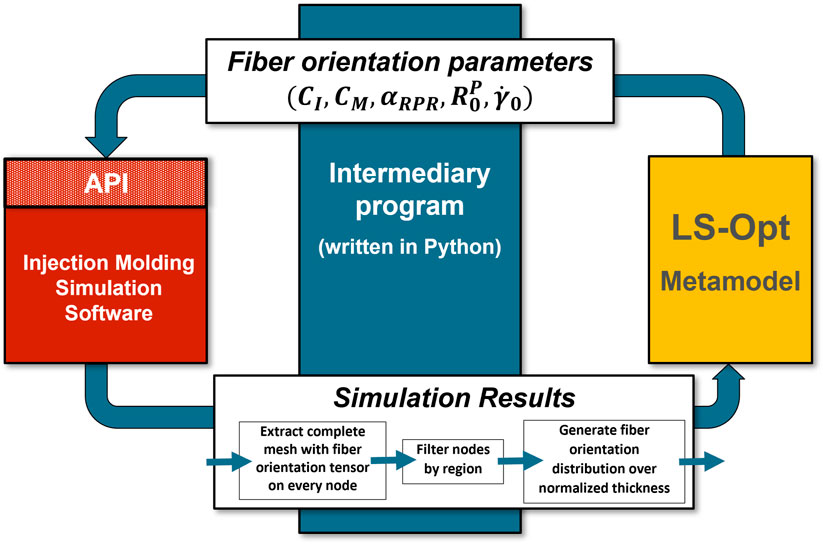
FIGURE 5. Tasks of the intermediate Python program.
First, constraints (i.e., min and max. boundaries) for all fiber orientation parameters are defined and thus create the initial design space (Table 3). A D-optimal design is generated consisting of a prescribed number of parameter sets called sampling points or design variables. Injection molding simulations are then performed consecutively in Moldex3D, with one parameter set after the other inserted into the respective fiber orientation model. After that, the results of the simulations are approximated with a first-order polynomial metamodel consisting of linear response surfaces.
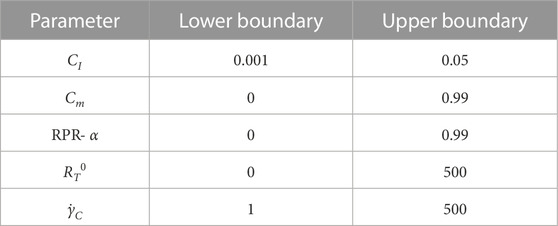
TABLE 3. Initial design space of fiber orientation parameters.
An optimal set of fiber orientation model parameters is then determined with a suitable hybrid optimization algorithm - ASA (Adaptive Simulated Annealing, global) combined with LFOP (Leap Frog Optimization, gradient-based)—with the objective of minimizing the mean error between the simulation and the CT measurements. If convergence or the max. number of iterations is not reached, the size of the design space is narrowed via the Strategy Sequential with Domain Reduction method (SRSM) and a new iteration commenced with a new D-optimal design.
This optimization approach was used similarly in several other publications for material model calibrations and other applications Camberg et al. (2021); Raffler (2016); Banerjee et al. (2022); Cheng et al. (2019); Passarello (2018). An overview of the complete cycle to determine the optimal fiber orientation parameters can be seen in Figure 6. Thorough explanation of all algorithms can be found in the LS-Opt manual Livermore Software Technology Corporation (2019).
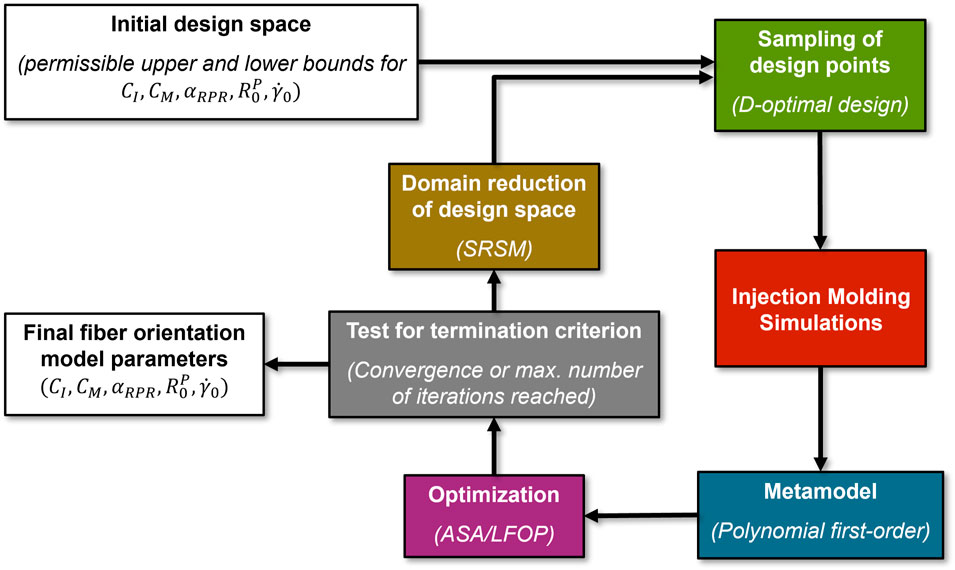
FIGURE 6. Graphical representation of the simulation methodology including the optimization cycle.
The complete optimization cycle consisted of 6 iterations with 6 runs each, which totals in 36 simulation runs. Using the resulting and final metamodel an optimal set of parameters was determined.
When choosing the appropriate regions and their weightings which constitute the optimization objective, the intended application of the Venturi tube was considered. During torsional testings the central region R2 bears most of the load. Hence, optimizations were performed on the central region R2 for the 5 and 3 parameter model to purposefully represent the orienting behavior of the fibers subjected to the flowing conditions occurring in this area (thin-walled and high flowing speed). If the fiber orientation model with its optimized parameters predicts the fiber orientation of the cut-out specimen R2 correctly, we can expect the fiber orientation around this area (the neck of the Venturi tube) in the simulation is also sufficiently accurate. Hence, the geometry (with the extracted fiber orientation) can then be used to perform structural simulations of the torsional tests.
However, it is assumed that the fiber orientation model actually describes an inherent material property which is valid regardless of geometry and processing conditions. For this reason, an additional optimization cycle with 50% weight on R2 and 25% each on the outer regions R1 and R3 (see Figure 3) was performed. This approach also takes the converging and diverging flow sections of the part into account and represents the flowing conditions during injection molding more universally.
For each of the above cases an averaged fiber orientation tensor was calculated with the final optimum. To ensure a reasonable comparison, an additional simulation with the parameters from Quintana et al. (2020) was performed with the new BLM mesh.
4 Results
A qualitative representation of the fiber orientation distribution in flow direction (pointing from the entrance to the end) of the Venturi tube can be seen in Figure 7. The greater degree of orientation in the neck of the tube is clearly visible (orange color).
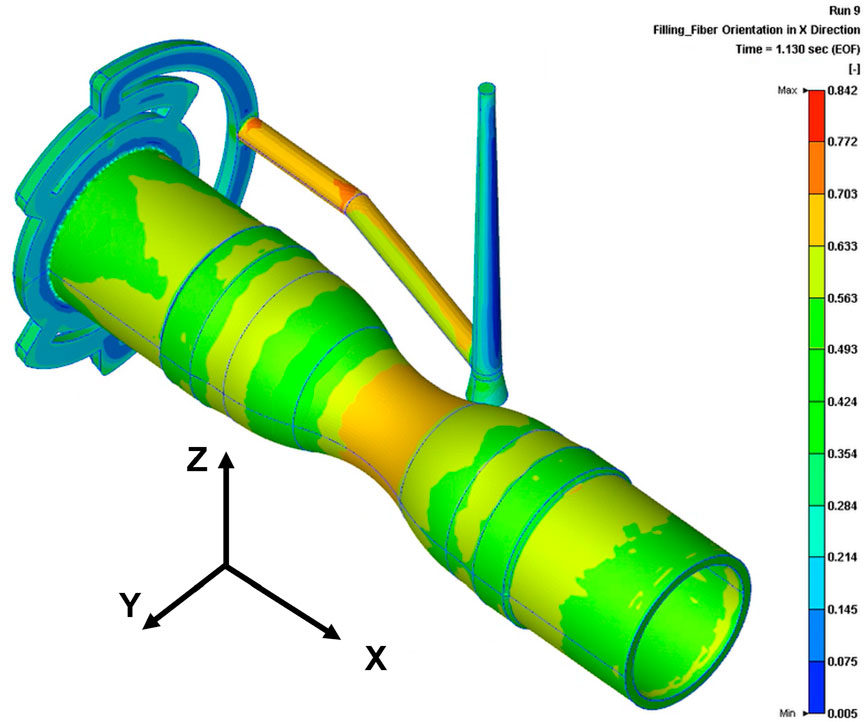
FIGURE 7. Fiber orientation distribution in X-direction (in-flow) at end of filling.
The optimized model parameters are listed for the three model variations (5 parameter IISO model and 3 parameter iARD-RPR model) in Table 4 for the selected RoI’s. Figures 8, 9, 10 show the fiber orientation distributions for these cases. While the distributions match quite well for the center region R2, larger deviations can be seen for the outer regions R1 and R3. Furthermore the simulation results indicate that the difference of FO in flowing direction between the shell/skin layer and core layer is much better represented by using the automatically optimized parameters.
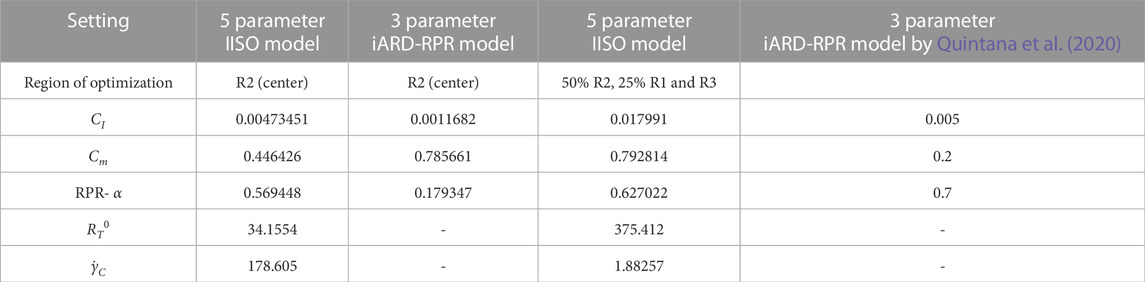
TABLE 4. Optimal parameters after the Venturi tube optimization.
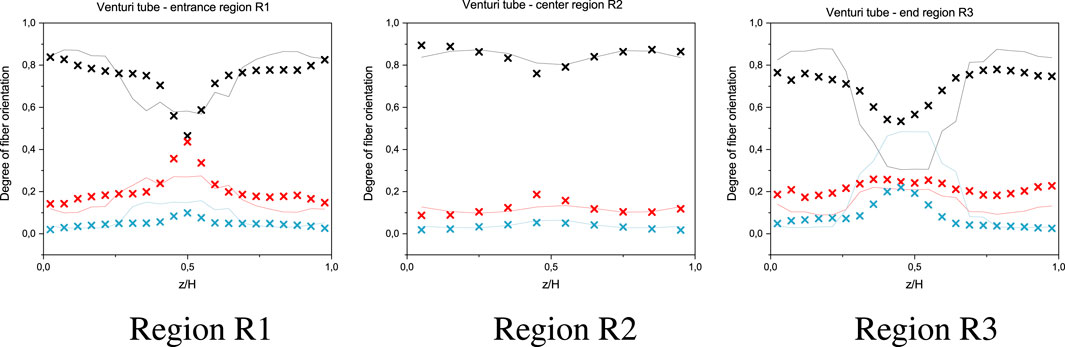
FIGURE 8. Fiber orientation distributions using the IISO-model with 5 parameters optimized for R2 (center) X: CT measurements, lines: simulation results, fiber orientation directions: black: xx (in-flow), red: yy (across flow), teal: zz (through-thickness).
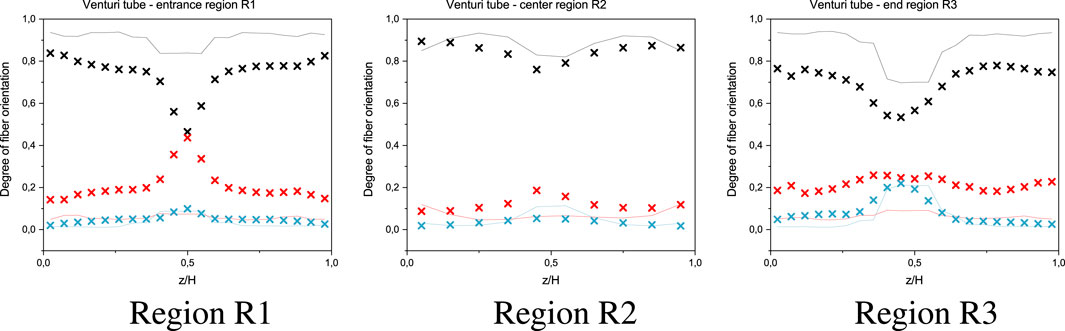
FIGURE 9. Fiber orientation distributions using the iARD-model with 3 parameters optimized for R2 (center) X: CT measurements, lines: simulation results, fiber orientation directions: black: xx (in-flow), red: yy (across flow), teal: zz (through-thickness).
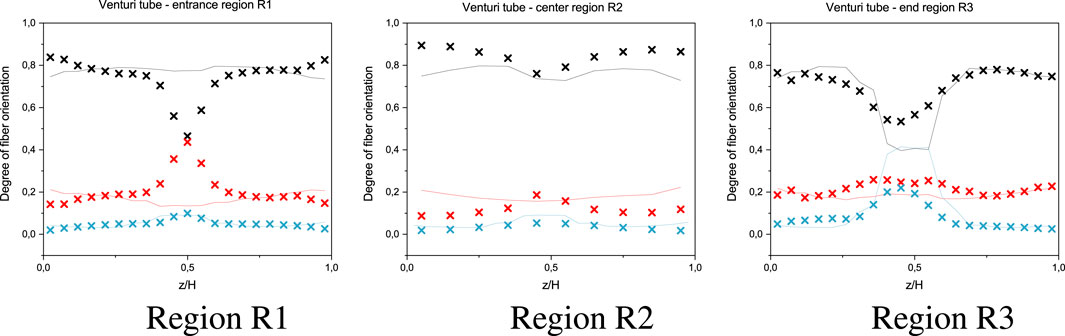
FIGURE 10. Fiber orientation distributions using the IISO-model with 5 parameters with optimization weighted by region (25% R1, 50% R2, 25% R3) X: CT measurements, lines: simulation results, fiber orientation directions: black: xx (in-flow), red: yy (across flow), teal: zz (through-thickness).
Figure 11 shows the fiber orientation distribution using the iARD-RPR model with 3 parameters which were determined via a factorial design by Quintana et al. (2020).
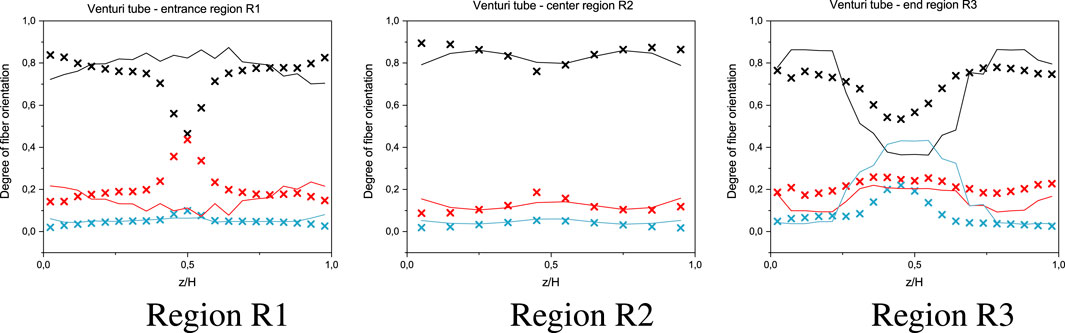
FIGURE 11. Fiber orientation distributions using the iARD-RPR-model with 3 parameters derived by Quintana et al. (2020) X: CT measurements, lines: simulation results, fiber orientation directions: black: xx (in-flow), red: yy (across flow), teal: zz (through-thickness).
The exact fiber orientation distribution values for all measurements and simulations can be found in Table 5. The quantitative comparison of the CT measurements with the various simulation results is shown in Table 6.
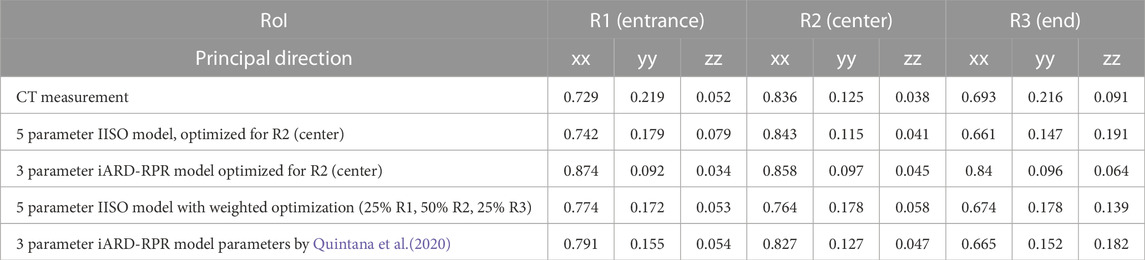
TABLE 5. Fiber orientation values after the Venturi tube optimization.
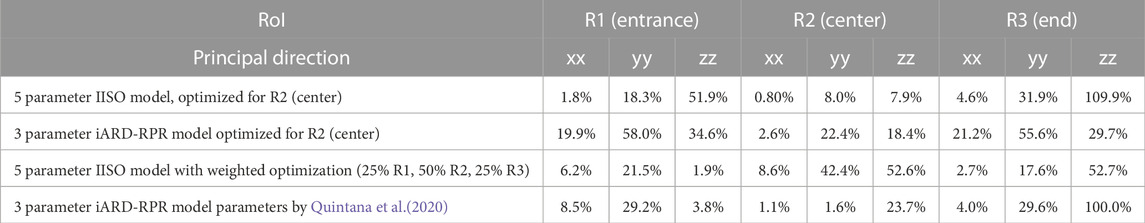
TABLE 6. Deviations between fiber orientation tensors of CT measurements and injection molding simulations.
Ultimately, the accuracy of the fiber orientation distribution can significantly be improved by using the anisotropic IISO model with 2 additional parameters in comparison to the iARD-RPR model and the derivation of these parameters via iterative optimization. The focus on solely one region for optimizing is at the expense on the accuracy of the other regions. The case with optimization weights by region led to a more balanced result.
5 Summary and conclusion
A novel method to derive the optimal fiber orientation parameters for a short fiber rein-forced polymer was developed and implemented. It calibrates the respective material model by performing injection molding simulations with varying sets of parameters automatically until the difference to micro-CT FO measurements in 3 RoI’s is minimized. The fiber orientation parameters of a polyamide filled with short glass fibers were then determined by applying this method on an existing injection molded part. This part - the Venturi tube - was chosen for its diverse flowing conditions which made the resulting fiber orientation parameters universally applicable. The final simulation results show good agreement with the CT measurements with increased accuracy in regions which higher weights in the optimizations. In comparison, with the manual fiber orientation parameter determination performed previously by Quintana et al. (2020) similar or even better results could be achieved. Furthermore, the simulations using the IISO equation with its additional parameters proved to represent the FO distribution more accurately, especially in the core layer of the part. Thus, structural simulations may also benefit from these findings because the local mechanical properties - which are strongly influenced by the anisotropy of the material—can be better assessed with prior FO predictions using the IISO model with optimized parameters.
Possible improvements may be achieved by increasing the resolution of the CT measurements and the evaluation of scatter by performing measurements on multiple specimens. Consequently, the methodology developed can and will be used for further materials, specimens and component geometries (e.g., Figure 1). Furthermore, the problem could be assessed with a probabilistic predictive framework using Bayesian inference to yield the maximum of useful information derived from a limited number of CT measurements and simulations.
Data availability statement
The raw data supporting the conclusion of this article will be made available by the authors, without undue reservation.
Author contributions
KR and PS contributed to the conception and design of the experiments. KR performed the simulations and developed the intermediary program. C-CH and L-YC contributed to the numerical software development. KR wrote the first draft of the manuscript. ZM wrote sections of the manuscript. All authors contributed to manuscript revision, read, and approved the submitted version.
Funding
This research was funded by the Austrian Federal Ministry of Climate Action, Environment, Energy, Mobility, Innovation and Technology (BMK), the Austrian Federal Ministry of Transport, Innovation and Technology and the Austrian Research Promotion Agency (FFG) within the framework of the projects CARBOBRAKE (M-ERA.NET and “Produktion der Zukunft,” grant number 889149) and CAR e-Bo (“Mobility of the Future,” grant number 865213). Support was also received from the National Research, Development and Innovation Fund of Hungary, financed under the 2020-4.1.1-TKP2020 funding scheme (Project no. TKP2020-NKA-04).
Conflict of interest
C-CH and L-YC were employed by Moldex3D CoreTech System Co., Ltd. KZ was employed by Leartiker S. Coop.
The remaining authors declare that the research was conducted in the absence of any commercial or financial relationships that could be construed as a potential conflict of interest.
Publisher’s note
All claims expressed in this article are solely those of the authors and do not necessarily represent those of their affiliated organizations, or those of the publisher, the editors and the reviewers. Any product that may be evaluated in this article, or claim that may be made by its manufacturer, is not guaranteed or endorsed by the publisher.
Supplementary material
The Supplementary Material for this article can be found online at: https://www.frontiersin.org/articles/10.3389/fmats.2023.1152471/full#supplementary-material
References
Adam, L., and Assaker, R. (2014). “Integrated nonlinear multi-scale material modelling of fiber reinforced plastics with digimat: Application to short and continuous fiber composites,” in Proceedings of the 11th World Congress on Computational Mechanics, 20–25.
Advani, S. G., and Tucker, C. L. (1987). The use of tensors to describe and predict fiber orientation in short fiber composites. J. Rheology 31, 751–784. doi:10.1122/1.549945
Banerjee, D. K., Luecke, W. E., Iadicola, M. A., and Rust, E. (2022). Evaluation of methods for determining the yoshida-uemori combined isotropic/kinematic hardening model parameters from tension-compression tests of advanced lightweighting materials. Mater. Today Commun. 33, 104270. doi:10.1016/j.mtcomm.2022.104270
Camberg, A. A., Tröster, T., and Latuske, C. (2021). “Development of a hybrid crash-relevant car body component with load-adapted thickness properties: Design, manufacturing and testing,” in Technologies for economic and functional lightweight design. Editors K. Dröder, and T. Vietor (Berlin, Heidelberg: Springer Berlin Heidelberg).
Caton-Rose, F., Hine, P., Costa, F., Jin, X., Wang, J., and Parveen, B. (2012). “Measurement and prediction of short glass fibre orientation in injection moulding composites,” in Proceedings of the 15th European Conference on Composite Materials, Venice, Italy.
Cheng, W., Outeiro, J., Costes, J.-P., M’Saoubi, R., Karaouni, H., and Astakhov, V. (2019). A constitutive model for ti6al4v considering the state of stress and strain rate effects. Mech. Mater. 137, 103103. doi:10.1016/j.mechmat.2019.103103
Doghri, I., Lemoine, G., Martiny, P., Mathieu, S., Wucher, B., and Adam, L. (2021). Multiscaling-based integrated computational materials engineering: From academia to industry. Int. J. Multiscale Comput. Eng. 19, 1–40. doi:10.1615/IntJMultCompEng.2021040073
Emerson, M. J., Jespersen, K. M., Dahl, A. B., Conradsen, K., and Mikkelsen, L. P. (2017). Individual fibre segmentation from 3d x-ray computed tomography for characterising the fibre orientation in unidirectional composite materials. Compos. Part A Appl. Sci. Manuf. 97, 83–92. doi:10.1016/j.compositesa.2016.12.028
Favaloro, A. J., Tseng, H.-C., and Pipes, R. B. (2018). A new anisotropic viscous constitutive model for composites molding simulation. Compos. Part A Appl. Sci. Manuf. 115, 112–122. doi:10.1016/j.compositesa.2018.09.022
Folgar, F., and Tucker, C. L. (1984). Orientation behavior of fibers in concentrated suspensions. J. Reinf. Plastics Compos. 3, 98–119. doi:10.1177/073168448400300201
Foss, P. H., Tseng, H.-C., Snawerdt, J., Chang, Y.-J., Yang, W.-H., and Hsu, C.-H. (2014). Prediction of fiber orientation distribution in injection molded parts using moldex3d simulation. Polym. Compos. 35, 671–680. doi:10.1002/pc.22710
Gao, R., Chen, H., Hu, Z., Cheng, X., Gao, S., Zhou, S., et al. (2022). An integrated simulation method for analyzing mechanical properties of injection molded fiber–reinforced polymers. Polym. Compos. 43, 4530–4543. doi:10.1002/pc.26710
Huang, C.-T., and Lai, C.-H. (2020). Investigation on the coupling effects between flow and fibers on fiber-reinforced plastic (frp) injection parts. Polymers 12, 2274. doi:10.3390/polym12102274
Jeffery, G. B. (1922). The motion of ellipsoidal particles immersed in a viscous fluid. Proc. R. Soc. Lond. Ser. A 102, 161–179. doi:10.1098/rspa.1922.0078
Kastner, J., Plank, B., Reh, A., Salaberger, D., and Heinzl, C. (2012). “Advanced x-ray tomographic methods for quantitative characterization of carbon fibre reinforced polymers,” in Proc. of 4th International Symposium on NDT in Aerospace, Augsburg, Germany, Nov 13-14, 1–9.
Livermore Software Technology Corporation (2019). Ls-opt\circledR user’s manual. Livermore: Livermore Software Technology Corporation.
Nguyen Thi, T. B., Yokoyama, A., Ota, K., Kodama, K., Yamashita, K., Isogai, Y., et al. (2014). Numerical approach of the injection molding process of fiber-reinforced composite with considering fiber orientation. AIP Conf. Proc. 1593, 571–577. American Institute of Physics. doi:10.1063/1.4873846
Passarello, M. (2018). Parameter identification on a carbon-fiber reinforced polymer using LS-OPT. Turin: Politecnico di Torino. Master’s thesis.
Phan-Thien, N., Fan, X.-J., Tanner, R. I., and Zheng, R. (2002). Folgar–tucker constant for a fibre suspension in a Newtonian fluid. J. Newt. Fluid Mech. 103, 251–260. doi:10.1016/S0377-0257(02)00006-X
Quintana, M. C., Frontini, P. M., Arriaga, A., Plank, B., and Major, Z. (2020). Fiber orientation distribution predictions for an injection molded venturi-shaped part validated against experimental micro-computed tomography characterization. Front. Mater. 7. doi:10.3389/fmats.2020.00169
Raffler, M. (2016). Entwicklung eines Finite Elemente Modells einer zylindrischen Lithium Batteriezelle mit Fokus auf Minimierung der Rechenzeit. Graz, Austria: TU Graz. Master’s thesis.
Reitinger, P., Willems, F., and Bonten, C. (2020). “Calibration of models to predict the fiber microstructure of lfrt,” in Fracture and damage mechanics: Theory, simulation and experiment (College Park, Maryland: AIP Publishing), 020047. doi:10.1063/5.0028757
Salaberger, D., Kannappan, K. A., Kastner, J., Reussner, J., and Auinger, T. (2011). Evaluation of computed tomography data from fibre reinforced polymers to determine fibre length distribution. Int. Polym. Process. 26, 283–291. doi:10.3139/217.2441
Salaberger, D. (2019). Micro-structure of discontinuous fibre polymer matrix composites determined by X-ray computed tomography. Graz, Austria: TU Wien. Ph.D. thesis. doi:10.34726/hss.2019.64362
Stelzer, P. S., Plank, B., Maurer, J., Tiefenthaler, M., and Major, Z. (2022). Process-induced failure mode transition of compression molded discontinuous carbon fiber composites: From coupon to component level. Compos. Part B Eng. 242, 110021. doi:10.1016/j.compositesb.2022.110021
Tseng, H.-C., Chang, R.-Y., and Hsu, C.-H. (2016). An objective tensor to predict anisotropic fiber orientation in concentrated suspensions. J. Rheology 60, 215–224. doi:10.1122/1.4939098
Tseng, H.-C., Chang, R.-Y., and Hsu, C.-H. (2017a). Improved fiber orientation predictions for injection molded fiber composites. Compos. Part A Appl. Sci. Manuf. 99, 65–75. doi:10.1016/j.compositesa.2017.04.004
Tseng, H.-C., Chang, R.-Y., and Hsu, C.-H. (2017b). Numerical prediction of fiber orientation and mechanical performance for short/long glass and carbon fiber-reinforced composites. Compos. Sci. Technol. 144, 51–56. doi:10.1016/j.compscitech.2017.02.020
Tseng, H.-C., Chang, R. Y., and Hsu, C.-H. (2018). Numerical predictions of fiber orientation for injection molded rectangle plate and tensile bar with experimental validations. Int. Polym. Process. 33, 96–105. doi:10.3139/217.3404
Tseng, H.-C., and Favaloro, A. J. (2019). The use of informed isotropic constitutive equation to simulate anisotropic rheological behaviors in fiber suspensions. J. Rheology 63, 263–274. doi:10.1122/1.5064727
Keywords: composites, fiber orientation, anisotropic viscosity, optimization, injection molding simulations, short fibers, GFRPs, metamodel
Citation: Rienesl K, Stelzer PS, Major Z, Hsu C-C, Chang L-Y and Zulueta K (2023) Determination of fiber orientation model parameters for injection molding simulations via automated metamodel optimization. Front. Mater. 10:1152471. doi: 10.3389/fmats.2023.1152471
Received: 27 January 2023; Accepted: 29 March 2023;
Published: 18 April 2023.
Edited by:
Cristina Martin-Doñate, University of Jaén, SpainReviewed by:
Joel Vasco, Polytechnic Institute of Leiria, PortugalChristophe Binetruy, Ecole Centrale de Nantes, France
Copyright © 2023 Rienesl, Stelzer, Major, Hsu, Chang and Zulueta. This is an open-access article distributed under the terms of the Creative Commons Attribution License (CC BY). The use, distribution or reproduction in other forums is permitted, provided the original author(s) and the copyright owner(s) are credited and that the original publication in this journal is cited, in accordance with accepted academic practice. No use, distribution or reproduction is permitted which does not comply with these terms.
*Correspondence: Konrad Rienesl, a29ucmFkLnJpZW5lc2xAamt1LmF0