 Stephan Maidl
 Maximilian Hilbck
 Kalle Kind
- Chair of Carbon Composites, Department of Aerospace and Geodesy, TUM School of Engineering and Design, Technical University of Munich, Garching, Germany
Braiding is a highly automated process for manufacturing preforms directly from reinforcement yarns at large production volumes. The quality of braided textiles and the stability of the process can however be negatively affected by defects that occur during braiding. If such defects can be detected from fine process anomalies early during their formation, the process can be interrupted and countermeasures can be introduced before the defect aggravates and gets braided into the product. Current sensor modules for defect detection during braiding however involve problems of either late response times, process impairments or a lack of applicability to braiding of composite parts. In an effort to overcome these drawbacks, the paper at hand proposes to optically monitor the braid formation zone by means of a single camera (no process impairments). An associated image analysis algorithm creates a measure for the angular distance of each individual braiding yarn to its neighboring yarns and tracks the yarns as they rotate around the overbraidable mandrel (typical for braiding of composite parts). Since braiding yarns typically exhibit distinct curvatures as they span from the bobbins towards the center of the braiding machine due to frictional yarn-yarn interaction, a change in yarn curvature and thus in angular yarn distance is an early sign of a defect-characteristic anomaly in yarn tension (early response). If implemented on a real-time capable computing device, an apparatus according to the presented method can be retrofitted to existing production lines for braiding process monitoring. It then contributes to the reduction of error correction times since countermeasures are quicker to implement as long as the defect has not aggravated, yet. Furthermore, scrap material rates can be reduced as anomalies can be detected before they manifest in the braided structure.
1 Introduction
Having been practiced as a social art of bonding strands of human hair in a pleasant fashion for at least 22.000–30.000 years (Kohen, 1946; White, 2006), the principle of braiding is nowadays applied as a textile production process with applications in a wide range of economic sectors such as the marine industry (e.g., mooring ropes or fishing nets), the sports and leisure industry [e.g., climbing ropes or parachute cords (Michael et al., 2016)], electrical engineering and oil hydraulics (e.g., electric shielding or protection of hoses) or medical technology [e.g., stents (Aibibu et al., 2016)]. More specifically, braiding of reinforcement fibers in order to manufacture preforms for composite parts has well-known applications in the automotive [e.g., pillars for passenger compartments (Hill, 2003; Bulat et al., 2016)], aviation [e.g., helicopter landing gears (Thuis, 2004a; 2004b)], space [e.g., rocket nozzles (van Ravenhorst and Akkerman, 2016b; van Ravenhorst, 2018)] as well as in the sports and leisure industry [e.g., lightweight bicycle rims (Kind and Drechsler, 2015; Bulat et al., 2016; Zuurendonk, 2018)]. During braiding of these often hollow structures that may be curved and show a varying cross-section, typical defects such as a generally “fuzzy” braid due to frictional yarn abrasion, yarn loops due to a loss in tension of a single yarn or local yarn gaps and yarn breakages due to an increased tension of an individual yarn may occur (Ebel et al., 2013; Ebel et al., 2016). A particular process anomaly, namely the fibrous ring, is regarded as the most relevant cause for braiding defects. A fibrous ring is an accumulation of broken carbon filaments at the bobbin (braiding spool) which impedes the yarn from unwinding properly from the spool (Ebel et al., 2016; Mierzwa et al., 2016). This causes an increase in tension of the respective yarn that may eventually lead to a distortion of the regular braid structure in the form of a local yarn gap and eventually to a breakage of the yarn. Mierzwa et al. (2018) and Mierzwa (2019) investigated the effect of local yarn gaps in biaxially braided multilayer specimens on their strength. They found a deterioration of up to 36% in tensile and of up to 33% in compressive strength when the braided preforms with local yarn gaps were infiltrated with resin by the Vacuum Assisted Process. By contrast, they did not find significant effects when the preforms were injected with resin by means of the Resin Transfer Molding (RTM) Process. The authors concluded that an excessive fiber undulation in the braided plies on top of the yarn gap was created when a flexible upper tooling (here: vacuum bag) was used during resin infusion and caused the excessive knock-down in strength. In case of a rigid upper tooling (here: RTM tool), a local yarn gap did not cause additional fiber undulation and hence no significant knock-down in strength. Ebel et al. (2013); Ebel et al. (2016) conducted endurance braiding tests in order to quantify the extent of machine downtime due to the necessity of manually rethreading yarns that had broken because of fibrous rings at the braiding spools. In an extreme case scenario with unsuitable parameters during rewinding of the yarns on the braiding spools, they observed a downtime of 26% of the total duration of a test. Despite of these investigations constituting extreme cases, the above figures show that monitoring systems for the braiding process can on the one hand serve as quality assurance and on the other hand as a measure to increase production output and reduce scrap material rates during braiding. The latter point is particularly valid because a process anomaly can often be resolved with little effort if it is detected early (e.g., removal of a fibrous ring with scissors by hand). If an anomaly has evolved through various stages to a major failure event (e.g., a yarn breakage), the braided preform usually needs to be scrapped and time-consuming effort is required to reset the machine to an acceptable state (e.g., rethreading of a broken yarn).
2 Current sensor modules for braiding process monitoring
In order to detect braiding process anomalies, several approaches already exist. Most widely used sensors are rudimentary, stationary switches that jut into the tracks of the bobbin carriers (c.f. Maidl et al., 2018). Upon breakage of a yarn, a movable member of the yarn tensioning unit of the bobbin carrier, e.g., a lever or a slider, changes its position and/or orientation compared to the usual operating mode. When the defective carrier passes by a stationary sensor, the switch gets pushed and a control signal to stop the braiding machine is generated. This approach comes with particularly low installation effort and costs. However, it is only capable of detecting an anomaly when a yarn has already broken. It does not give an early warning which could be used as a trigger to intervene and avoid a larger failure event.
An approach that allows the generation of an early warning comprises a force sensor with a skid attached to it (Lenkeit, 1997). The skid gets in contact with the braiding yarns as they pass by and the force sensor measures the induced reaction force. This way, yarns with increased tension that are about to break can be identified as can yarns with a reduced tension that may lead to a yarn loop in the braid. A disadvantage of this approach is however that the additional yarn contact may cause additional yarn damage, particularly when the braiding machine operates at high speeds which imply a high relative velocity between the yarn and the skid. When brittle reinforcement fibers such as carbon or glass are braided, it is generally agreed that unnecessary yarn contact needs to be avoided for reasons of an accumulation of yarn damage.
Branscomb (2007) and Branscomb and Beale (2011) proposed an optical inspection of the movement of the braiding point. The braiding point is the point in the center of a braiding machine where, during braiding of a rope or a cord, the braiding yarns meet and form the braided strand. During regular braiding, the braiding point rests stationary in the center of the machine due to a balance of forces from the circularly arranged braiding yarns. If a yarn tension anomaly is present, the braiding point moves outside the center of the machine because of imbalanced yarn forces. This optical inspection also works without any additional yarn contact and therefore incurs no additional yarn damage. The problem of this approach is however that during braiding of composite preforms, a distinct braiding point that is free to move does not exist in most cases. Instead, the reinforcement fibers are usually braided onto rigidly guided mandrels (e.g., by a robot). Hence, the described concept cannot be applied for braiding of composite structures.
Nevertheless, there are optical inspection approaches of the braid formation zone that can be applied in composites braiding (cf. Figure 1 for a view of the braid formation zone). The underlying detection concept is based on the fact that braiding yarns are slightly curved as they span from the bobbin towards the center of the machine due to frictional interaction between yarns that circulate through the machine in opposite directions (van Ravenhorst and Akkerman, 2016a; van Ravenhorst, 2018). When a braiding yarn shows an increased tension, its curvature is reduced. When a yarn shows a reduced tension, its curvature is in turn more pronounced. Brockmanns et al. (2014) conclude in their patent application that from a force sensor with a skid attached to it according to Lenkeit (1997) not only the force amplitude created by the passing-by of each yarn but also the time interval between the force impulses can be measured. Furthermore, yarn contact and thus yarn damage can be avoided by measuring the time intervals between circulating braiding yarns by means of an optical sensor. Due to natural process fluctuations such as vibrating yarns, such a discrete distance measurement was however experimentally determined by means of a light barrier in the braid formation zone to be prone to false positive and false negative defect detections (Maidl et al., 2022).
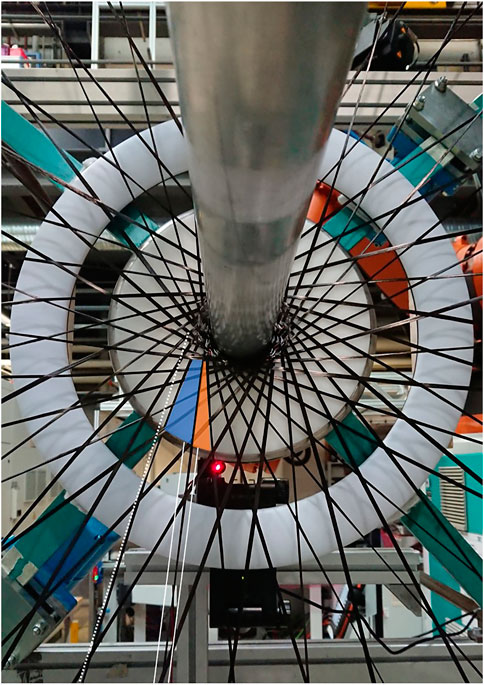
FIGURE 1. Braid formation zone during braiding with
The paper at hand is therefore intended to provide a solution for an optical inspection of the braid formation zone that
• is capable of giving an early warning before defective braid is produced,
• incurs no additional yarn damage,
• is suitable for the use case of braiding of composite structures on a mandrel and
• allows a robust process monitoring by eradicating false positive or false negative defect detections that may stem from natural process fluctuations.
3 Materials and methods
The fact that braiding yarns do not follow a straight line but exhibit a curved shape instead is indicated in Figure 1. A straight dotted line that is tangential to one of the yarns shows an increasing distance to the respective yarn the closer the yarn is to the center of the braid formation zone. Additionally, another yarn marked by two solid lines is purposefully set under an anomalously high tension in Figure 1, thereby resembling a situation that occurs when a braiding defect, such as a fibrous ring, is present. The consequence is that the curvature of this yarn is reduced, resulting in an increased angular distance to its succeeding yarn (cf. blue area in Figure 1) and a reduced angular distance to its preceding yarn (cf. orange area in Figure 1). This deviation in angular yarn distances results in different time intervals of the circulating braiding yarns passing by a discrete sensor that is placed close to the center of the braid formation zone (e.g., a light barrier of which the red laser is visible in Figure 1). Brockmanns et al. (2014) propose to use such a deviation from regular time intervals as a defect detection criterion. Since this was—given natural process fluctuations—shown to be an unreliable criterion (Maidl et al., 2022), a video camera and an associated image analysis algorithm are applied to track the yarns during the braiding process in the paper at hand. The idea behind this approach is that a yarn distance measurement is not only carried out at a discrete position in the braid formation zone but that distance measurements for each yarn are constantly made as the yarns circulate around the center of the machine (ideally at each video frame). This way, a multitude of yarn distance measurements is available for each braiding yarn as it completes a full 360° revolution through the machine. An averaging over several yarn distance measurements is then able to even out naturally occurring process fluctuations (e.g., vibrations or temporary stick-slip movement of the yarns).
In order to validate the above-described detection principle and to illustrate a possible way on how to determine over how many video frames the yarn distance measurements need to be averaged, the following experimental study was conducted. A cylindrical mandrel with a diameter of
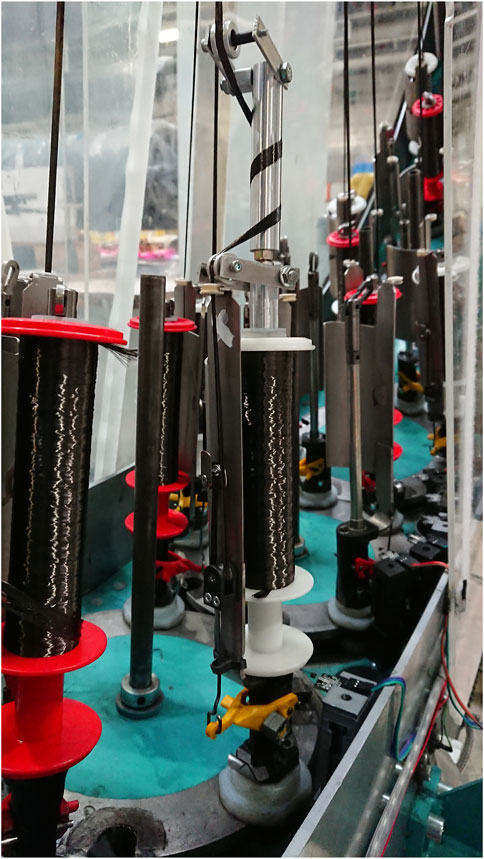
FIGURE 2. Barrel tensioner screwed onto a bobbin carrier in order to create a consistent level of elevated tension of a single yarn during the braiding experiments with a simulated defect.
For the recording the braiding experiments, a Nikon D3300 SLR camera with a resolution of 1920 × 1080 pixels and a frame rate of
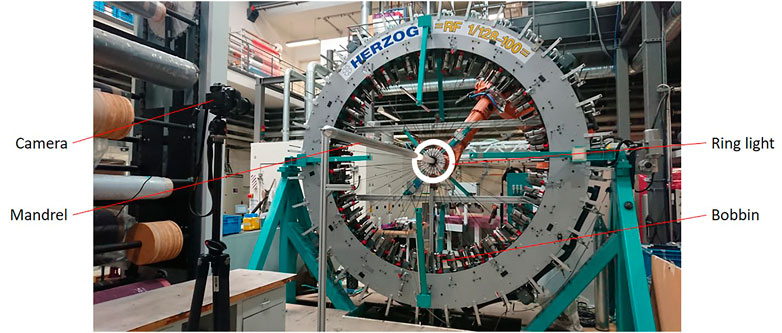
FIGURE 3. Experimental setup of the RF 1/128–100 braiding machine from HERZOG GmbH equipped with a ring light behind the braid formation zone, a cylindrical mandrel that is overbraided with carbon yarns and a camera that monitors the illuminated braid formation zone.
4 Image analysis algorithm
Figure 4A shows an exemplary video frame acquired by the above-described camera setup during braiding with
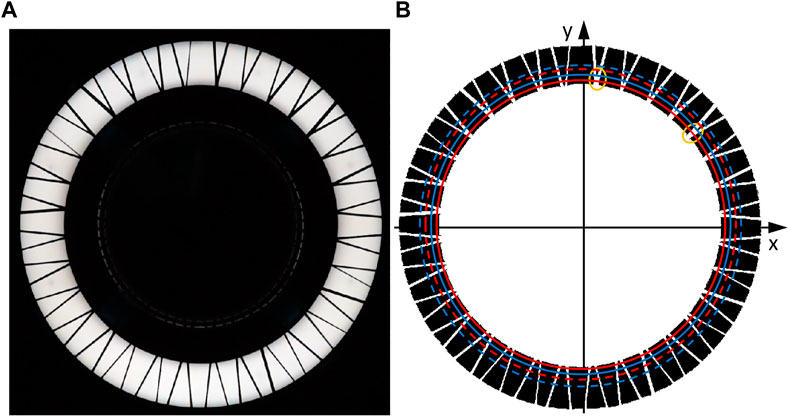
FIGURE 4. Exemplary video frame acquired by the camera that monitors the braid formation zone (A); identical video frame after preprocessing by the image analysis algorithm (B); two pairs of imaginary circles (solid and dashed circles) drawn-in for a visualization of the working principle of the main processing of the algorithm; two orange ellipses mark areas where the circle in solid blue intersects with yarn crossing points.
During the subsequent main processing, a first pair of imaginary concentric circles close to the inner edge of the ring light is drawn into the image (cf. solid red and blue circles in Figure 4B). The outer circle of this pair is 10 pixels larger in radius than the inner circle. It is then checked if both circles intersect with a white object as many times as there are braiding yarns in the braiding test. Three cases may result from this check. The first case is that the number of intersections equals the number of braiding yarns for both circles. In this case, the measurement algorithm can continue. The second case is that the number of intersections only equals the number of braiding yarns for the outer circle. In this case, the outer circle is taken as the new inner circle and a new outer circle is drawn that is 10 pixels larger in radius than the new inner circle (previous outer circle). Then, the check for the number of intersections is run again. In the third case, the number of yarn intersections does not equal the number of braiding yarns for the outer circle. This is the case in Figure 4B. Two orange ellipses mark areas where the outer circle only intersects with one white object where in fact two braiding yarns cross each other. The number of intersections for the outer circle is in this case 62, which is two less than the number of braiding yarns
For each of the intersection objects of inner and outer circle, their centroid is calculated by the “regionprops”-function. Exemplary intersection objects and their centroids are depicted in Figure 5. For each centroid on the inner circle, the corresponding centroid on the outer circle, which originates from the same yarn as the respective centroid on the inner circle, is found by means of a nearest neighbor search (“knnsearch”-function). Plausibility checks in the form that the distance between corresponding centroids must not exceed 11 pixels or be less than 9 pixels are implemented in order to avoid wrong assignments of centroids that are located closely to points of yarn intersections. This is of particular importance because in the next step, the decision whether a yarn circulates in clockwise or in counterclockwise direction through the braiding machine is based on the difference in polar angles
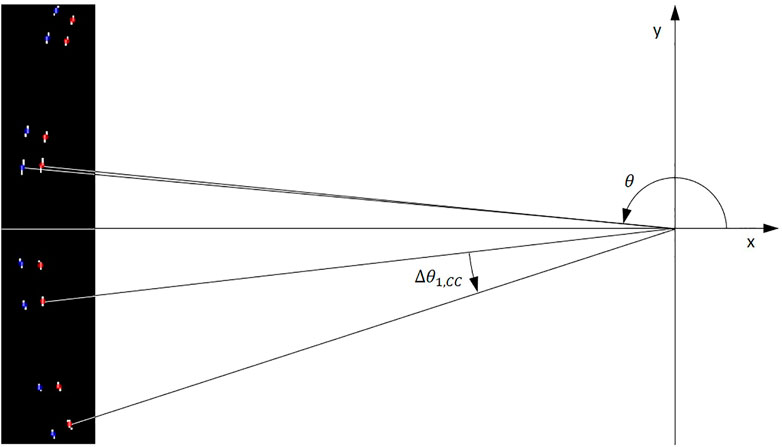
FIGURE 5. Close-up of white intersection objects resulting from the video frame in Figure 4; centroids of inner and outer intersection objects marked by red and blue dots, respectively; exemplary measurement of the polar angle
The final post processing comprises the two steps of averaging the yarn distance measurements per direction of rotation over several video frames and a visualization of the defective yarn in the acquired video frames. Figure 6 exemplarily shows angular yarn distance measurements of the counterclockwise yarns during braiding with the 12 k yarns and an increased tension of a single yarn of ∼35 N for the first nine video frames that passed all plausibility checks described above and therefore could be evaluated. Apart from a general scatter in the data, which reflects the nature of the braiding process and caused a stationary light barrier to be found to be unsuitable for braiding process monitoring (Maidl et al., 2022), a distinct pattern of a particular larger yarn distance directly followed by a smaller yarn distance appears to propagate from yarn distance numbers 24–25 in frame 1 to yarn distance numbers 27–28 in frame 15. This distinct propagating pattern reflects the fact that a yarn with an elevated tension, which creates a systematic deviation in yarn distances, moves in counterclockwise direction through the braiding machine. The distinct pattern moves from left to right through the diagrams in Figure 6 because the calculated yarn distances appear sorted from polar angles of
Secondly, the expected position of the “first yarn” at frame number
whereby
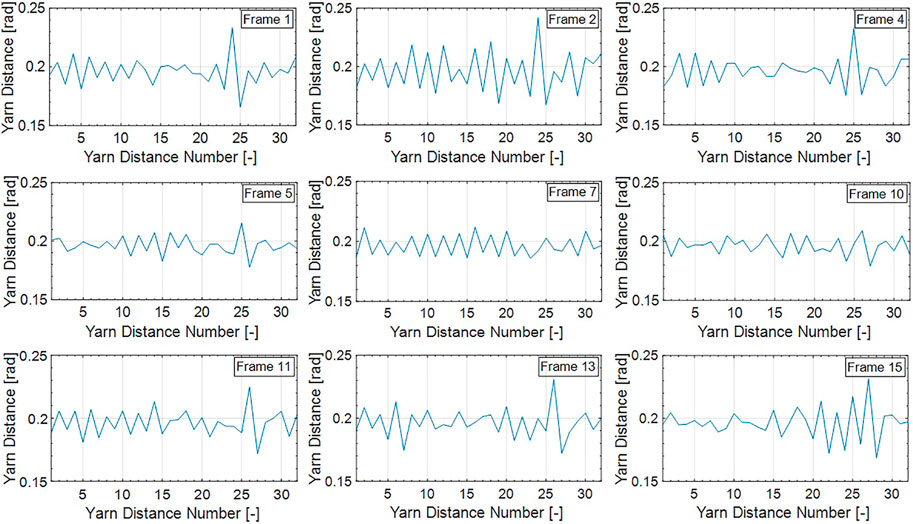
FIGURE 6. Yarn distance measurement results of counterclockwise yarns of the first 15 frames of the braiding experiment with
The index of the closest match minus 1 then equals the offset of the measured angular yarn distances from the nth frame compared to the first video frame of the experiment.
The negative of this offset value is then applied in the “circshift”-function to shift the sorted array of angular yarn distances in a way that each position of the array corresponds to the same yarn throughout the monitoring process. The above formulae are written and explained for the case of monitoring counterclockwise (CC) yarns. In case clockwise (C) yarns shall be monitored, the “+“-sign in Formula 2 needs to be replaced by a “−“-sign. Additionally, not the negative but the positive offset value from Formula 4 needs to be applied in the “circshift” function in order to keep a moving defective yarn and its corresponding yarn distance measurements at the same position in the array of angular yarn distance values over the duration of the braiding experiment.
Once each position in the array of angular yarn distance values corresponds to the distance between the same two yarns for all acquired video frames, an average in yarn distance can be calculated for each pair of yarns over a certain number of video frames (length of averaging window). The result of such an averaging over the nine diagrams from Figure 6 that represent measurements from counterclockwise yarns is illustrated in Figure 7. It can be observed that random deviations in angular yarn distances have significantly evened out. Furthermore, between yarn distance number 24 and 25, a distinct defect-characteristic spike has formed in the diagram. The prominence of this defect-characteristic spike is marked with a double arrow. This measure is used in the following results section as a value to compare the deviation in yarn distances over the different experiment variants.
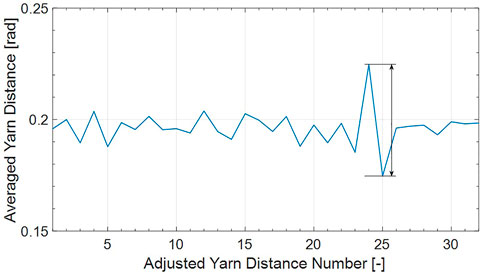
FIGURE 7. Averaged yarn distance measurements calculated from the nine diagrams shown in Figure 6 after shifting the x-axis by Formula 1 through Formula 4; prominence of defect-characteristic pattern indicated by a double arrow.
From the position of the defect-characteristic pattern in Figure 7, the yarn with anomalously high tension can be identified to be the 25th counterclockwise yarn in the first video frame of the experiment counting from the negative x-axis in mathematically positive direction. Figure 8 shows a visualization of the detection result of the above-described image analysis algorithm for the first nine analyzable video frames of the braiding experiment already illustrated in Figure 6. The clockwise yarns are marked by red dots and the counterclockwise yarns are marked by blue dots. The defective yarn as identified by the algorithm is marked by a yellow dot. It can be observed that the marks lie at different radial distances from the center of the camera view. This is due to the fact that the image analysis algorithm had to apply different radii for the pair of circles in order that both circles intersect one-to-one with each braiding yarn. Furthermore, it can be seen that the defective yarn moves in counterclockwise direction through the sequence of images. On close inspection by eye, one can even correlate distinct deviations in angular yarn distances from the diagrams in Figure 6 to the distances of the yellow-marked yarn to its neighboring yarns in the respective frames in Figure 8.
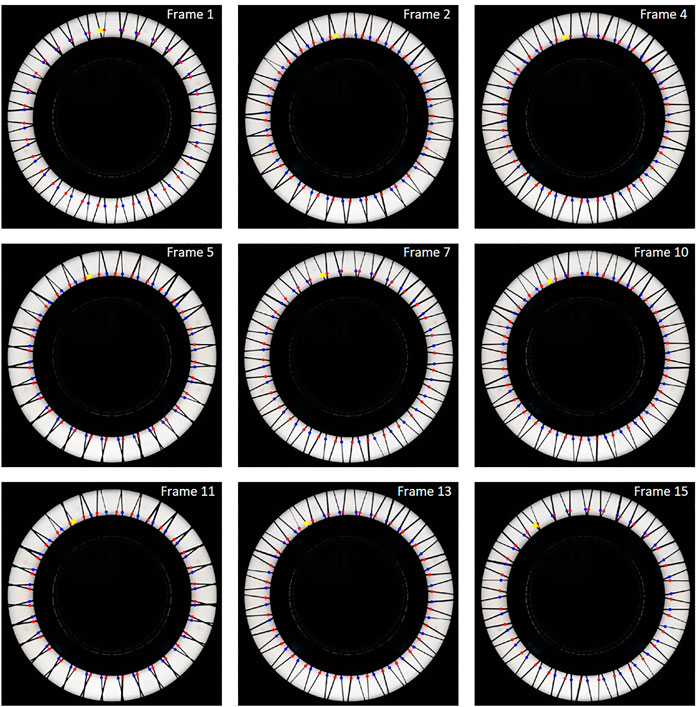
FIGURE 8. Video frames corresponding to the yarn distance diagrams from Figure 6; clockwise yarns marked by red dots; counterclockwise yarns marked by blue dots; defective yarn as identified from the characteristic pattern in Figure 7 marked by a yellow dot.
5 Results and discussion
The prominences of the defect-characteristic pattern as marked in Figure 7 were analyzed for the different variants of the braiding experiments. For the diagram shown in Figure 9, all available video frames of a braiding experiment were taken into account for the averaging step. The standard deviations are not drawn-in on purpose because they would not provide any meaningful information given the natural scatter of the angular yarn distances as described above. Additionally, no data is shown for the 6 k yarns and elevated tensions of ∼35 N and >45 N, respectively. The reason for this is that these thin yarns could not sustain these high elevated tensions and broke during the braiding tests. It can be observed that the defect-characteristic spike in the averaged yarn distance measurement is generally more pronounced if
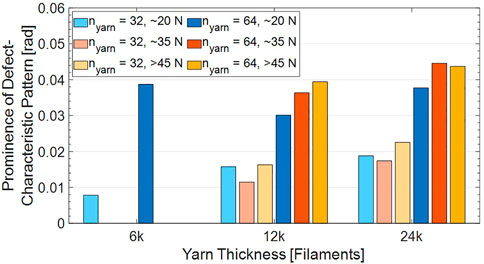
FIGURE 9. Prominence of the defect-characteristic pattern after averaging over the complete duration of each braiding experiment with a simulated defect.
The fact that in variants with
In Figure 9, all available video frames of an experiment variant were taken into account for the calculation of the prominence of the defect-characteristic pattern. From a process monitoring perspective, it is however of interest how long the averaging window of video frames actually needs to be in order to reliably detect a defect. This relation is analyzed at the example of the group of experiments with the 12 k yarns in Figure 10. On the x-axis, the number of video frames taken into account for the averaging step described in Section 4 is varied. It can be observed that the smaller the averaging window is, the more pronounced the maximum of random yarn distance variations from flawless reference measurements appears in the diagram (cf. curves labeled as “Max Diff Reference”). With increasing length of the sliding averaging window, random deviations in yarn distances are increasingly evened out. By contrast, the minimum deviation in angular yarn distance that results from the defective yarn increases with increasing length of the averaging window (cf. curves labeled as “Min Diff Error”). For the case of
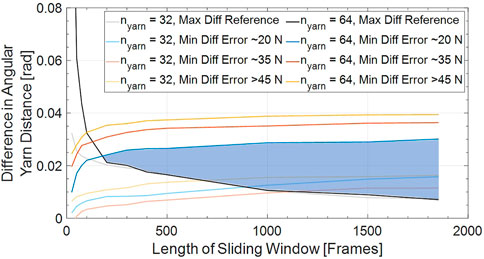
FIGURE 10. Comparison of maximum difference in angular yarn distance resulting from random process fluctuations during flawless reference measurements with minimum of defect-characteristic pattern during measurements with a replicated defect over different lengths of sliding averaging windows for the braiding experiments with 12 k yarns; blue-marked area indicates combinations of lengths of averaging windows and differences in angular yarn distances as possible detection thresholds for a defect detection without any false negative or false positive detections for
Given the fact that a minimum length of the averaging window of 200 frames is required for a reliable defect detection at a frame rate of
Even though it is a positive finding that a biaxial braid of at least
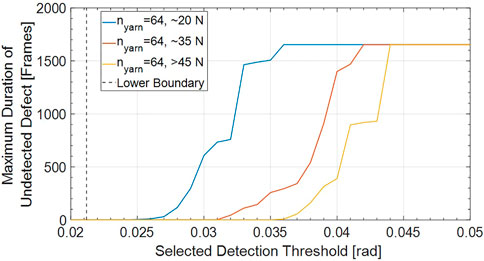
FIGURE 11. Duration of an undetected defect depending on different levels of yarn tension anomalies over selected difference in angular yarn distance as detection threshold for the case of
6 Conclusion and outlook
A newly developed camera-based monitoring approach for a simultaneous tracking of all braiding yarns during the process was presented in the paper at hand. As a principle for anomaly detection, the associated image processing algorithm relies on an analysis of angular yarn distances of braiding yarns of the same direction of circulation through the machine. In an experimental study comprising flawless reference braiding tests and braiding tests with purposefully introduced yarn tension anomalies of varying severity as well as a variation of yarn number
For reasons of providing a proof of concept, the experiments in the paper at hand only cover braiding of a cylindrical mandrel. The strength of the braiding process, particularly in comparison to filament winding, is however that also parts that are curved can be produced. If such curved parts need to be braided, the camera view to parts of the braid formation zone may be obstructed by a curved mandrel. A similar obstruction of the camera view occurs when a second handling robot is used so that the overbraidable mandrel is grabbed at both ends. The algorithm presented in the paper at hand does however not require a full view on the braid formation zone. The criterion that the imaginary circles of the image analysis algorithm need to intersect with yarns as many times as there are yarns in the braiding machine can be modified with limited effort. It is for instance possible to let the algorithm operate independently on four quarters of the braid formation zone. In such a modification of the algorithm, the number of yarn intersections of the imaginary circles in a quarter needs to equal
As discussed, the detection principle relies on frictional interaction between the braiding yarns. If other yarns than dry carbon yarns also with potentially different types of sizing shall be braided (e.g., glass or aramid fibers) it may be the case that their frictional properties vary from those of carbon yarns. This is why further experiments with these different types of yarn materials are required to assess the defect detection capabilities of the proposed approach. Furthermore, there may be yarns that are partly transparent for the ring shaped backlight illumination (e.g., glass fibers). The brightness thresholds for the binarization during the image preprocessing may have to be modified for such yarn types. Finally, it needs to be acknowledged that if triaxial braids with additional 0°-fibers compared to the investigated biaxial braid shall be monitored, the algorithm as presented is not functional since neighboring intersection objects would not exclusively correspond to moving braiding yarns. The current distinction between clockwise and counterclockwise yarns by comparison of polar angles
Data availability statement
The raw data supporting the conclusion of this article will be made available by the authors, without undue reservation.
Author contributions
SM Conceptualization, Methodology, Software, Validation, Formal analysis, Investigation, Writing—original draft, Writing—review and editing, Visualization, Project administration, Funding acquisition. MH Conceptualization, Methodology, Writing—review and editing. KK Writing—review and editing, Supervision. KD Resources, Writing—review and editing, Supervision.
Funding
The authors thankfully acknowledge the funding provided by the German Federal Ministry for Economic Affairs and Climate Action under the scheme “Zentrales Innovationsprogramm Mittelstand (ZIM)” for the project “IMoFlecht: Inline Monitoringsystem zur Überwachung hochqualitativer Flechtprodukte” (Funding Code: ZF4004324HB9).
Conflict of interest
The authors declare that the research was conducted in the absence of any commercial or financial relationships that could be construed as a potential conflict of interest.
Publisher’s note
All claims expressed in this article are solely those of the authors and do not necessarily represent those of their affiliated organizations, or those of the publisher, the editors and the reviewers. Any product that may be evaluated in this article, or claim that may be made by its manufacturer, is not guaranteed or endorsed by the publisher.
References
Aibibu, D., Hild, M., and Cherif, C. (2016). “An overview of braiding structure in medical textile: Fiber-based implants and tissue engineering,” in Advances in braiding technology: Specialized techniques and applications. Editor Y. Kyosev (Duxford: Woodhead Publishing), 171–190.
Branscomb, D. J. (2007). A machine vision and sensing system for braid defect detection, diagnosis and prevention during manufacture. Master Thesis, Auburn, United States of America: Auburn University.
Branscomb, D. J., and Beale, D. G. (2011). Fault detection in braiding utilizing low-cost USB machine vision. J. Text. Inst. 102, 568–581. doi:10.1080/00405000.2010.498174
Brockmanns, K.-J., Kümpers, F.-J., Baumgart, G., and Leifeld, M. (2014). Radialflechtmaschine. German patent application DE102012223127A1.
Bulat, M., Ahlborn, H., Gnädinger, F., and Michaelis, D. (2016). “Braided carbon fiber composites,” in Advances in braiding technology: Specialized techniques and applications. Editor Y. Kyosev (Duxford: Woodhead Publishing), 383–394.
Ebel, C., Brand, M., and Drechsler, K. (2013). “Effect of fiber damage on the efficiency of the braiding process,” in 11th Composites Week @ Leuven and TexComp-11 Conference, Leuven, Belgium.
Ebel, C., Mierzwa, A., and Kind, K. (2016). “Yarn damage during braiding of reinforcement fibers for composites,” in Advances in braiding technology: Specialized techniques and applications. Editor Y. Kyosev (Duxford: Woodhead Publishing), 319–354.
Hill, J. (2003). Adhesively bonded structural composites for Aston Martin vehicles. Available at: https://www.audiclubsouthafrica.co.za/yabbfiles/Attachments/b01.pdf (Accessed October 31, 2021).
Kind, K., and Drechsler, K. (2015). Method for the production of braided CFRP bicycle rims, 15. Amiens, France: SAMPE Europe Conference.
Lenkeit, J. (1997). Verfahren zur Zugkraftmessung an laufenden Fäden einer Fadengruppe sowie Vorrichtung zur Ausübung des Verfahrens. German Patent Specification DE19730965C1. Germany: Tensometric-Meßtechnik Ströhmann & Co GmbH.
Maidl, S., Fernández Villalba, Á., Kind, K., and Drechsler, K. (2020). Development of sensor integrated braiding rings for the automated detection of braiding defects. Mater. Today Proc. 34, 74–81. doi:10.1016/j.matpr.2020.01.194
Maidl, S., Putze, L., Kind, K., and Drechsler, K. (2022). “Automated detection of yarn gaps during radial braiding of carbon fiber by means of light barriers,” in ECCM20 - 20th European Conference on Composite Materials, Lausanne, Switzerland.
Maidl, S., Sabieraj, M., Mierzwa, A., Ebel, C., and Drechsler, K. (2018). Investigating the unwinding behavior of technical yarns and development of a new sensor system for the braiding process. IOP Conf. Ser. Mater. Sci. Eng. 406, 012065. doi:10.1088/1757-899X/406/1/012065
Michael, M., Kern, C., and Heinze, T. (2016). “Braiding process for braided ropes,” in Advances in braiding technology: Specialized techniques and applications. Editor Y. Kyosev (Duxford: Woodhead Publishing), 225–243.
Mierzwa, A., Ebel, C., and Drechsler, K. (2018). Auswirkungen lokaler Garnlücken auf die mechanischen Eigenschaften geflochtener Kohlenstofffaser-Kunststoff-Verbunde. Zeitschrift Kunststofftechnik/J. Plastics Technol. 14, 146–173. doi:10.3139/o999.02012018
Mierzwa, A., Ebel, C., Harbers, T., and Drechsler, K. (2016). “Investigation on creation of fibrous rings and their influence on the braided preform quality,” in ECCM17 - 17th European Conference on Composite Materials, Munich, Germany.
Mierzwa, A. (2019). Zur Entstehung und Auswirkung von Garnlücken in Carbonbiaxialgeflechten. Dissertation. Munich, Germany: Technical University of Munich.
Thuis, H. (2004a). “Composite landing gear components for aerospace applications,” in ICAS 2004 - 24th International Congress of the Aeronautical Sciences, Yokohama, Japan.
Thuis, H. (2004b). The development of composite landing gear components for aerospace applications. https://citeseerx.ist.psu.edu/viewdoc/download?doi=10.1.1.157.3791&rep=rep1&type=pdf (Accessed October 31, 2021).
van Ravenhorst, J. H., and Akkerman, R. (2016a). A yarn interaction model for circular braiding. Compos. Part A Appl. Sci. Manuf. 81, 254–263. doi:10.1016/j.compositesa.2015.11.026
van Ravenhorst, J. H., and Akkerman, R. (2016b). “Overbraiding simulation,” in Advances in braiding technology: Specialized techniques and applications. Editor Y. Kyosev (Duxford: Woodhead Publishing), 431–455.
van Ravenhorst, J. H. (2018). Design tools for circular overbraiding of complex mandrels. Dissertation. Twente, Netherlands: University of Twente.
White, R. (2006). The women of brassempouy: A century of research and interpretation. J. Archaeol. Method Theory 13, 250–303. doi:10.1007/s10816-006-9023-z
Keywords: braiding defects, defect detection, online process monitoring, optical inspection, image analysis, automated quality control
Citation: Maidl S, Hilbck M, Kind K and Drechsler K (2023) Optical inspection of the braid formation zone during manufacturing of preforms from reinforcement fibers for defect detection purposes. Front. Mater. 10:1127476. doi: 10.3389/fmats.2023.1127476
Received: 19 December 2022; Accepted: 06 February 2023;
Published: 23 February 2023.
Edited by:
Baris Caglar, Delft University of Technology, NetherlandsReviewed by:
Mohammad Ghaedsharaf, Polytechnique Montréal, CanadaMuhammad Ali, Khalifa University, United Arab Emirates
Copyright © 2023 Maidl, Hilbck, Kind and Drechsler. This is an open-access article distributed under the terms of the Creative Commons Attribution License (CC BY). The use, distribution or reproduction in other forums is permitted, provided the original author(s) and the copyright owner(s) are credited and that the original publication in this journal is cited, in accordance with accepted academic practice. No use, distribution or reproduction is permitted which does not comply with these terms.
*Correspondence: Stephan Maidl, c3RlcGhhbi5tYWlkbEB0dW0uZGU=