
95% of researchers rate our articles as excellent or good
Learn more about the work of our research integrity team to safeguard the quality of each article we publish.
Find out more
ORIGINAL RESEARCH article
Front. Mater. , 09 February 2023
Sec. Colloidal Materials and Interfaces
Volume 10 - 2023 | https://doi.org/10.3389/fmats.2023.1112798
This article is part of the Research Topic New Frontiers in Hybrid Nanofluids for Heat Transfer Process and Applications View all 14 articles
 Liaqat Ali1*
 Wiqar H. Shah1*
 Akhtar Ali1
 Sayed M. Eldin2
 Abdullah A. Al-Jaafary3A. Sedky4Javed Mazher3
 Naveed Imran5,6
 Muhammad Sohail7
Pellets of Pure and Fe-doped dilute magnetic semiconducting (DMS) samples are studied for bulk magneto-resistance (BMR) at room temperature and at low-temperatures ∼100K. Raman-, photoluminescence- and X-ray photoelectron-spectroscopic techniques are used to determine chemical and electronic structures of the samples. A broadband intense yellow-green-orange luminescence is observed in Fe-doped ZnO samples and emission red-shifts are investigated. Electrical transport is studied with and without applied magnetic field up to 9T and thermal activation and hopping modes of conduction is discussed in light of nature of Fe substitution in the host lattice. Several decremental- to incremental-BMR crossovers are obtained corresponding to experimental variables of Fe concentration 0.025 ≤ x ≤ 0.1, temperature and applied magnetic field. Several possible modes of magneto-transport are discussed to further elucidate the origin of the as-found BMR crossovers in our samples. Positive BMR in pure- and highly doped (x ≥ 0.1) ZnO is found to originate from F-centers and thermal fluctuations, respectively. However, modestly doped (x ≤ 0.05) ZnO exhibit thermally activated conduction and magnetic poloron mediated negative BMR.
When bulk granular composites are exposed to a magnetic field, their electrical resistance changes, this phenomenon, known as BMR (Δρ/ρo), has been linked to separate spin and itinerant charge carriers’ spin-dependent dispersion from localized moment’s bands (Jansson et al., 2014). Typically, along the samples’ longitudinal resistance (ρxx), BMR is observed and the electrical magneto transport is assessed by maintaining a parallel voltage and current probe arrangement (Hsu et al., 2008). According to research, the BMR has both positive and negative elements that are caused by roving particles with different conductivities and motilities, as well as two-band spin splitting from spin dispersed itinerants with localized magnetic moments (Hsu et al., 2008; Chattopadhyay et al., 2013). The fluctuation in the relative intensities of the competing itinerant spin scattering processes is connected to the BMR transitions from negative to positive (Gacic et al., 2007; Balamurugan, 2012; Jansson et al., 2014; Can et al., 2016; Sapkota et al., 2016). The strength of spin scattering processes in doped magnetic oxides is affected by the amount of doping, the type of manipulated element, the type of doping, its solubility in the host-lattice, the concentrations of defects, the temperature, the applied magnetic field, the orbital overlap of the dopant, and the and the state-specific spin density (SDOS) (Wang et al., 2015a; Wang et al., 2015b; Lorite et al., 2015; Lv et al., 2015; Montes-Valenzuela et al., 2015; Lee et al., 2016; Mukherjee et al., 2017). Zinc-oxide is well known among metal-oxides for having a very high intrinsic n-type charge carrier density and for being sensitive to its defect and lattice structure related donor states like native oxygen vacancy, interstitial hydrogen impurity states and intermediate ZnO (Shi et al., 2005). It has a 3.3 eV optical energy gap and is a wurtzite (hexagonal) structured material. However, oxygen vacancies (Vo), which are double donor states in ZnO host-lattice and are responsible for n-type carriers, are usually suggested to be the source of ZnO’s impurity band. As a result, by varying the Vo concentration, the carriers may be successfully modified (Wang and Tanaka, 2009). ZnO is being utilized to manufacture solar cells, trace gas sensors, conductive glasses, and self-cleaning surfaces. It functions as a photon harvester. A little quantity of transition metal (TM) ions, such as Ni, Co., Fe, Mn, and others, doped in the ZnO host lattice effectively alters the semiconductor’s lattice confuration and induces magnetic (Borges et al., 2011). This is owing to the existence of an unpaired electron in the dopant -Fe’s partly filled d-electron states (4s23 d6). The restricted, unpaired d-electrons hybridize with the host ZnO’s wandering sp-electrons to generate magnetically coupled electrons that participate in exchange interactions, resulting in SDOS between the host charge transporters. Commonly referred to as solid solutions of TM doped semiconductors to be DMS materials since n-type semiconductors also exhibit magnetic ordering. DMS oxides are useful in numerous opto - electronic devices, including as diodes with optical spin, spin driven random access memory, spin field effect transistors, and light emitting devices (LED), thanks to their functional properties. DMS oxides also have greater magnetic moments and high curie temperatures, which are essential characteristics for the perfect spintronics material (Han et al., 2002). Additionally, it is possible to further customize the electrical structure, optical band gap, and as well as kind of magnetism in DMS systems by modifying the doped ZnO’s particle size and TM atom concentration (Liu and Guyot-Sionnest, 2015; Quan et al., 2016). The multifunctional quantum dots made of ZnO, a transparent, non-toxic, affordable, and biocompatible nanomaterial, have recently attracted a lot of attention for their potential use in cutting-edge processes such as targeted drug delivery using magnetic fields, magnetic tagging, magnetic resonance imaging, and protein-macromolecule separation. (Lorenz et al., 2016). A uniform solid solution of Fe doped may be created using a variety of wet-chemical and sol-gel, including solid-state processes (Ariyakkani et al., 2017), bottom up co-precipitation (Fabbiyola et al., 2016; Pazhanivelu et al., 2016), common solid state reaction (Sedky and KotbMahfoz, 2013), hydrothermal (Mihalache et al., 2017), and others. To achieve repeatable DMS characteristics, a faultless solid solution must be generated in which the host-lattice and substitutional dopant ions encounter the optimal magnetic coupling environment. In this sense, achieving a homogeneous local dopant profile has been very successful for solid state reaction techniques (Das et al., 2015). In the cationic sub-lattice of ZnO, the Fe2+ ion (∼0.078 nm) typically replaces Zn2+ (∼0.074 nm) at lower dopant concentrations, forming a Zn1-xFexO solid solution of mixed alloy (Salem et al., 2016) (Sedky and KotbMahfoz, 2013). Though, trivalent iron inclusion is more likely at higher dopant concentrations, leading to a reduced solubility of the Fe3+ ion (∼0.055 nm). This is because the ZnO cationic-lattice, which is primarily made up of Zn2+ ions, has a larger radius difference, rZn/rFe ∼1.35The formation of a secondary oxide phase of iron with flaws and structural distortions is therefore envisaged at higher dopant concentrations. Additionally, it has been demonstrated that substitutional iron is in the F2+/3 + oxidation state coexist in chemical evaluations of DMS samples where Fe-doping levels are greater than 2 wt% (Lin et al., 2010; Saikia et al., 2016). A stronger ferromagnetic ordering has also been noticed (Beltrán et al., 2015) (Liu et al., 2011) depending on the creation of imperfections and secondary phases, like as ZnFe3O4 associated to a state where Fe3+ oxidations are additionally present. However, it has also been discovered that higher Fe concentrations cause a decrease in ZnO’s electronic conductivity (Sedky et al., 2009). Therefore, replacing Zn2+ in the cationic lattice of ZnO with a non-magnetic ad-atom such as Cu, Al, etc. through doping could increase the number of carriers accessible in the interaction of the exchange. However non-magnetic atoms have also been proved to be beneficial in the production of secondary phases, which weakens the conductivity-related BMR enhancement in transport experiments (Liu et al., 2011). Dilute magnetic semiconducting oxides have recently been the subject of extensive research to better understand any anomalies in spin-based transport. These studies can be roughly categorized into four fundamental spin transport mechanisms (Jansson et al., 2014; Wang et al., 2015a; Sapkota et al., 2016). Two concurrent spintronicity processes, thermally stimulated transport has revealed pd-electron spin exchange and ferromagnetic ordering, which, depending on the number of carriers and the degree of magnetic ion doping, can be explained by a two band spin split model. (Jansson et al., 2014; Sapkota et al., 2016). Second, a monotonous increase in positive-BMR across un-doped metal oxides can be attributed reduced overlapping between neighboring donor states and wave function shrinkage caused by the magnetic field dependence of itinerants surrounding donor vacancies (Jansson et al., 2014). Finally, BMR resulting from a donor-bound magnetic poloronic effect in which ferromagnetic spin alignment and energy minimization occur as a result of electrons coupled to donor sites (F-centers) interacting with nearby magnetic dopants’ spins. As a result, the energy barrier that the creation of polorons establishes for hopping electrons causes the sample’s resistivity to rise. The forced realignment of magnetic dopants in the direction of the field, however, causes the net poloronic effect to decrease in the presence of an external magnetic field. As a result, the dopants’ spin interactions with the F-centers are considerably diminished, which causes a rise in hoping-conduction and negative magnetoresistance (Ahmed et al., 2012). Finally, thermally oscillating magnetic dopant atoms are another explanation for BMR in the intermediate temperature range. In these atoms, the resonance between the hoping sites and the thermal variations of localizes magnetic moments allows for increased hoping conduction (Petukhov and Foygel, 2000). However, because to a declining resonance mode producing a positive BMR, it is anticipated that the hoping resistivity will rise under an external magnetic field. Due to these competing processes, DMS oxides may simultaneously contain two or more processes (Peters et al., 2010; Wang et al., 2015a; Wang et al., 2015b; Montes-Valenzuela et al., 2015; Venkatesh et al., 2016). BMR of metal-oxides has often been attributed at increasing carrier concentrations (nc), to the spin-exchange mechanism between itinerant sp-hybridized host-carriers and confined d-shell electrons of TM dopants (Wang et al., 2015a). To fully understand how BMR in ZnO came about and whether or not several spintronic processes might coexist, all-inclusive experimental approaches are required, especially at room temperature given the multiple complexities involved in DMS based magneto-transport. We describe spectroscopic and transport studies on various samples of Fe doped ZnO in this research. With regard to the TM dopant concentration in DMS oxides, we are attempting to examine spectroscopic changes and magnetization in this case.
To manufacture a set of Zn1-xFexO micro-particulates, a typical solid state reaction approach is utilised, in which FeO3 precursor in normal powder form (usually in micrometer range) (Aldrich, 99.999% purity, 200 nm) is added to ZnO micro particles and ground at Fe2+ with various concentrations value of 2.5%, 5%, 10%, 30%, and 50%. The powder is calcined at 1,000 °C for 12 h to complete the reaction, and then it is quenched to 25 °C. Sintering of 4-ton pressed pellets (1-cm dia. and 2-mm thick) of re-ground DMS powders takes 10 h at 1,100 °C. The pellets of powder are marked A-E based on their Fe concentration ‘x' 0 (A), 2.5% (B), 5% (C), 10% (D), 30% (E), and 50%. (F). In the presence of a magnetic field, temperature against resistance (−9 up to 9 T) In a physical property testing tool (Quantum Design, Evercool2/ETO), the resistance of the pellets is assessed in relation to their temperature and magnetic field in the temperature range of (100–350 K). Silver-epoxy resin (Epo-tek, H20E), which is thermally and electrically conductive down to 1 K, was used to electrically contact the pellets. A laser scanning microscope is used to examine the surface morphology of DMS pellets (Carl Zeiss, LSM800-Mat.).
XPS data is collected utilising an Omicron ESCA-II system with Mg-K radiation at 1,253.6 eV in a single channel detection mode. Prior to collecting data, samples A-E are dried in an extremely high vacuum for 12 h at 10–10 mbar. The bands have undergone painstaking calibration with respect to the adventitious-C1s binding energy value of 284.8 eV.The XPS data are obtained using an energy step of 0.05 eV and a dwell duration of 0.2 s at 50W X-ray power. The Casa-XPS programme is then used to evaluate high resolution XPS spectra after de-convoluting the spectra in relation to different components. In order to match each spectrum to its associated Gaussian bands, an iterative least-squares approach is used. Using a confocal Horiba (Labram-Evolution) spectrometer with a 100 m hole-aperture, micro Raman spectra of DMS samples are obtained. At 50% numerical density, a 300 W near infrared (NIR) diode laser (with 785 nm notch filter) is used. The stimulated Raman signal is collected ultra-low frequency geometry (ULF), using 50 long working distance-NIR objective lenses. The spatial and spectral resolutions of the spectrometer are maintained at 2 cm-1 and 1.1 m, respectively. Using an excitation source of a (325 nm) UV He-Cd laser, A Horiba (Labram) spectrometer is also used to acquire confocal photoluminescence (PL) spectra. With a silicon detector, the PL signals are tracked using a confocal hole-aperture of 100 m, which yields a PL spot size of 1.1 m.
Temperature dependence of BMR, which results from differences in electronic mobility and conductivity seen in distinct modes of magneto-transport, is depicted in Figure 1 for pellets A-to-D with respect to a fixed 9 T magnetic field and a 100–350 K temperature range. The positive BMR development creates a spike that is triggered by more cooling, which is followed at 210 K by a high BMR of 8.5% and shows a delayed BMR degrading in proportion to cooling. There is no substantial change in the BMR value with greater cooling below 150 K. Although the BMR value of pure ZnO is higher, this is only true for a small range of temperatures (150 K–230 K), which is not technically significant for spintronic devices at room temperature. Interestingly, magnetic ordering changes can be blamed for the higher BMR values found in the pure sample. Which are frequently generated by lattice disorder, structural distortions, or oxygen vacancies. Emphasis should be placed on O vacancies or other defect sites, can serve as donor polorons as well (F-centers), preferentially trapping itinerants of comparable spin and enhancing conduction and a net localized magnetic moment. In reality, it has been demonstrated that applying an external magnetic field decreases itinerant exchange interaction due to F-centers being singularly aligned, especially at lower carrier concentrations, producing a positive BMR peak (Ovhal et al., 2017) and (Ariyakkani et al., 2017). Therefore, the induction of the spin-split band in pure ZnO may be caused by F-centers (Beltrán et al., 2015). The iron doped ZnO samples B and C, on the other hand, exhibit a negative magneto-resistance behaviour around RT. Sample C had a maximum negative BMR of ∼3.7% at ∼290 K and a steady negative BMR of 1% across the temperature range. A considerable BMR value of 1.5% is detected even at ambient temperature and decays to ∼0.5% at ∼340 K, indicating that magnetic ordering persists even at high temperatures in the absence of any signs of abrupt demagnetization or rising Curie temperature. In Ni doped dilute magnetic semiconductors, carrier ordering and spin polarisation have previously been shown to occur above room temperature (Montes-Valenzuela et al., 2015). The observed room temperature BMR in DMS semiconductors can be attributed to a variety of factors, including the presence of free metal in the form of nanoclusters, related binary phases of iron (II, I) oxides (Fe2O3, FeO) or ferrite (Fe3O4), and more (Ahmed et al., 2012). Non-etheless, the BMR’s crossover with respect to Fe-doped, from being positive at x ≈ 0 and higher x ≈ 10% to being negative in samples with 2.5% Fe > 10%, reveals that BMR is not just barely emerging from the impurity stage, but is instead produced from iron ions replacement in the Zn ion sub lattice of ZnO. Curiously, sample B also exhibits a temperature-dependent crossover in BMR values, a BMR crossover from 0.15% up to −0.5% is found during sample cooling in a magnetic field, as shown by the magnified BMR-curve (red-dotted-line) connected to the figure’s right-abscissa. Furthermore, The sample B BMR curve reveals that, up to 350 K, a sizable proportion of negative BMR consistently persists above room temperature. The BMR of sample B, on the other hand, becomes positive at ≈225 K and reaches a maximum at ≈190 K. The BMR trend of sample D, on the other hand, appears to be comparable to that of the pure sample, with a significant temperature shift of the BMR peak and an early BMR onset omitted. The iron doped sample has a positive BMR of 13.2% throughout a wide range temperature range start at 300 K and reaching a maximum BMR at 240 K. Furthermore, by lowering the temperature to 190 K, BMR steadily decays to less than 4% of its value at 240 K. Therefore, In terms of Fe content, a BMR crossover can be easily identified, and samples with Fe concentrations more than 10% often exhibit positive BMR. In conclusion, based solely on BMR data, the real processes of magnetic ordering in both pure and Fe-doped ZnO are unclear and require further investigation by full flaw analysis utilizing structural, optical and compositional probes.
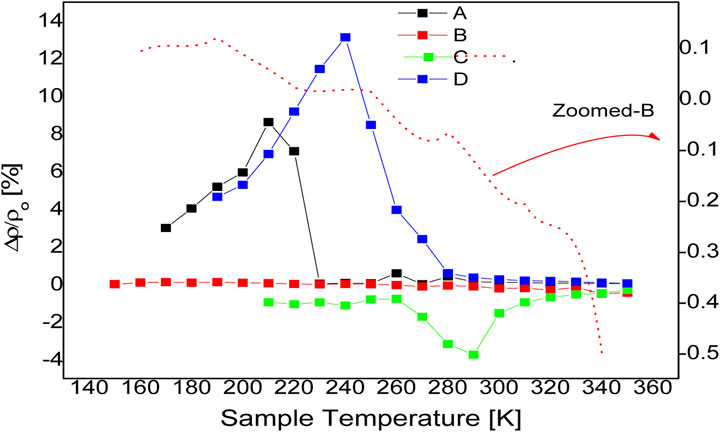
FIGURE 1. Temperature-dependent magnetoresistance studies were conducted for samples (A), a pure ZnO pellet, (B), (C), and (D), which, respectively, might include 2.5%, 5%, and 10% Fe in ZnO, applying resistance measurements during zero-field cooling (zfc) and 9 T-field cooling.
For samples A to E, respectively, the (
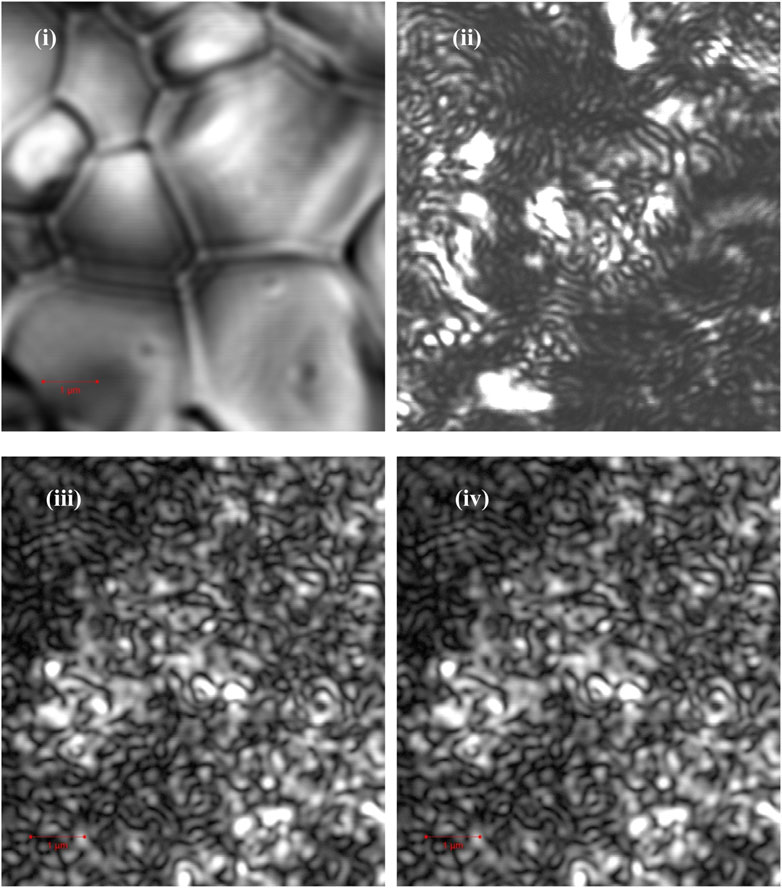
FIGURE 2. Laser confocal scanning microscopy was used to obtain the surface morphology of samples A 1), B 2), D 3), and E 4). The red bar in the graphic corresponds to a length of 1 μm, and each image has the same size.
TM-doped DMS systems underwent micro Raman scattering tests to look for any alloying related structural changes at various doping doses, alterations to the wurtzite structure of ZnO, produced stresses with Fe-ions substitution in the Zn-ions sub-lattice, and unique phonon bands linked to impurities (Lang et al., 2010; Kaur et al., 2014; Das et al., 2015). Furthermore, Cationic and anionic vacancies in the host-interstitial lattice’s ions can be identified using the Raman technique (Fan et al., 2011). Group theory has revealed that the vibrational mode 2E2+E1+A1+2B1 make up the wurtzite structure of ZnO (Space Group. C6v/P3mc), which approximate, respectively, the polar, non-polar (high/low), and silent Raman modes. (Bundesmann et al., 2003). To fully understand the nature of Fe doping in ZnO, a wide range of Raman spectra (200–1,200 cm-1) are obtained for various samples A-F. As the order of Fe content rises, the Raman lines change in Figure 3. Because Fe3+ has a smaller radius than Zn2+, structural distortions in the doped ZnxFe1-xO alloy are unavoidable due to poorer solubility. As a result, at higher doping levels, The Zn sub-lattice can support interstitial Fe3+ ions. Raman peaks can be seen in the ZnO Raman spectra at208,331,381,434,539,581, and 658 cm-1, which are entirely compatible with previously reported vibrational modes for ZnO; A1TO, E2H, E1TO, E1LO/A1LO, 2 (E2H-E2L), and 2E2L modes are among the others (Das et al., 2015; Pazhanivelu et al., 2016). Most doped and pure ZnO spectra have a high intensity Raman peak at 436cm-1. A high frequency non-polar vibrational mode (E2H) is typically responsible for the peak, which is routinely employed to build wurtzite structure in ZnO binaries (Ruan et al., 2012). Fe-dopped in the ZnO sub lattice clearly suppresses the reported E2H vibrational mode, Its peak intensity declines as the Zn/Fe ratio is reduced. Furthermore, with greater Fe > 10%, a wide E2H mode is still active at low intensity, E2H mode indicating the ZnO structure is still in wurtzite form. Furthermore, Due to the crystal’s E2H mode’s sensitivity to the motion of lighter oxygen-ions, broadening of the E2H mode at high frequency and low intensity may indicate a possible decline of ZnO crystal structure. Higher doping levels seem likely to result in the Fe atom acquiring interstitial locations in the cationic sub-lattice of ZnO (Silambarasan et al., 2015). Thus, extra stresses and deformations in the host-wurtzite structural lattice are anticipated. Furthermore, the low frequency and broadening of mode 2E2L peak is seen to fade substantially more quickly even at Fe > 2.5% in response to the aforementioned disorder. Because of a direct Fe2+ replacement in the Zn sub-lattice, the 2E2L seems to be considerably more susceptible to heavier zinc-ion motion. Furthermore, the presence of a second order multi-phonon mode2 (E2H-E2L) in sample A shows high-quality ZnO, While in doped samples, the mode vanishes. For Fe > 10%, a new dopant-related Raman mode appears at 646 cm-1. Bundesmann et al. identified the extra mode as a characteristic mode for Fe that may be utilized to calculate the amount of Fe inclusion in the ZnO host-lattice (Bundesmann et al., 2003). The unique Fe-mode, however, might be related to the presence of either the ferrite Fe3O4 phase or only to the activation of distinctive defect sites in the host-lattice of ZnO (Silambarasan et al., 2015) A doping-related shift in the E1TO mode, located at 539 cm-1, in addition to the usual wurtzite-structural changes discernible from E2H mode behavior, is also observe in the Raman-data in Figure 3. Even if the mode is barely noticeable in samples A and B, sample C with 5% Fe-doping exhibits dramatically increased peak amplification, further more doping lowers the peak, indicating the possibility of changes in the atomic vibrational mode caused by doping. The competitive character of Froehlich contacts and deformation potential driven suppression of Raman modes have been linked to the weak nature of E1TO mode in highly crystalline pure ZnO (Ruan et al., 2012). However, in sample C the causing the strong E1TO mode in the presence of Fe dopant ions, crystal-symmetry is disrupted and the competitive effect of the contacts is diminished. Additionally, the mode disappears once more in samples D, E, and F with rising Fe-doping concentrations >10%, indicating a significant disorder, and the mode ultimately disappears, much as the E2H mode. The shift in E1TO mode has also been attributed by Silambarasan et al. (2015). to a significant number of oxygen-related faults.
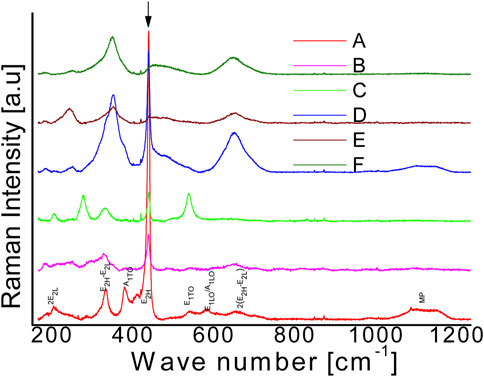
FIGURE 3. Micro Raman spectra taken at ambient temperature for samples (A to F) with varying concentrations of iron in ZnO (0%–50%). The typical phonon modes of the wurtzite ZnO crystal are indicated at the corresponding spectral places in the bottom-most spectrum.
Figure 4 displays the photoluminescence (PL) spectra for all samples (A to F) at room temperature, in highly pure ZnO frequently exhibits a narrow Ultra Violet-blue PL emission band that has been determined to be the result of a near band-edge (NBE) radiative mechanism. Charge carriers being photo-excited from the valance band to the conduction band, generating an exciton (e-h pair), and then radiatively recombining electrons and holes are two possible explanations for the near band-edge NBE emission. Bulk ZnO’s observed UV energy band-gap is 3.3 eV. This has a perfect correspondence with sample A at 377 nm NBE peak location (Cernea et al., 2017). In samples with weak doping, the kind of NBE emission and its location, Fe 10%, C, and D samples matches the un-doped ZnO NBE peak exactly. For larger amount Fe contents >10%, E and F samples, there is a red-shift found, which is demonstrated by a shifted NBE signal position at 390 nm and a decrease in the Zn1-xFexO energy gap of 0.15 eV. Additionally, Figure 4's inset demonstrates how the energy-gap dependence on “x" work. Any change in NBE emission energy is typically proportional to the energy gap Eg of Zn1-xFexO since Fe2O3 has a lower energy gap of 2.5 eV (Schrettle et al., 2012). It is clear that the relationship between Eg and Fe percentage in Zn1-xFexO does not adhere to a typical band-gap dependence of the kind given by Vigard’s formula
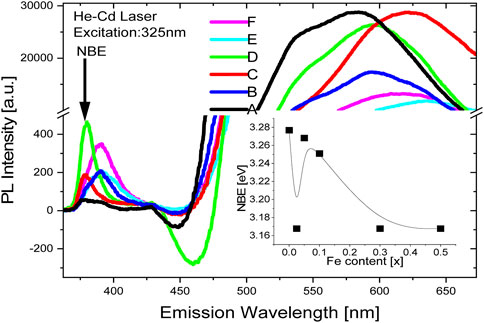
FIGURE 4. Global photoluminescence spectra recorded at 325 nm excitation wave-length for samples (A-F) containing different percentages of iron (0% to 50%) in ZnO. Abscissa-break in PL-intensity elucidates intense and broad luminescence in green-orange band. Vertical arrow and inset figure shows the positions near band edge luminescence from the assorted samples. 4: Global photoluminescence spectra recorded at 325 nm excitation wave-length for les (A–F) containing different percentages of iron (0%–50%) in ZnO. Abscissa-break in PL-intensity elucidates intense and broad luminescence in green-orange band. Vertical arrow and t figure shows the positions near band edge luminescence from the assorted ples.
The intensity and breadth of green-orange luminescence in ZnO samples (A-F) with varying iron concentrations (ranging from 0% to 50%) is revealed by a break in the abscissa. The vertical arrow and accompanying figure indicate the positions of luminescence near the band edge for the different samples.
Both un-doped and Fe-doped samples of ZnO display a broad second peak in photoluminescence (PL) that starts to appear at around 500 nm in emission wavelength. This peak is characterized by a strong emission in the green to yellow luminescence band. It is believed that deep levels or radiative recombination centers of the mid-band-gap defect type are responsible for the wider peak. The green-yellow-orange bands have been found to be caused by various charged oxygen vacancy states, such as singly or doubly ionized Vo, +Vo, ++Vo, interstitial oxygen ions, and shallow surface states (Lang et al., 2010; Kaur et al., 2014). It is common for interstitial-oxygen and hydroxide-surface states to be responsible for the bright yellow-orange energy bands in ZnO, however, it has also been observed that charged oxygen vacancies in ZnO can lead to a green emission (Lang et al., 2010; Kaur et al., 2014). It can be seen from the photoluminescence spectra of Fe-doped ZnO (A–F) that the green-yellow emission is generated with a two-fold increase in intensity compared to the non-doped emission. The high growth temperature, a characteristic of the solid state reaction process, may be one of the possible reasons of the charged oxygen vacancies or deep level states in the samples. The presence of a larger ratio of Fe3+/Fe2+ ions, which promotes interstitial oxygen at shallower levels and the PL shift to a lower energy value of 670 nm, is further supported by the fact that in samples D, E, and F with greater Fe content, the second emission band is continuously moving toward yellow-orange emission. This difference between ‘x' and ‘y' in green-yellow emission and yellow-orange emission can only be explained by a difference between charged oxygen vacancies and interstitial oxygen ions. Additionally, the general decline in mid-gap emission at increasing Fe doping concentration also shows a reduction in oxygen vacancies.
Figure 5; Figure 6 show the X-ray photoelectron spectra of un-doped and Fe-doped ZnO for the Fe-2p and O-1s binding energies. A survey XPS spectrum, not shown, was used to check for the presence of Zn, O, Fe, or any other elemental contaminants in each sample before conducting high-resolution XPS analysis of specific elements. Fe-doped samples display unique bond energies for other three elements, indicating the samples’ high purity as well as the usual accidental C1s peak. The asymmetric binding energy peak in the Fe-2p XPS spectrum is made up of Gaussians that represent the Fe2+ and Fe3+ oxidation states coupled with the related satellite structures should be moved. In the figure, a straight line is drawn to represent a binding energy value of 709.6 eV for comparison. According to published data, 706.70, 709.60, and 710.80 eV, are the binding energies for Fe (metal), FeO (Fe2+), and ferrites Fe2O3 (Fe3+) are respectively (Biesinger et al., 2011). The binding energies for the Fe2+ and Fe3+ oxidation states of Fe-2p (3/2) in sample B are determined to be 709.6 and 710.6 eV, respectively. It is clear that the higher intensity binding energy peak (red) that overlaps the reference line signifies a greater incorporation of the Fe2+ ion as well as the replacement of Zn atoms by Fe in the cationic sub-lattice of ZnO. The diminished presence of Fe3+ in the host-lattice is associated with the latter peak (magenta), which is of lower intensity. Overall, hetero-valent chemical states, including mixed Fe2+ and Fe3+ states, are used to incorporate Fe into the ZnO host-lattice. Furthermore, no Gaussian component is seen near 706 eV, ruling out the possibility of free metal clusters in the samples. Similarly to sample B, sample C exhibits two distinct oxidation states that are connected to binding energies of 709.5 eV (Fe2+) and 710.9 eV (Fe3+). However, the Fe2+/Fe3+ intensity ratio noticeably decreases to 0.5 from 1.8 (Fe = 2.5%) when the Fe-content is increased to 5%, demonstrating that low Fe doping promotes Fe2+ ion substitution in the host lattice. Sample D, and sample F completely lacks the Fe2+ oxidation state, it is clear that Fe inclusion in the ZnO host has changed from Fe2+ to Fe3+. All samples show the shake-up satellite structures as well as Fe-2p binding energies. In Zn1-xFexO systems, satellite peaks at the Fe-2p binding energy have frequently been seen. These peaks result from a limited likelihood of Fe-ion photoelectron excitation to their spin-excited triplet states at energies of a few eV (Biesinger et al., 2011).
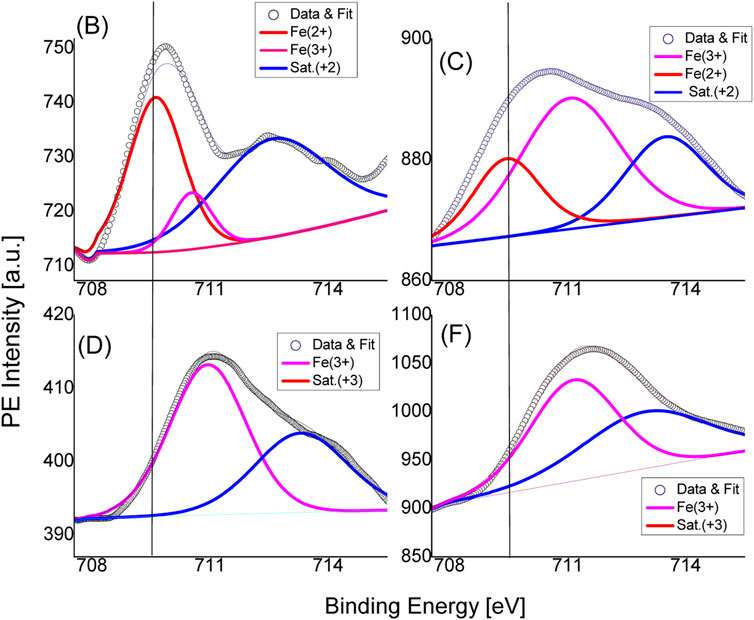
FIGURE 5. Results from X-ray photoelectron spectroscopy for iron-2p electrons, along with their corresponding satellite structures, demonstrate binding energy fluctuations for Fe2+ and Fe3+ oxidation states in a variety of Fe-doped substrates (B–F).
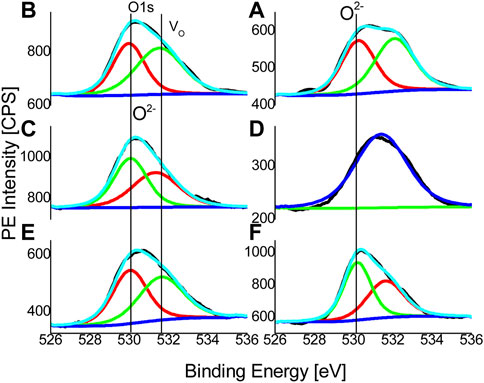
FIGURE 6. The XPS spectra for oxygen-1 s electrons are displayed together with a Gaussian component that has been fitted for oxygen vacancies and the anionic sub-lattice of ZnO, respectively. Metal-oxide and oxygen vacancy states, respectively, are indicated by the vertical lines at ∼530 and ∼532 eV (A–F).
All (A-E) Zn1-xFexO samples between 713 and 714 eV have satellite structures, which are normally isolated from the ground state, verifies the Fe ions’ magnetic properties even more because they are incorporated into the host-lattice (Biesinger et al., 2011). Typically, the satellite structures are shifted from the ground state and observed in between 713 and 714 eV for all Zn1-xFexO samples and their presence further corroborate the magnetic nature of as-incorporated Fe ions in host-lattice.
Figure 6 displays XPS data for O-1s binding-energies together with a reference line, it depicts the position of the observed O-1s (O2-) binding energy of 530 eV for metal-oxides is reported (Nohira et al., 2002). Though, as asymmetrical single peaks, O-1s peaks are found, however from their de-convolutions, which are represented by the red and green colour components of Figure 6, at least two distinct broad and overlapping Gaussian components can be seen (A to F). The first part, which is connected to the oxygen sub lattice, is detected with a little doping-related change of ±0.1 eV at a fixed location of ∼530 eV. The constituent is the O2- (1 s) binding energy that results from oxygen atoms strategically positioned within hexagonal ZnO’s anionic sub lattice. Usually, the component represents a complete nearest-neighbor (NN) (Zn2+ or Fe2+) cationic-coordination of oxygen. Obviously, It is discovered that the second overlapping Gaussian at ∼532.1 eV is more sensitive to compositional changes, which show up in doped samples as both intensity changes and energy position shifts (B to F). Additional, The presence of native oxygen vacancies (Vo) in the oxygen sub-lattice can be attributed to the second Gaussian component. in which the NN cationic-coordination remains incomplete (Lin et al., 2010). Moreover, intensity of the Vo peak in sample B, C, E and F are found to be smaller than the oxygen peak indicative of a general trend of Fe-doping decreasing the percentage of oxygen vacancies. Extraordinarily, the form and position of the binding energy in sample D are relatively similar to those of un doped ZnO, Additionally, the anionic oxygen sub-lattice in sample D appears to have a tiny positive charge because of the abundance of Vo states, which are also known to function as donor states (Lin et al., 2010). Non-convoluting single oxygen peaks, as depicted in Figure 6D, also exhibit the additional charge on oxygen sub-lattice conversely, Fe3+ ions’ occupancy of interstitial sites in the cationic sub-lattice and their promotion of oxygen interstitial defects in the anionic sub-lattice can also be used to explain sample D extraordinary results. In distinction, the Zn-2p binding-energies, which are also included in an additional Supplementary Figure S1, The divalent Zn-2p (3/2) peak location remains fairly consistent around ∼1,022 eV for all un-doped and Fe doped samples, and there appears to be no change in the Zn2+ oxidation state.
Temperature dependence of resistance (R) of ∼ 2 mm thick pellets is shown in Figure 7 (a) for samples A, C and D and in Figure 7 (b) for sample-B. Apparently, all the oxide samples are marked by high resistance with strong temperature dependence, since the nc is strongly dependent on thermal excitation in a typical oxide semiconductor. Especially, samples B and C have unusually higher resistance even at higher kBT values. However, it can be seen from the two slope nature of Figure 7A that all samples, except sample-B, exhibit two distinct regimes of conduction; a relative low R-range (200–350 K) and high R-range (<200K). The onset of high resistance regime, which is indeed the hopping mode of conduction, is found at 221, 298 and 250 K for samples A, C and D, respectively. The conduction regimes are usually assigned to a thermally activated (TA) conduction
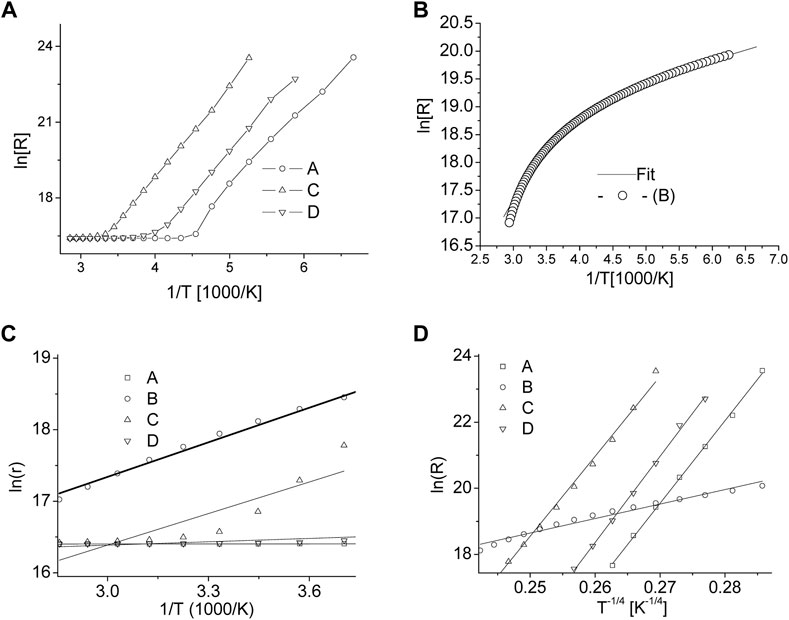
FIGURE 7. (A) Distinctive two-slope logarithmic-dependence of resistivity with sample cooling indicates an early thermally activated conduction which is followed by hopping mode of conduction at lower temperatures. (B) Experimental data and TA mode of conduction fitting for sample-B shows a singular conduction process. (C) Fitting of the temperature experimental data (T ≥ 250 K) with phonon assisted TA mode of conduction also explained in the text. (D) Fitting of the low temperature experimental data (T ≤ 250 K) with variable range hopping conduction model as described in the text.
The VRH model of conduction, as shown in Figure 7 (d), has a good fitness to samples A, C and D at lower temperatures indicating the electronic hopping at lower carrier density. The VRH indicates the freezing of various phonon modes and depopulating the thermally activated carrier states. Quite remarkably, the phonon mediated conduction in sample B remains a dominant conduction mode even at low temperatures < 200 K and exhibits a relatively lower resistance. A complete absence of hoping mode in the sample can be explained by using the character of Fe-substitution in ZnO host-lattice. During initial stages of Zn1-xFexO formation, any Zn-interstitial neutral atoms present in the cationic sub-lattice is ionized to Zn+ or Zn++ by releasing free electrons available for conduction (Sedky et al., 2009). Moreover, the Fe2+ substitution remains dominant for Fe < 5% and any Fe3+ substitution would releases extra electrons by Fe3+ to Fe2+ conversion via a native oxygen formation process;
As shown in Figures 8A–D for samples (A-D), respectively, at 320 K, 250 K, and 200 K different temperature shows the magnetic field dependency on % BMR,
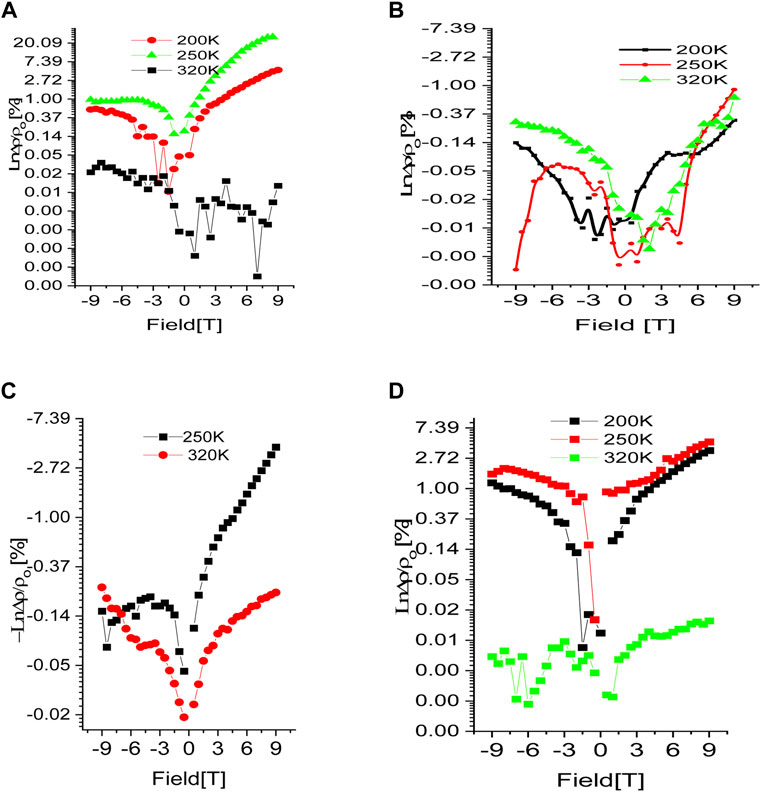
FIGURE 8. Magnetic field dependence of MR in samples (A–D). Noticeably, samples (A, D) show positive MR while samples (B, C) show negative MR.
To analyses our findings, we used a Khosla-MR Fisher’s mode to better understand the peculiar behavior of BMR in respect to doping levels in our samples (B and C). The model predicts that a complete magneto-transport equation be expressed as where decremental- and incremental-BMR are, respectively, represented by the two terms (Hamieh et al., 2015; Lorite et al., 2015; Modepalli et al., 2016; Mukherjee et al., 2017). While, Higher conductivity and greater differential two-band spin split mobility are represented by the incremental fitting parameters (c and d), respectively, while localised moment-itinerant spin scattering and a fourth-order total spin exchange integral are represented by the decremental fitting parameters (a and b), respectively (Modepalli et al., 2016). The experimental BMR data for samples B and C that have been fitted using the model equation are displayed in Figure 9. Table 1 provides a summary of the fitting parameter values that were obtained. Due to the bulk oxide pellets’ normally high resistance, which is in the range of several hundred mega-ohms when they are manufactured, All of the samples have a negligible or zero value for the parameter c. The stronger DBMP (vacancy-donor ordering) effect of the samples leads to the maximum value of negative the maximum negative BMR value of −4% when a magnetic field is applied, which is shown in Figure Figure1 by the large negative BMR peak located between 290 and 250 K temperature range, as shown by the greater values of parameter a, more than any other parameter by at least two orders, particularly at intermediate temperature 250 K. Therefore, the negative value of BMR can be explained by the reduced localized moment itinerant scattering that takes place when a magnetic field is supplied when conduction is in the optimistic mode. Indeed, the larger thermal activation energies are contributing significantly to the phonon mediation’s function in the DBMP production in B and C samples. Considering that sample C 305 K, which is also depicted in Figure 7, has the greatest VRH onset temperature is important at this point (a). In both the higher and lower temperature ranges, the parameter’s strength is shown to diminish. Due to their higher resistivity and lower carrier concentration, samples B and C have lower values for the parameters c and d, which further suggests that any function performed in negative BMR by the Magneto-transport in the two-band spin split mode is quite poor. Based on the aforementioned analysis, it is possible to conclude that Lightly doped (Fe10%) ZnO’s reported negative BMR can be largely ascribed to the donor and vacancy ordering gradually deteriorating with the application of an external magnetic field (DBMP effect). However, the high positive BMR in both pure ZnO and substantially Fe-doped (Fe>10%) ZnO is caused by increased spin scattering of itinerants and field-induced magnetic ordering of either F-centers or Fe atoms with a stronger magnetic field. Our spectroscopic findings for samples with lower Fe concentrations (10%), increased wurtzite character, arousal of a specific phonon mode connected to iron, fine PL spectra line, and lower Fe3+/Fe2+ ratio, Some of the primary reasons contributing to negative BMR via F-center- magnetic dopant coupling - DBMP effect are reduced percentages of O-vacancy resulting in fewer F-centers. While un-doped ZnO devoid of magnetic dopants exhibits positive-BMR. Similar to this, samples with high Fe contents (>10%) show positive BMR. Apart from the lack of unique phonon modes, larger Fe3+ ion presence, lower TA energy, and higher oxygen vacancy states, the heavily Fe-doped ZnO also exhibits these spectroscopic characteristics. At lower Fe doping levels, it is discovered that the electron-transport is dominated by the spin dispersion of the itinerants from localised moments, such as F-centers, magnetic dopant, or DBMP. Negative BMR crossover in Fe-doped ZnO is also caused by spin scattered itinerants.
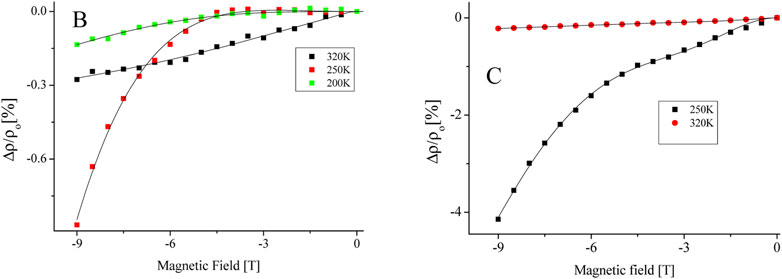
FIGURE 9. Khosla and Fisher model equation selectively (-9T-0T) fitted on experimental data of magnetic field dependence of MR for samples (B, C), which are showing negative MR values.
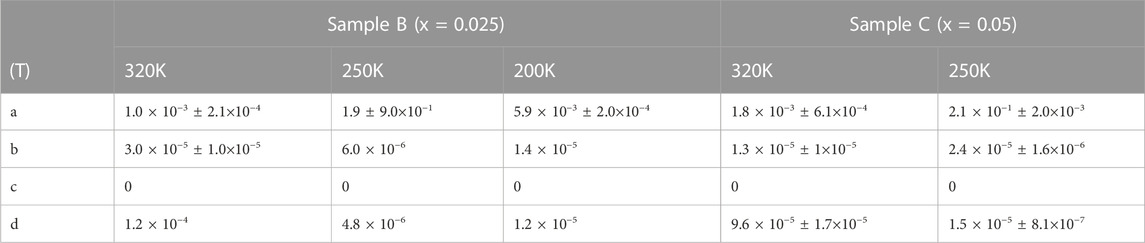
TABLE 1. Table shows parametric values obtained by data fitting using Khosla and Fischer model of magneto-transport and experimental results of magnetoresistance variation in between -9 to 9T magnetic fields. Typical definitions of the fitting parameters a, b, c and d are described in the text.
Several spectroscopic factors are discussed in the manuscript in relation to as-observed positive and negative BMR. The oxygen vacancy, multivalent Fe nature, novel phonon modes, PL emission lines are found to play important role in positive and negative BMR.
• Various compositional alterations the development of structural, luminous, compositional, all Samples of Fe-doped zinc oxide produced by a common solid state reaction technique are examined for their magneto-resistance characteristics.
• A high positive BMR of 14% is observed in samples made with a lot of oxygen vacancies.
• A reduced density of oxygen vacancies is observed in ZnO with lower doping levels (Fe10%).
• Negative BMR’s occurrence, having a significant negative BMR of 4%, is observed to be improved by reducing doping.
• Thermally activated and variable range hoping at low- and high-resistivity, respectively, are two regimes of temperature-dependent electrical conduction that were identified.
• Hoping high resistivity doped samples will display conduction onsets at higher temperatures. The particular Raman pattern indicates a lattice distortion in the wurtzite structure of the ZnO at first, followed by phonon softening and wurtzite disintegration at Fe > 30%. Raman spectra show an additional Fe-related phonon mode at 530 cm-1, which diminishes at higher doping levels (Fe > 10%).
• As-prepared samples always have the distinctive NBE emission peak of ZnO in their PL spectra. However, by raising the Fe content, the peak is redshifted. In addition to the NBE, all samples show a strong mid-gap luminescence.
• The band in pure ZnO is attributed to the existence of big oxygen-vacancy states.
• The broad band is connected to a larger fraction of Fe interstitials at higher Fe concentrations. Chemical states of multivalent iron
Moreover, several mechanisms of as-found BMRs and their crossovers are discussed.
The original contributions presented in the study are included in the article/Supplementary Material, further inquiries can be directed to the corresponding authors.
NI, MS, LA, WS, AA, SE, AA-J, AS, and JM contributed in initial design and modeling of problem. LA, WS, AA, and SE contributed for graphical analysis of the current study by plotting new graphs, AA-J, AS, and JM also re-confirmed/verify the mathematical modeling and computationse. NI, MS, LA, WS, and AA also contributed in revising Abstract, Introduction, results and discussion and conclusion.
The authors declare that the research was conducted in the absence of any commercial or financial relationships that could be construed as a potential conflict of interest.
All claims expressed in this article are solely those of the authors and do not necessarily represent those of their affiliated organizations, or those of the publisher, the editors and the reviewers. Any product that may be evaluated in this article, or claim that may be made by its manufacturer, is not guaranteed or endorsed by the publisher.
The Supplementary Material for this article can be found online at: https://www.frontiersin.org/articles/10.3389/fmats.2023.1112798/full#supplementary-material
Ahmed, F., Kumar, S., Arshi, N., Anwar, M. S., and Koo, B. H. (2012). Morphological evolution between nanorods to nanosheets and room temperature ferromagnetism of Fe-doped ZnO nanostructures. CrystEngComm 14, 4016–4026. doi:10.1039/c2ce25227a
Ariyakkani, P., Suganya, L., and Sundaresan, B. (2017). Investigation of the structural, optical and magnetic properties of Fe doped ZnO thin films coated on glass by sol-gel spin coating method. J. Alloys Compd. 695, 3467–3475.
Balamurugan, S. (2012). Syntheses and magnetic-properties of Zn-diluted Sr-based perovskite cobalt oxides, Sr1-xZnxCoO3; 0.05? x? 0.3. J. Supercond. Nov. magnetism 25, 1603–1609. doi:10.1007/s10948-012-1488-2
Beltrán, J. J., Barrero, C. A., and Punnoose, A. (2015). Understanding the role of iron in the magnetism of Fe doped ZnO nanoparticles. Phys. Chem. Chem. Phys. 17, 15284–15296. doi:10.1039/c5cp01408e
Biesinger, M. C., Payne, B. P., Grosvenor, A. P., Lau, L. W. M., Gerson, A. R., and Smart, R. S. C. (2011). Resolving surface chemical states in XPS analysis of first row transition metals, oxides and hydroxides: Cr, Mn, Fe, Co and Ni. Appl. Surf. Sci. 257, 2717–2730. doi:10.1016/j.apsusc.2010.10.051
Borges, R. P., Ribeiro, B., Costa, A. R. G., Silva, C., da Silva, R. C., Evans, G., et al. (2011). Magnetic and transport properties of transition-metal implanted ZnO single crystals. Eur. Phys. J. B-Condensed Matter Complex Syst. 79, 185–195. doi:10.1140/epjb/e2010-10512-3
Bundesmann, C., Ashkenov, N., Schubert, M., Spemann, D., Butz, T., Kaidashev, E. M., et al. (2003). Raman scattering in ZnO thin films doped with Fe, Sb, Al, Ga, and Li. Appl. Phys. Lett. 83, 1974–1976. doi:10.1063/1.1609251
Can, M. M., Shawuti, S., Fırat, T., and Shah, S. I. (2016). Experimentally tailoring sd and pd interactions in spin polarization via post deposition annealing conditions. J. Alloys Compd. 660, 423–432. doi:10.1016/j.jallcom.2015.11.063
Cernea, M., Mihalache, V., Secu, E. C., Trusca, R., Bercu, V., and Diamandescu, L. (2017). Structural, morphological, ferromagnetic and photoluminescence properties of Fe-doped ZnO, prepared by hydrothermal route. Superlatt. Microstruc. 104, 362–373.
Chattopadhyay, S., Panda, J., and Nath, T. K. (2013). Enhanced temperature dependent junction magnetoresistance in La0. 7Sr0. 3MnO3/Zn (Fe, Al) O carrier induced dilute magnetic semiconductor junctions. J. Appl. Phys. 113, 194501. doi:10.1063/1.4805052
Das, J., Mishra, D. K., Srinivasu, V. V., Sahu, D. R., and Roul, B. K. (2015). Photoluminescence and Raman studies for the confirmation of oxygen vacancies to induce ferromagnetism in Fe doped Mn_ZnO compound. J. Magn. Magn. Mater. 382, 111–116.
Fabbiyola, S., Kennedy, L. J., Ratnaji, T., Vijaya, J. J., Aruldoss, U., and Bououdina, M. (2016). Effect of Fe-doping on the structural, optical and magnetic properties of ZnO nanostructures synthesised by co-precipitation method. Ceramics Inter. 42 (1), 1588–1596.
Fan, D., Zhang, R., and Wang, X. (2011). Effect of phosphorus incorporation on the morphology and optical properties of ZnO nanorods. Mater. Res. Bullet. 46 (4), 596–600.
Gacic, M., Jakob, G., Herbort, C., Adrian, H., Tietze, T., Brück, S., et al. (2007). Magnetism of Co-doped ZnO thin films. Phys. Rev. B 75, 205206. doi:10.1103/physrevb.75.205206
Hamieh, M., Jedrecy, N., Hebert, C., Demaille, D., and Perriere, J. (2015). Ferromagnetism and magnetoresistance of nanocomposite ZnO-Co thin films. Phys. Rev. B 92, 155302. doi:10.1103/physrevb.92.155302
Han, S. J., Song, J. W., Yang, C.-H., Park, S. H., Park, J.-H., Jeong, Y. H., et al. (2002). A key to room-temperature ferromagnetism in Fe-doped ZnO: Cu. Appl. Phys. Lett. 81, 4212–4214. doi:10.1063/1.1525885
Hsu, C. Y., Huang, J-C. A., Chen, S. F., Liu, C. P., Sun, S. J., and Tzeng, Y. (2008). Tunable magnetic order of Co nanoparticles and magnetotransport in Co/Zn O nanocomposites. Appl. Phys. Lett. 93, 072506. doi:10.1063/1.2959081
Jansson, F., Wiemer, M., Nenashev, A. V., Petznick, S., Klar, P. J., Hetterich, M., et al. (2014). Large positive magnetoresistance effects in the dilute magnetic semiconductor (Zn, Mn) Se in the regime of electron hopping. J. Appl. Phys. 116, 083710. doi:10.1063/1.4894236
Jaquez, M., Yu, K. M., Ting, M., Hettick, M., Sanchez-Royo, J. F., Welna, M., et al. (2015). Growth and characterization of ZnO1- xSx highly mismatched alloys over the entire composition. J. Appl. Phys. 118, 215702. doi:10.1063/1.4936551
Kaur, J., Kotnala, R. K., Gupta, V., and Verma, K. C. (2014). Anionic polymerization in Co and Fe doped ZnO: Nanorods, magnetism and photoactivity. Curr. Appl. Phy. 14 (5), 749–756.
Kumar, S., Tiwari, N., Jha, S. N., Chatterjee, S., Bhattacharyya, D., Sahoo, N. K., et al. (2015). Insight into the origin of ferromagnetism in Fe-doped ZnO diluted magnetic semiconductor nanocrystals: An EXFAS study of local structure. RSC Adv. 5, 94658–94669. doi:10.1039/c5ra12828e
Lang, J., Han, Q., Li, C., Yang, J., Li, X., Yang, L., et al. (2010). Effect of Mn doping on the microstructures and photoluminescence properties of CBD derived ZnO nanorods. Appl. Surf. Sci. 256 (11), 3365–3368.
Lee, S., Park, J. H., Kim, W-K., Dal Park, H., Lee, B. C., Moriyoshi, C., et al. (2016). Control of magneto-transport characteristics of Co-doped ZnO by electron beam irradiation. RSC Adv. 6 (47), 41067–41073.
Lin, F., Jiang, D., and Ma, X. (2010). The influence of annealing on the magnetism of Fe-doped ZnO prepared by mechanical alloying. Physica B: Condensed Matt. 405 (6), 1466–1469.
Liu, H., and Guyot-Sionnest, P. (2015). Magnetoresistance of manganese-doped colloidal quantum dot films. J. Phys. Chem. C 119, 14797–14804. doi:10.1021/acs.jpcc.5b01964
Liu, H., Yang, J., Hua, Z., Liu, Y., Yang, L., Zhang, Y., et al. (2011). Cu-doping effect on structure and magnetic properties of Fe-doped ZnO powders. Mater. Chem. Phy. 125 (3), 656–659.
Lorenz, M., Rao, M. R., Venkatesan, T., Fortunato, E., Barquinha, P., Branquinho, R., et al. (2016). The 2016 oxide electronic materials and oxide interfaces roadmap. Appl. Phy. 49 (43), 433001.
Lorite, I., Zandalazini, C., Esquinazi, P., Spemann, D., Friedländer, S., Pöppl, A., et al. (2015). Study of the negative magneto-resistance of single proton-implanted lithium-doped ZnO microwires. J. Phy.: Condensed Matt. 27 (25), 256002.
Lv, M., Wang, H., Xu, Y., Yu, G., Zhang, H., Lin, T., et al. (2015). Long phase coherence length and anisotropic magnetoresistance in MgZnO thin film. J. Appl. Phys. 117, 155304. doi:10.1063/1.4918541
Mihalache, V., Cernea, M., and Pasuk, I. (2017). Relationship between ferromagnetism and, structure and morphology in un-doped ZnO and Fe-doped ZnO powders prepared by hydrothermal route. Curr. Appl. Phys. 17 (8), 1127–1135.
Modepalli, V., Jin, M-J., Park, J., Jo, J., Kim, J. H., Baik, J. M., et al. (2016). Gate-tunable spin exchange interactions and inversion of magnetoresistance in single ferromagnetic ZnO nanowires. ACS Nano 10, 4618–4626. doi:10.1021/acsnano.6b00921
Montes-Valenzuela, I., Romero-Paredes, G., Vázquez-Agustín, M. A., Baca-Arroyo, R., and Peña-Sierra, R. (2015). Synthesis and characterization of nanostructured magnetoresistive Ni doped ZnO films. Mater. Sci. Semicon. Process. 37, 185–189.
Mukherjee, J., Mannam, R., and Rao, M. S. R. (2017). Variable range hopping crossover and magnetotransport in PLD grown Sb doped ZnO thin film. Semicond. Sci. Technol. 32, 045008. doi:10.1088/1361-6641/aa5fcc
Nohira, H., Tsai, W., Besling, W., Young, E., Petry, J., Conard, T., et al. (2002). Characterization of ALCVD-Al 2 O 3 and ZrO 2 layer using X-ray photoelectron spectroscopy. J. non-crystalline solids 303, 83–87. doi:10.1016/s0022-3093(02)00970-5
Ovhal, M. M., Kumar, A. S., Khullar, P., Kumar, M., and Abhyankar, A. C. (2017). Photoluminescence quenching and enhanced spin relaxation in Fe doped ZnO nanoparticles. Mater. Chem. Phy. 195, 58–66.
Pazhanivelu, V., Selvadurai, A. P. B., Kannan, R., and Murugaraj, R. (2016). Room temperature ferromagnetism in Ist group elements codoped ZnO_Fe nanoparticles by co-precipitation method. Physica B: Condensed Matt. 487, 102–108.
Peters, J. A., Parashar, N. D., Rangaraju, N., and Wessels, B. W. (2010). Magnetotransport properties of InMnSb magnetic semiconductor thin films. Phys. Rev. B 82, 205207. doi:10.1103/physrevb.82.205207
Petukhov, A. G., and Foygel, M. (2000). Bound magnetic polaron hopping and giant magnetoresistance in magnetic semiconductors and nanostructures. Phys. Rev. B 62, 520–531. doi:10.1103/physrevb.62.520
Qiu, H., Meyer, B., Wang, Y., and Wöll, C. (2008). Ionization energies of shallow donor states in ZnO created by reversible formation and depletion of H interstitials. Phys. Rev. Lett. 101, 236401. doi:10.1103/physrevlett.101.236401
Quan, Z., Liu, X., Song, Z., and Xu, X. (2016). Magnetism and magnetoresistance from different origins in Co/ZnO_Al granular films. Physica B: Condensed Matt. 502, 16–20.
Ruan, H. B., Fang, L., Qin, G. P., Wu, F., Yang, T. Y., Li, W. J., et al. (2012). Raman scattering and electrical properties of Zn1?xMnxO films. J. Alloys Comp. 531, 77–81.
Saikia, D., Raland, R. D., and Borah, J. P. (2016). Influence of Fe doping on the structural, optical and magnetic properties of ZnS diluted magnetic semiconductor. Physica E: Low-Dimen. Sys. Nanostruc. 83, 56–63.
Salem, M., Akir, S., Ghrib, T., Daoudi, K., and Gaidi, M. (2016). Fe-doping effect on the photoelectrochemical properties enhancement of ZnO films. J. Alloys Comp. 685, 107–113.
Sapkota, K. R., Chen, W., Maloney, F. S., Poudyal, U., and Wang, W. (2016). Magnetoresistance manipulation and sign reversal in Mn-doped ZnO nanowires. Sci. Rep. 6, 35036. doi:10.1038/srep35036
Schrettle, F., Kant, C., Lunkenheimer, P., Mayr, F., Deisenhofer, J., and Loidl, A. (2012). Wüstite: Electric, thermodynamic and optical properties of FeO. Eur. Phys. J. B-Condensed Matter Complex Syst. 85, 164–212. doi:10.1140/epjb/e2012-30201-5
Sedky, A., Al-Sawalha, A., and Yassin, A. M. (2009). Enhancement of electrical conductivity by Al-doped ZnO ceramic varistors. Phys. B Condens. Matter 404, 3519–3524. doi:10.1016/j.physb.2009.05.054
Sedky, A., and Kotb, H. M. (2013). Possible two non-linear regions in the I-V characteristics of ZnO varistors. Curr. Appl. Phy. 13 (9), 2117–2122.
Shi, G. A., Stavola, M., Pearton, S. J., Thieme, M., Lavrov, E. V., and Weber, J. (2005). Hydrogen local modes and shallow donors in ZnO. Phys. Rev. B 72, 195211. doi:10.1103/physrevb.72.195211
Silambarasan, M., Saravanan, S., and Soga, T. (2015). Effect of Fe-doping on the structural, morphological and optical properties of ZnO nanoparticles synthesized by solution combustion process. Physica E: Low-dimensional. Sys. Nanostruc. 71, 109–116.
Venkatesh, S., Baras, A., Lee, J.-S., and Roqan, I. S. (2016). The magnetic ordering in high magnetoresistance Mn-doped ZnO thin films. AIP Adv. 6, 035019. doi:10.1063/1.4944954
Wang, X. L., Shao, Q., Zhuravlyova, A., He, M., Yi, Y., Lortz, R., et al. (2015). Giant negative magnetoresistance in manganese-substituted zinc oxide. Sci. Rep. 5, 9221. doi:10.1038/srep09221
Wang, Y., Luo, X., Tseng, L-T., Ao, Z., Li, T., Xing, G., et al. (2015). Ferromagnetism and crossover of positive magnetoresistance to negative magnetoresistance in Na-Doped ZnO. Chem. Mater. 27, 1285–1291. doi:10.1021/cm504261q
Keywords: magnetoresistance, zinc-oxide, Raman, luminescence, x-ray spectroscopy (EDXS)
Citation: Ali L, Shah WH, Ali A, Eldin SM, Al-Jaafary AA, Sedky A, Mazher J, Imran N and Sohail M (2023) Investigation of bulk magneto-resistance crossovers in iron doped zinc-oxide using spectroscopic techniques. Front. Mater. 10:1112798. doi: 10.3389/fmats.2023.1112798
Received: 30 November 2022; Accepted: 24 January 2023;
Published: 09 February 2023.
Edited by:
Safia Akram, National University of Sciences and Technology, PakistanReviewed by:
Salman Saleem, King Khalid University, Saudi ArabiaCopyright © 2023 Ali, Shah, Ali, Eldin, Al-Jaafary, Sedky, Mazher, Imran and Sohail. This is an open-access article distributed under the terms of the Creative Commons Attribution License (CC BY). The use, distribution or reproduction in other forums is permitted, provided the original author(s) and the copyright owner(s) are credited and that the original publication in this journal is cited, in accordance with accepted academic practice. No use, distribution or reproduction is permitted which does not comply with these terms.
*Correspondence: Liaqat Ali, bGlhcWF0cGh5MTdAZ21haWwuY29t; Wiqar H. Shah, d2lxYXIuaHVzc2FpbkBpaXUuZWR1LnBr
Disclaimer: All claims expressed in this article are solely those of the authors and do not necessarily represent those of their affiliated organizations, or those of the publisher, the editors and the reviewers. Any product that may be evaluated in this article or claim that may be made by its manufacturer is not guaranteed or endorsed by the publisher.
Research integrity at Frontiers
Learn more about the work of our research integrity team to safeguard the quality of each article we publish.