 Fengjiang Qin
 Zhipeng Huang1
 Zhichao Zheng
 Yang Zou
95% of researchers rate our articles as excellent or good
Learn more about the work of our research integrity team to safeguard the quality of each article we publish.
Find out more
ORIGINAL RESEARCH article
Front. Mater. , 20 February 2023
Sec. Structural Materials
Volume 10 - 2023 | https://doi.org/10.3389/fmats.2023.1110232
This article is part of the Research Topic Advanced Concretes and Their Structural Applications-Volume II View all 15 articles
The shear behavior of shear connectors in steel-concrete composite structures mainly depends on its load-slip relationship. The load-slip relationship not only reflects the shear capacity and slip capacity of the shear connectors, but also the degradation of shear stiffness during loading. In this study, fifteen push-out tests were carried out to investigate the load-slip relationship of the novel bearing-shear (B-S) connectors, which consist of pressuring-bearing plates and shear plates. Based on push-out tests, the influence of the shape and height of the pressure-bearing plate, and the shear plate shape on the load-slip relationship of the B-S connectors was analyzed. Then, an effective finite element model, validated by push-out tests, was used to study the influence of the concrete strength, and the thickness and tensile strength of the shear plate on the load-slip relationship of B-S connectors. Finally, based on the push-out tests, numerical analysis and theoretical analysis, an analytical model expressing the load-slip relationship of the B-S connectors was proposed.
Prefabricated steel-concrete composite beams have been widely applied to the new construction of composite bridges and the replacement of deteriorated bridges decks due to their advantages of improving the construction quality, speeding up the construction and reducing the impact on the surrounding environment during construction (Shim et al., 2000; Shim et al., 2001). For prefabricated composite beams, shear connectors are usually installed in the shear pockets of the precast concrete decks. To ensure the integrity of the precast concrete decks and to avoid the intersection between the shear connectors and reinforcing bars in the shear pockets, the shear pockets should be as small as possible (Yu, 2020). For prefabricated composite beams with a large shear force at the steel beam-concrete slab interface, the grouped stud connectors need to be densely arranged in the shear pockets, resulting in the spacing between the studs is less than the specification requirements, which would reduce the shear capacity and shear stiffness per stud connector (Yu, 2020). In response to the above problems, Zou et al. (2021) proposed a novel bearing-shear (B-S) connectors to replace the grouped stud connectors in fabricated composite bridges. Figure 1 shows the structure of the B-S connectors and their application in prefabricated composite beams.
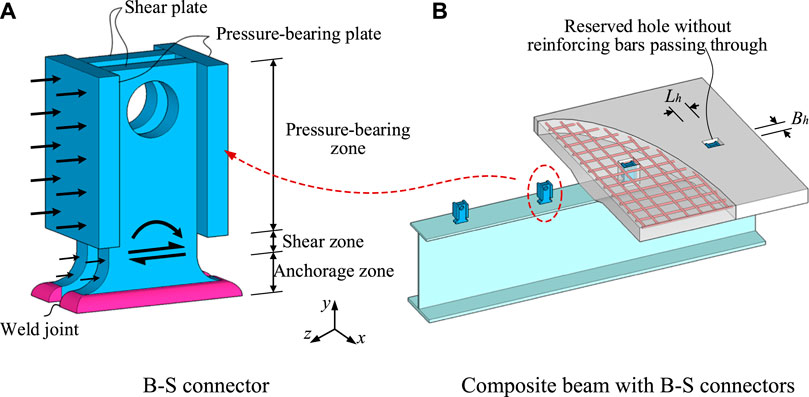
FIGURE 1. Steel-precast concrete slab composite beam structural system (Zou et al., 2021). (A) B-S connector. (B) Composite beam with B-S connectors.
According to the theory of partial shear connection, the load of steel-concrete composite beams is redistributed among the concrete slabs, steel beams and shear connectors in the plastic stage (Ranzi et al., 2004; Xue et al., 2008). The composite action of the steel beam and concrete slab in composite structures is directly influenced by the mechanical properties of the shear connectors (Zou et al., 2023; Zou et al., 2023). The shear behavior of shear connectors in composite structures mainly depends on their load-slip relationship. To accurately analyze the ultimate flexural performance of the composite beams, it is necessary to derive the load-slip relationship of the B-S connectors.
Fifteen push-out tests were conducted to analyze the influence of the shape and height of the pressure-bearing plate, and the shear plate shape on the load-slip relationship of the B-S connectors. However, the data obtained from the push-out tests were limited. Thus, an effective 3D finite element (FE) model was established to analyze the influence of the concrete strength, and the thickness and tensile strength of the shear plate on the load-slip relationship of the B-S connectors (Guo et al., 2022; Hosseinpour et al., 2022; Lima et al., 2022; Wang et al., 2022). Then, based on the results of experiments and numerical analysis, the characteristics of the load-slip curves were analyzed mathematically. Finally, an analytical model was suggested to express the load-slip relationship of the B-S connectors.
In this study, a total five groups of fifteen push-out specimens were performed to explore the shear behavior of the B-S connectors. These test specimens were manufactured based on the recommendations of Eurocode 4 (EN1992-1-4: Eurocode 4. Design of composite steel and concrete structures, 2004). The B-S connector is processed as follows: As shown in Figure 1A, the B-S connector had a simple structure and was composed of a pressure-bearing plate and a shear plate. The pressure-bearing plate and shear plate are fabricated from easily obtainable conventional steel plate and could be connected by fillet welding without special welding equipment in the factory. The weld leg length of fillet welding was 16 mm. Then, the B-S connectors are welded to the steel beams by full penetration welds.
Figures 2A, B shows the configuration and dimensions of the typical push-out test specimen BS-r20-r120, respectively. The naming rules of the push-out specimen as follows: “BS” represents the B-S connector, “r20” represents the radium of the shear plate as 20; “h120” represents the height of the pressure-bearing plate as 120. Each specimen consists of two precast concrete slabs, two B-S connectors and an H-steel beam. A 20 mm thick steel plate was welded to the top of the H-steel beam to distribute the load from the hydraulic jack. Each precast concrete slab has a shear pocket (120 × 140 mm) for the B-S connector. Such a small space ensures that the shear pocket has no reinforcing bars. After the steel beam and precast concrete slabs were positioned, high-strength non-shrinkage mortar was poured into the shear pocket to connect the precast concrete slabs and steel beam.
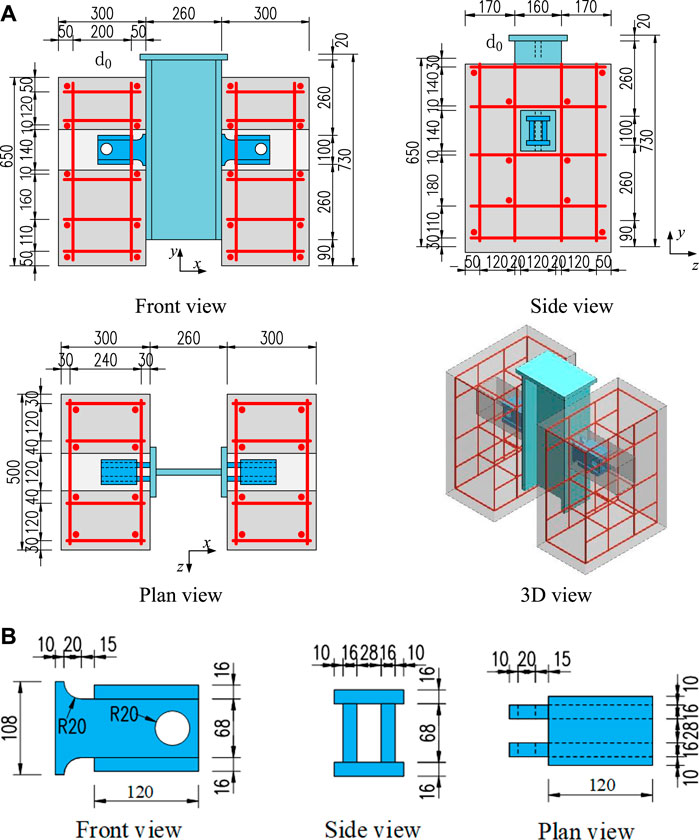
FIGURE 2. (A) Configuration and dimensions of the specimen BS-r20-h120 (mm) (Zou et al., 2021). (B) Configuration and dimensions of the connector BS-r20-h120 (mm) (Zou et al., 2021).
Table 1 presents the mechanical properties of steel and concrete in all push-out tests (Zou et al., 2021). Steel beams and bearing-pressure plates were made of Q345, and shear plates were made of Q420. HRB400 was used in the reinforcing bars. Figure 3A shows the mechanical properties tests of steel and concrete. Steel beams, B-S connectors and reinforcing bars were tested according to GB/T 228-2010 (Metallic materials Tensile testing-Part 1, 2010). Six concrete cube standard samples (150 × 150 × 150 mm) were prepared to test concrete mechanical properties after 28 days of air curing according to GB/T 50107-2010 (Standard for evaluation of concrete compressive strength, 2010).
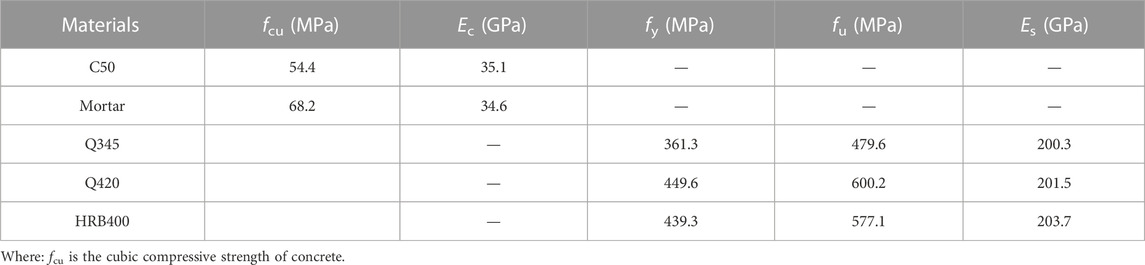
TABLE 1. Material properties of concrete and steel (Zou et al., 2021).
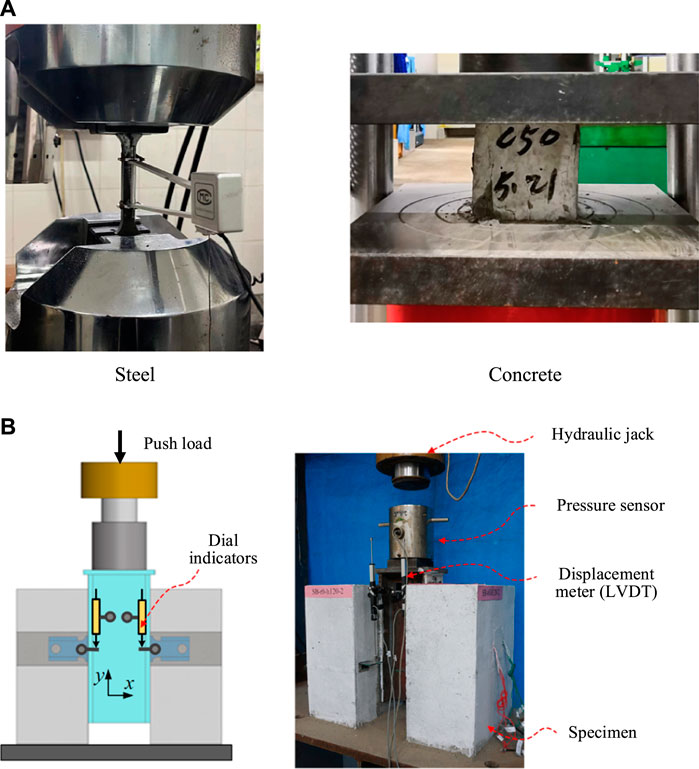
FIGURE 3. (A) Material properties tests. (B) Test setup and instrumentation (Zou et al., 2021).
As shown in Figure 3B, a total of four LVDTs (Linear Variable Displacement Transducer) were symmetrically arranged on the push-out test specimens and ensured that the four LVDTS and the center of the two B-S connectors were at the same height. Then, the average value of the four displacement meters was taken as the relative slip of at the steel beam-concrete slab interface. The load on the specimens can be recorded directly from the pressure sensor attached to the hydraulic jack.
To meet the requirements of quasi-static static load, in accordance with Eurocode 4 (EN 1992-1-4, Design of composite steel and concrete structures, 2005), the loading time of each specimen was not less than 15 min. No. 1 specimens of each group were monotonously loaded, and No. 2 and No. 3 specimens of each group were cyclically loaded. The detailed loading protocol can be referred to the previous push-out tests (Zou et al., 2021).
As shown in Figure 4, the failure modes of the B-S connectors specimens were mainly characterized by the concrete slab splitting and shear failure of the shear plate. Figure 4A shows the cracks distribution of the concrete slabs after tests. The cracks in the concrete slabs first occurred near the B-S connectors and then gradually extended to the top and bottom of the concrete slab. As shown in Figure 4B, significant shear deformation and even a local fracture were observed in the shear plates, whereas no visible deformation was observed in the pressure-bearing plates.
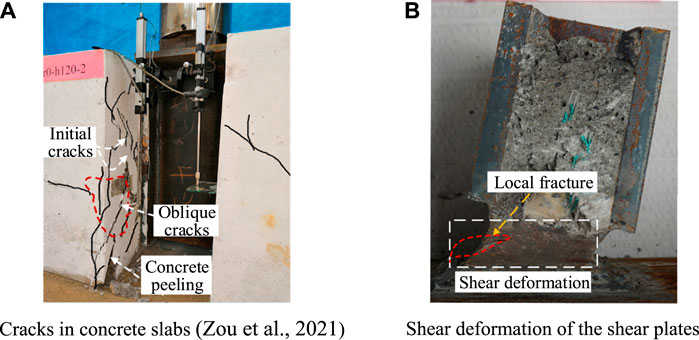
FIGURE 4. Failure modes of push-out test specimen (BS-r20-h120). (A) Cracks in concrete slabs (Zou et al., 2021) (B) Shear deformation of the shear plates.
Figure 5 shows the load transfer mechanism of the B-S connectors. When the composite beam is loaded, the pressure-bearing plates transfer the compressive force from the concrete slab to the shear plates, and finally the weld at the root of the shear plates transfers the load to the steel beam. By controlling that the shear zone strength is smaller than that of the anchorage zone and the pressure-bearing zone
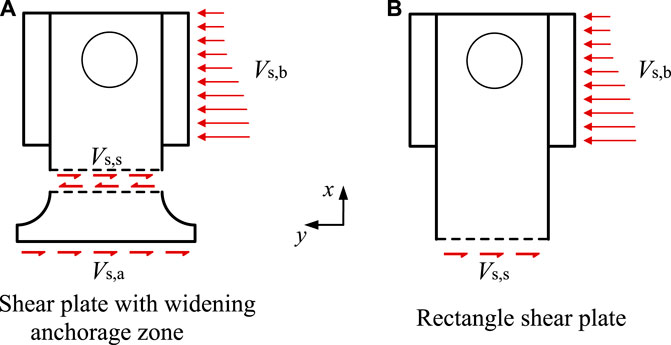
FIGURE 5. Shear mechanism (Zou et al., 2021). (A) Shear plate with widening anchorage zone (B) Rectangle shear plate.
As shown in Figure 6, five groups of B-S connectors with different geometric shapes exhibited the similar load-slip curves. The typical load-slip curve of B-S connectors can be separated into three phases: a linear-elastic phase with little relative slip, followed by a non-linear phase with a decreasing slope and ended with a smooth declining phase. The main mechanical characteristics of the B-S connectors include the shear capacity (Pu), shear stiffness (Ks), peak slip (Su) and ultimate slip (S0.9), as presented in Table 2.
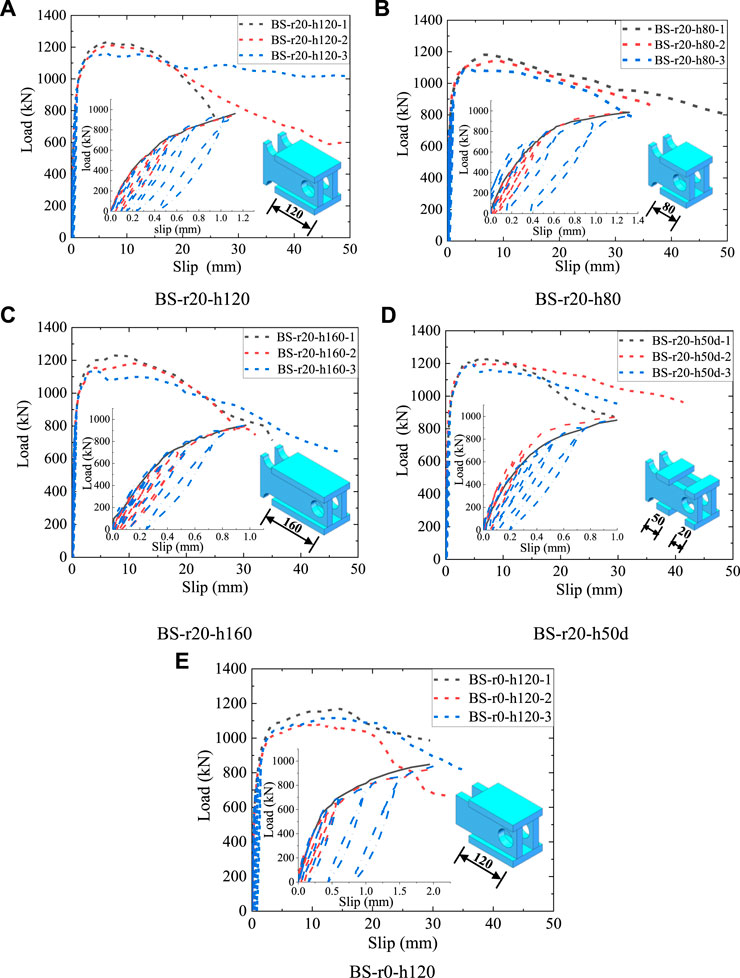
FIGURE 6. Load-slip curves of specimens. (A) BS-r20-h120 (B) BS-r20-h80 (C) BS-r20-h160 (D) BS-r20-h50d (E) BS-r0-h120.
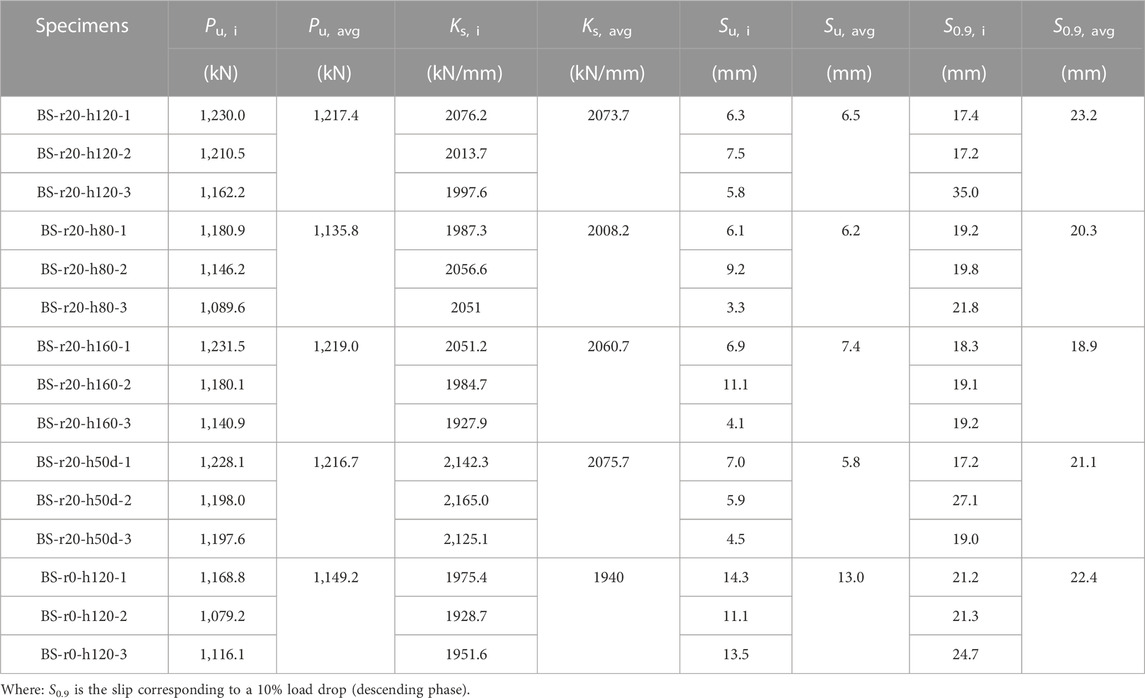
TABLE 2. Experiments results.
The initial shear stiffness Ks reflects the ability of B-S connectors to resist shear slip deformation at the initial elastic phase, but it does not reflect the stiffness evolution process once the connectors are loaded and plastically deformed. The secant slope P/S of the load-slip curve reflects the continuous stiffness evolution of the B-S connectors. Taking the slip ratio S/Su as the X-axis, and the stiffness ratio (Ks/P/S) as the Y-axis, the relationship between the stiffness ratio (Ks/P/S) and the slip ratio (S/Su) of the B-S connectors was presented in Figure 7. It could be found that the stiffness evolution curves of the five groups of the B-S connectors with different geometric shapes were approximately parabolic in shape.
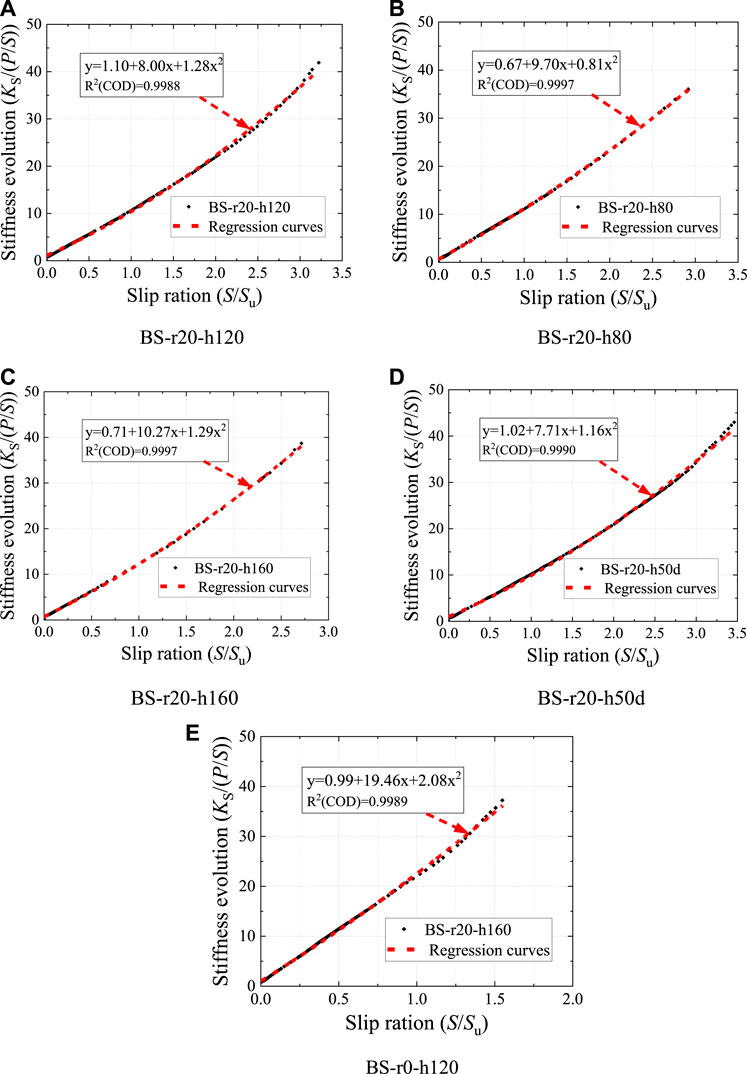
FIGURE 7. Stiffness evolution of specimens. (A) BS-r20-h120 (B) BS-r20-h80 (C) BS-r20-h160 (D) BS-r20-h50d (E) BS-r0-h120.
As shown in Figure 8, based on the experimental results, the typical load-slip curve of the B-S connectors can be separated into three phases.
1) Elastic phase
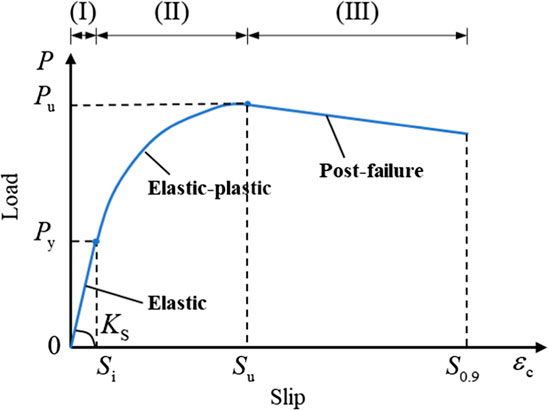
FIGURE 8. Phase identifications.
When the relative slip did not exceed the initial slip Si, the load-slip curve followed the linear elastic relationship. Based on the experimental results, the initial slip (Si) of was about 0.2 mm and the corresponding load was the yield capacity (Py) (Zheng et al., 2016), which was approximately 30%–40% of the shear capacity (Pu). It indicated that the shear stiffness, determined by the secant modulus corresponding to the relative slip of 0.2 mm in this study, was close to that determined by the secant modulus corresponding to 1/3 Pu in (JCSE, 1996). Greater shear stiffness means that the shear load increases faster as the relative slip increases.
2) Elastic-plastic phase
In the second non-linear elastic-plastic phase, the shear load continued to increase until the peak load (Pu). The scant modulus (P/S) decreased as the slip (S) increased. The non-linear phase (in the ascending phase) of the load slip-curves revealed plastic deformation in the concrete slabs and the B-S connectors. The unique peak load at this phase was determined as the shear capacity (Pu), and the corresponding slip was determined as the peak slip Su.
3) Post-failure phase
In the final slowly descending phase, the shear load (P) gradually decreased as the relative slip S increased. As presented in Table 3, the ultimate slip (S0.9) ranged from 17.2 mm to 35.0 mm, far exceeding the 6 mm requirements for ductile connections in Eurocode 4 (EN 1992-1-4, Design of composite steel and concrete structures, 2004).
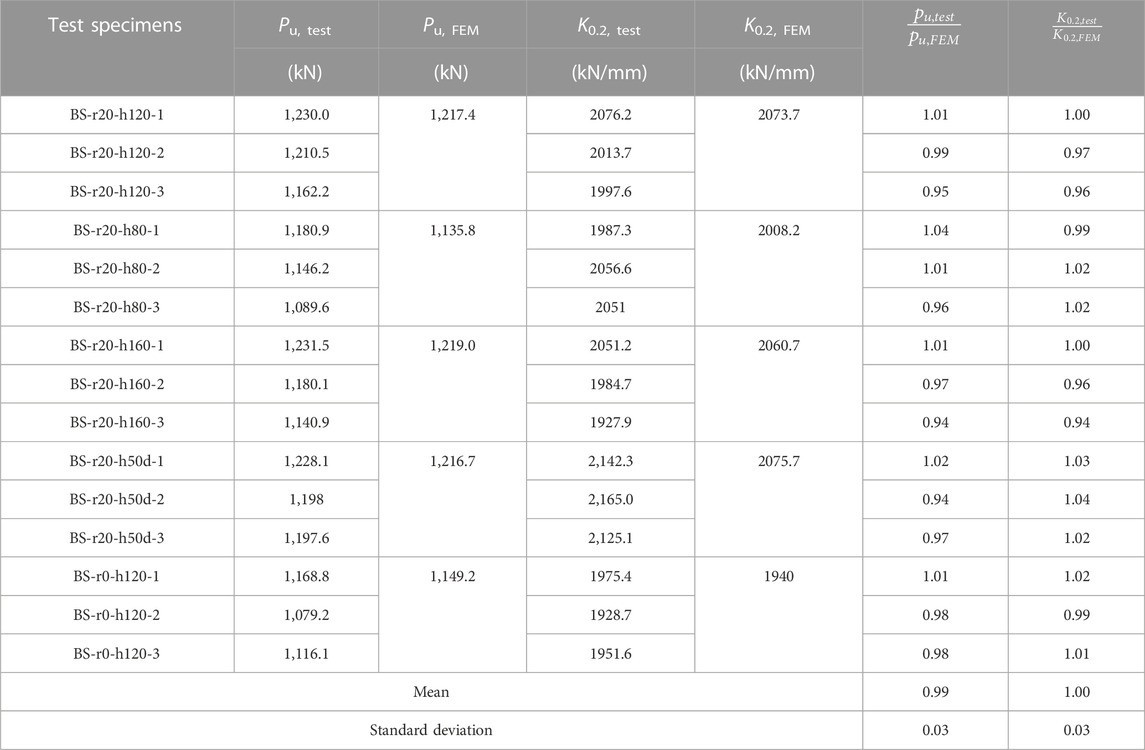
TABLE 3. Test results VS. FEM results.
As shown in Figure 9, due to the biaxial symmetry of the push-out specimens, a quarter FE model was established to reduce the computation time. The FE model consisted of six components: precast concrete slab, post-poured mortar, steel beam, B-S connector, base plate and reinforcing bars. The symmetric boundary conditions “xsymm” and “zsymm” were applied to the symmetric Surface X and Surface Z, respectively. The reference point “Fixed point” for the base plate was fixed in all six directions of translation and rotation. An enforced downward displacement was applied to the reference point “Loading point” of the steel beam.
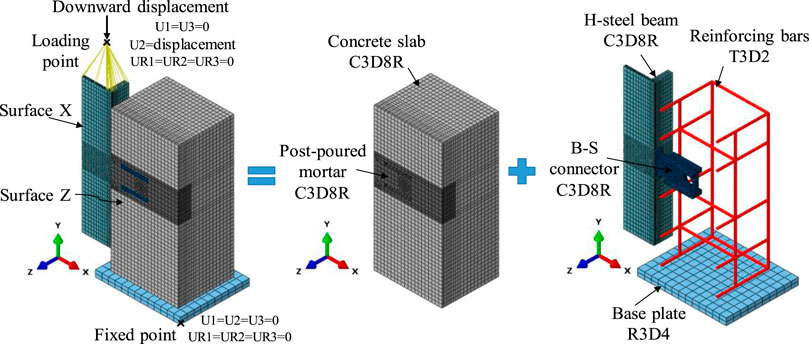
FIGURE 9. FE model and mesh.
The solid element C3D8R was used to simulate concrete slab, H-steel beam, and post-poured mortar. The truss element T3D2 was used to mesh the reinforcing bars and the discrete rigid element R3D4 was used to mesh the base plate. The numerical model meshed with a global seeds size of 15 mm, and the local seeds size near the B-S connector was 5 mm.
The static general solver available in ABAQUS was used to simulate the shear behavior of B-S connectors in push-out tests (ABAQUS, 2014; ABAQUS, 2014). Surface-to-surface contacts were considered between the different components of the push-out tests, which included the concrete slab to the steel beam, the concrete slab to the B-S connector, and the concrete slab to the base plate. “Hard” contact pressure-over closure relationship was considered in the normal direction and “penalty” friction formulation was considered in the tangential direction. The friction coefficient between the concrete slab and steel beam was 0.6 (Guo et al., 2022), and the friction coefficient between the other components was 0.25 (Wang et al., 2022). The reinforcing bars were embedded into the concrete slab.
In addition to surface-to-surface contact, the cohesive contact, which includes the “cohesive behavior” and “damage”, was applied to simulate the initial cohesive force between the steel beam flange and the concrete slab (Zou et al., 2023). According to the results of previous research (Nguyen, H. T., and Kim, S. E., 2009) and trial-and-error method, the parameters of “cohesive behavior” were determined as follows: Knn was taken as 0.05 Ecm, Kss and Ktt were taken as 0.05 Gcm, where Ecm and Gcm are the elastic modulus and shear modulus of concrete, respectively. The quadratic stress criterion was used as the damage initiation criterion of the surface-based cohesive behavior, and the parameters of “damage” were determined as follows:
Concrete Damage Plastic model available in ABAQUS was considered to simulate concrete behavior (ABAQUS, 2014). Figures 10A, B shows the uniaxial behavior of concrete compression and tension, respectively.
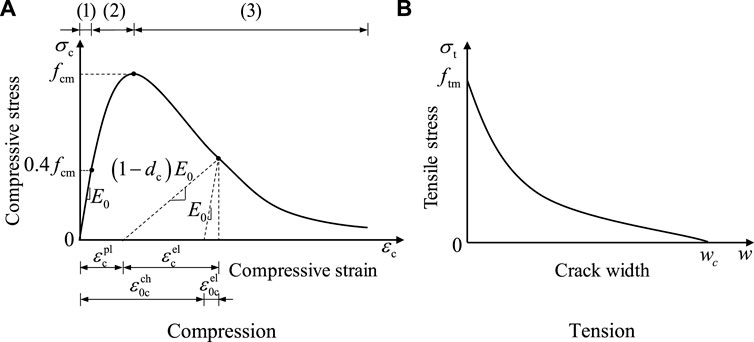
FIGURE 10. Concrete uniaxial behaviour. (A) Compression (B) Tension.
The stress-strain curve of concrete compression is separated into three parts. The first part is assumed to be linear elastic where the compressive stress does not exceed 0.4 fcm (Kwon et al., 2010; EN1992-1-2: Eurocode 2-Design of concrete structures, 2004, Design of concrete structures, 2004; Birtel and Mark, 2006; Alfarah et al., 2017):
Where fcm and Ecm are the concrete cylinder compressive strength and the concrete elastic modulus, respectively.
The second part of the compressive stress-strain curve is quadratic, where the compressive stress ranges from 0.4 fcm to the peak stress fcm (CEB-FIP, 2010):
In Eq. 2,
The third part of the stress-strain curve is a slowly descending branch, which ensures the simulation results are almost independent of the element mesh by introducing a characteristic element length parameter lck (Birtel and Mark, 2006; Alfarah et al., 2017).
In Eq. 4, Gch is the crushing energy per unit area,
As shown in Figure 10B, a non-linear stress-crack width relationship was adopted to explain the tensile behavior of concrete, which is given by Birtel and Mark (2006):
In Eq. 5, wc, which equates to 5.14Gf/ftm (CEB-FIP, 2010), is the cracking width when the tensile stress is zero. The constants are c1 = 3 and c2 = 6.93 (Birtel and Mark, 2006; Alfarah et al., 2017).
Concrete damage coefficients dc and dt were expressed as follows (Birtel and Mark 2006):
As shown in Figure 11A, the ideal elastic-plastic model was used to simulate the stress-strain relationship of the steel beam, pressure-bearing plate and reinforcing bars (Ataei and Zeynalian, 2021; Lima et al., 2022). Figure 11B shows the stress-strain relationship of the shear plate (Ataei and Zeynalian, 2021; Guo et al., 2022). Experimental data in Table 1 can be used for the values of elastic modulus (Es), yield strength (fy) and ultimate tensile strength (fu). Based on the material properties tensile tests, the ultimate strain εu and fracture strain εf of the shear plate were 0.13 and 0.135, respectively.
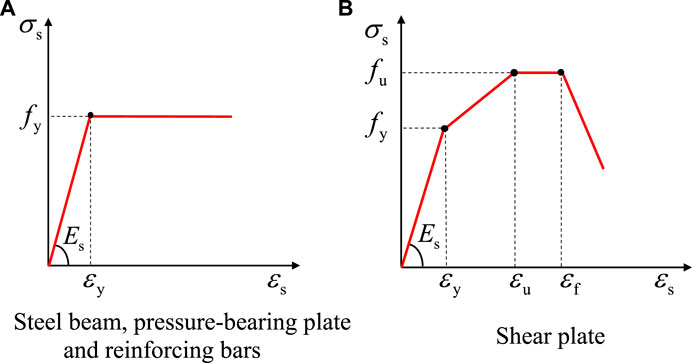
FIGURE 11. Stress-strain relationship of steel. (A) Steel beam, pressure-bearing plate and reinforcing bars (B) Shear plate.
The effectiveness of the FE model was verified by comparing the FE analysis results with the push-out tests from four aspects: failure modes, load-slip curves, shear capacity and shear stiffness. Figure 12 shows the comparison of the deformation of the B-S connectors in the tests and FE analysis. Both in the push-out tests and FE analysis, the shear plates had a significant shear deformation, whereas the pressure-bearing plates had no obvious deformation. Figure 13 shows the comparison of the load-slip curves obtained from tests and FE analysis. It could be found that the load-slip curves of the FE analysis were very similar to the curves tested.
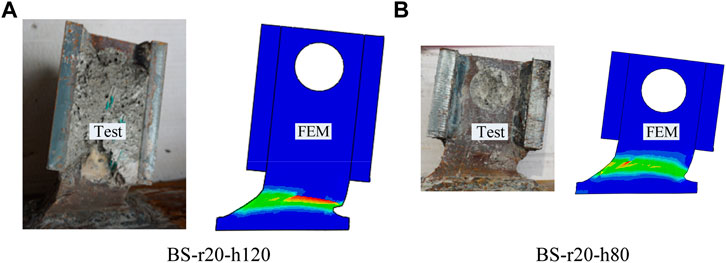
FIGURE 12. Shear deformation of the B-S connectors. (A) BS-r20-h120 (B) BS-r20-h80.
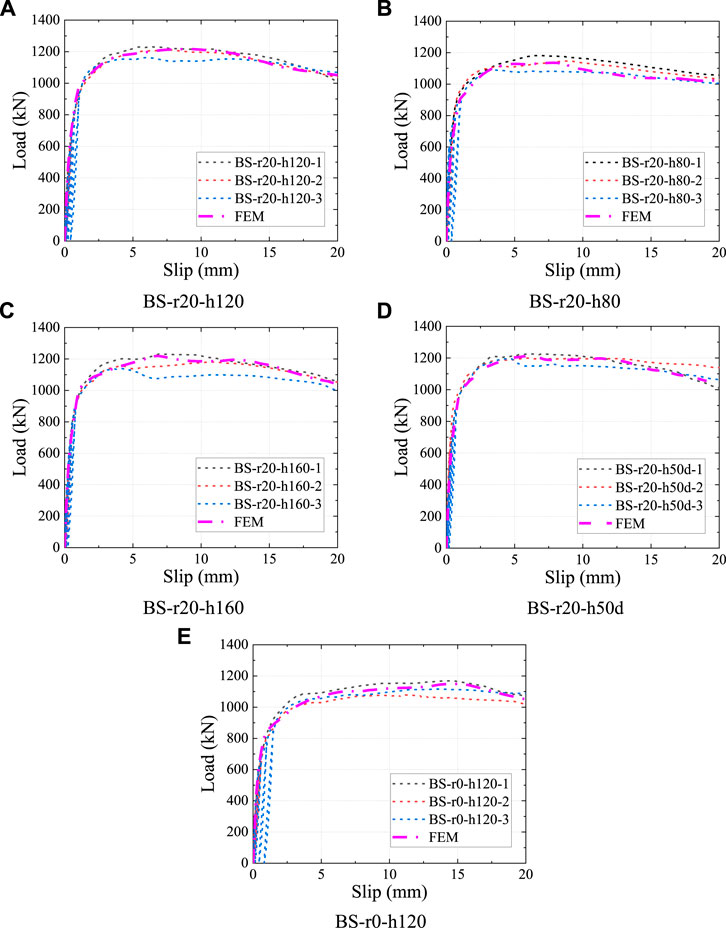
FIGURE 13. Comparison of the load-slip curves. (A) BS-r20-h120 (B) BS-r20-h80 (C) BS-r20-h160 (D) BS-r20-h50d (E) BS-r0-h120.
In addition, Table 3 compares the shear capacity and shear stiffness between the tests and FE analysis. Pu, test and Pu, FEM are the shear capacity per B-S connector obtained from push-out tests and FE analysis, respectively. It could be found from Table 3 that the deviation between Pu, test and Pu, FEM ranges from −6% to 4%, and the mean value of the Pu, test and Pu, FEM is 0.99, with a standard deviation of 0.03. K0.2, test and K0.2, FEM are the shear stiffness per B-S connector obtained from the push-out tests and FE analysis, respectively. The mean value of the K0.2, test/K0.2, FEM is 0.99, with a standard deviation of 0.03. From the previous analysis, it can be concluded that the shear behavior of the B-S connectors can be accurately simulated by using the FE model established in this study.
The load-slip curves of the shear connectors provide a detailed information on their shear behavior, including shear capacity, shear stiffness and slip capacity. To facilitate the comparison of the shear behavior between different shear connectors, the load-slip relationship can be presented in various ways, such as load-slip curves, stiffness evolution curves and normalized load-slip curves. Based on the results of experiments and FE parametric analysis, six parameters that influence the load-slip relationship of the B-S connectors were studied in this section.
Figure 14 shows the load-slip relationship of the B-S connectors with different pressure-bearing plate shapes. It could be found that the load-slip curves of specimen BS-r20-h120 and BS-r20-h50d almost coincided with each other, which indicates that the shape of the two pressure-bearing plates had little influence on the load-slip relationship of the B-S connectors.
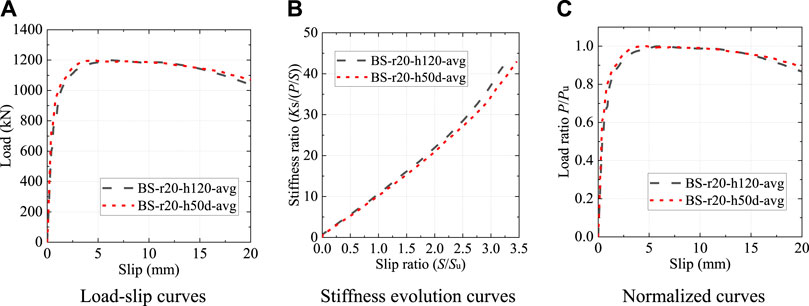
FIGURE 14. Influence of the pressure-bearing plate shape. (A) Load-slip curves (B) Stiffness evolution curves (C) Normalized curves.
Figure 15 shows the load-slip relationship of the B-S connectors with different pressure-bearing plate heights. When the pressure-bearing plate height changed from 80 mm to 120 mm and 160 mm, the shear capacity Pu increased by 5.4% and 4.0%, respectively. Despite the change in the height of pressure-bearing plate, the shear stiffness of B-S connectors gradually decreased with the increase of slip. It could be seen from Figure 15C that the height of the pressure-bearing plate had a negligible influence on the trends of the normalized load-slip curves.
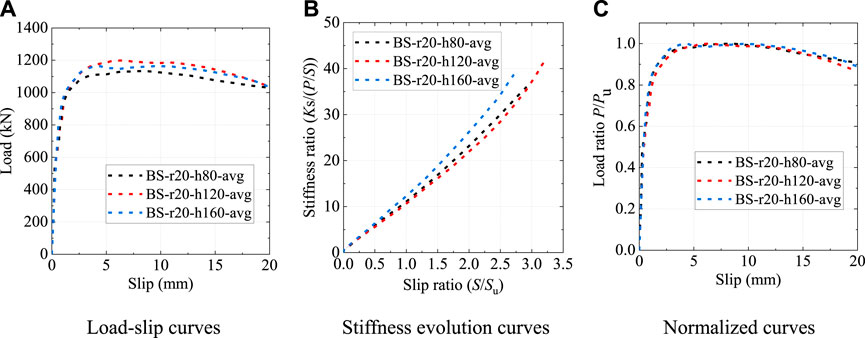
FIGURE 15. Influence of the pressure-baring plate height. (A) Load-slip curves (B) Stiffness evolution curves (C) Normalized curves.
As shown in Figure 16, the shear plate shape had a significant influence on the behavior of the B-S connectors. The root of the shear plate of specimen BS-r0-h120 was not locally widened, as shown in Figure 6E. Compared to the specimen BS-r20-h120, the shear capacity of the specimen BS-r0-h120 was reduced by 6.6%, and the shear stiffness was significantly reduced in the elastic-plastic phase. However, despite the varying shear plate shape, the stiffness of the B-S connectors gradually decreased with increasing slip. The normalized load-slip curves of the two B-S connectors with different shear plate shapes had the similar patterns.
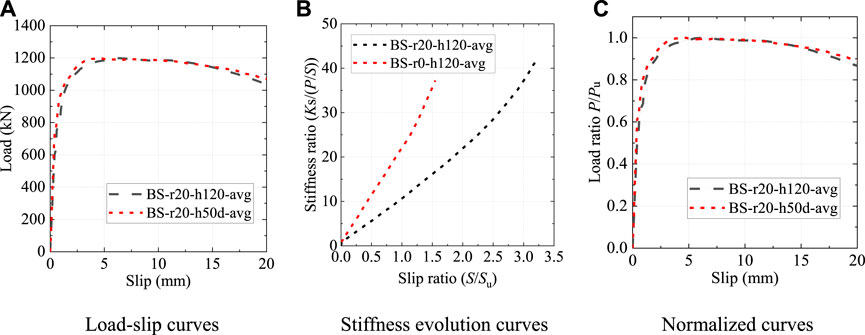
FIGURE 16. Influence of the shear plate shape. (A) Load-slip curves (B) Stiffness evolution curves (C) Normalized curves.
The numerical model, verified by the push-out tests, was used for the parametric study to analyze the influence of the cylinder compressive strength of concrete (35, 45, 55 MPa), and the thickness (14, 16, and 18 mm), the tensile strength (470, 490, 520 MPa) of shear plate on the shear behavior of the B-S connectors.
As shown in Figure 17, the concrete strength had a significant influence on the shear behavior of the B-S connectors. When the concrete strength changed from 35 MPa to 45 MPa and 55 MPa, the shear capacity Pu increased by 1.6% and 3.1%, and the peak slip (Su) increased 67.9% and 121.4%, respectively. Despite the varying of concrete strength, the stiffness of the B-S connectors gradually decreased with the increase of the slip. The normalized load-slip curves with different concrete strengths exhibited the similar trends.
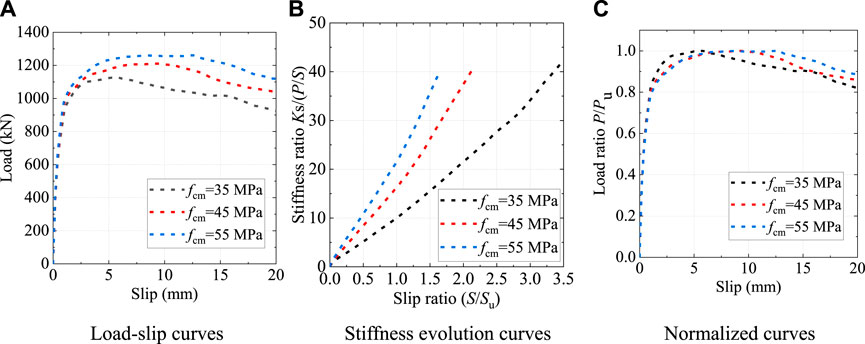
FIGURE 17. Influence of the concrete strength. (A) Load-slip curves (B) Stiffness evolution curves (C) Normalized curves.
As shown in Figure 18, the shear plate thickness had a significant influence on the shear behavior of the B-S connectors. When the shear plate thickness changed from 14 mm to 16 mm and 18 mm, the shear capacity increased by 10.7% and 15.7%, and the peak slip Su increased by 45.1% and 3.2%, respectively. Despite the variation of the shear plate thickness, the stiffness of the B-S connectors gradually decreased as the relative slip increased, and the normalized load-slip curves also exhibited the similar trends.

FIGURE 18. Influence of the shear plate thickness. (A) Load-slip curves (B) Stiffness evolution curves (C) Normalized curves.
As presented in Table 4, three types of structural steels were chosen for parametric study according to GB 50017-2017 (Standard for design of steel structures, 2017). Figure 19 shows the load-slip relationship of the B-S connectors with different shear plate tensile strength. It could be found that the shear plate tensile strength had a significant influence on the shear behavior of the B-S connectors. The shear capacity increased by 3.8% and 8.9%, and the peak slip Su reduced by 9.6% and 3.2% when the shear plate tensile strength changed from 490 MPa to 520 MPa and 550 MPa, respectively. Regardless of the differences in the shear plate tensile strength, the stiffness of the B-S connectors gradually decreased as the slip increased, and the normalized load-slip curves also exhibited the similar trends.
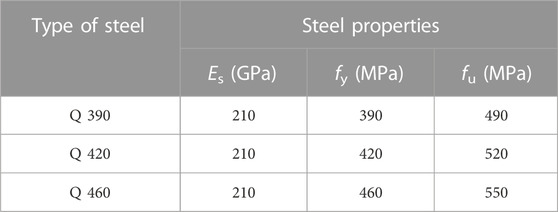
TABLE 4. Steel properties of the shear plate.
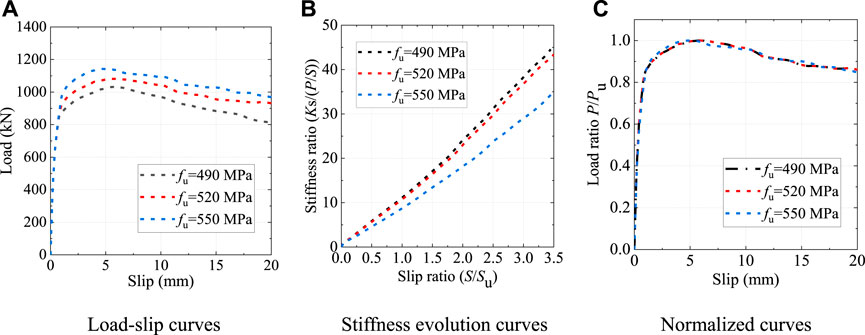
FIGURE 19. Influence of the shear plate tensile strength. (A) Load-slip curves (B) Stiffness evolution curves (C) Normalized curves.
The normalized load-slip curve is often used to compare the shear behavior of various shear connectors (Zou et al., 2021). Figure 20 shows the normalized load-slip curves of the common shear connectors. It could be found that the curves for the B-S connector and the PBL connector exhibit similar patterns, and both of them have three obvious phases: linear elastic phase, non-linear elastic-plastic phase and a slowly descending phase. Particularly in the descending phase, unlike other types of shear connectors, the load of the both types of connectors gradually decrease as the slip increases. Therefore, this study refers to the load-slip relationship of the PBL connector to establish the analytical model of the B-S connector (Zheng et al., 2018).

FIGURE 20. Normalized load-slip curves.
Based on the stiffness evolution curves of the B-S connectors discussed in Section 3.4, the stiffness ratio (Ks/(P/S)) increased as the slip ratio (S/Su) increased. As illustrated in Figure 7, the fitting analysis of the stiffness evolution curves showed that the mean value of COD (Coefficient of determination) of the quadratic fitting was 0.998, which fully indicated that the relationship between stiffness ratio (Ks/(P/S)) and slip ratio (S/Su) can be expressed by a quadratic expression 8).
In Eq. 8, C1, C2, and C3 are the non-dimensional parameters which could be derived from the boundary conditions of the load-slip curves. The Eq. 8 expressing the load-slip relationship of the B-S connectors can be simplified into Eq. 9.
The first derivative of Eq. 9 represents the tangent slope of the load-slip curves:
According to the characteristics of the load-slip curves in push-out tests and numerical analysis, the load-slip relationship of the B-S connectors should satisfy the following two boundary conditions.
Substituting Eq. 9 and Eq. 10, which represent the boundary conditions, into Eq. 11 and Eq. 12, the unknown parameters C1, C2 and C3 should meet the following requirements.
Substituting Eq. 13 and Eq. 14 into Eq. 9, the analytical expression of load-slip curves can be simplified to an equation with only one unknown parameter C1.
According to Eq. 15, non-linear regression analysis was conducted on the results of the push-out tests and FE analysis, and the best fitting value of the unknown parameter C1 was determined to be 0.8.
The shear stiffness (Ks) in Eq. 16 is the secant slope corresponding to the relative slip of 0.2 mm in the load-slip curves. Based on the results of the push-out tests and FE analysis, the shear load corresponding to the relative slip of 0.2 mm was about 0.37 Pu. Therefore, the shear stiffness in Eq. 16 can be expressed as follows.
Finally, the Eq. 17 was substituted into Eq. 16, and the load-slip relationship of the B-S connectors can be expressed as Eq. 18.
Figures 21A–H show the comparison of the predicted load-slip curves with the load-slip curves obtained from the push-out tests and numerical analysis, respectively. It could be found that the proposed analytical expression agrees well with the results of experiments and numerical analysis.
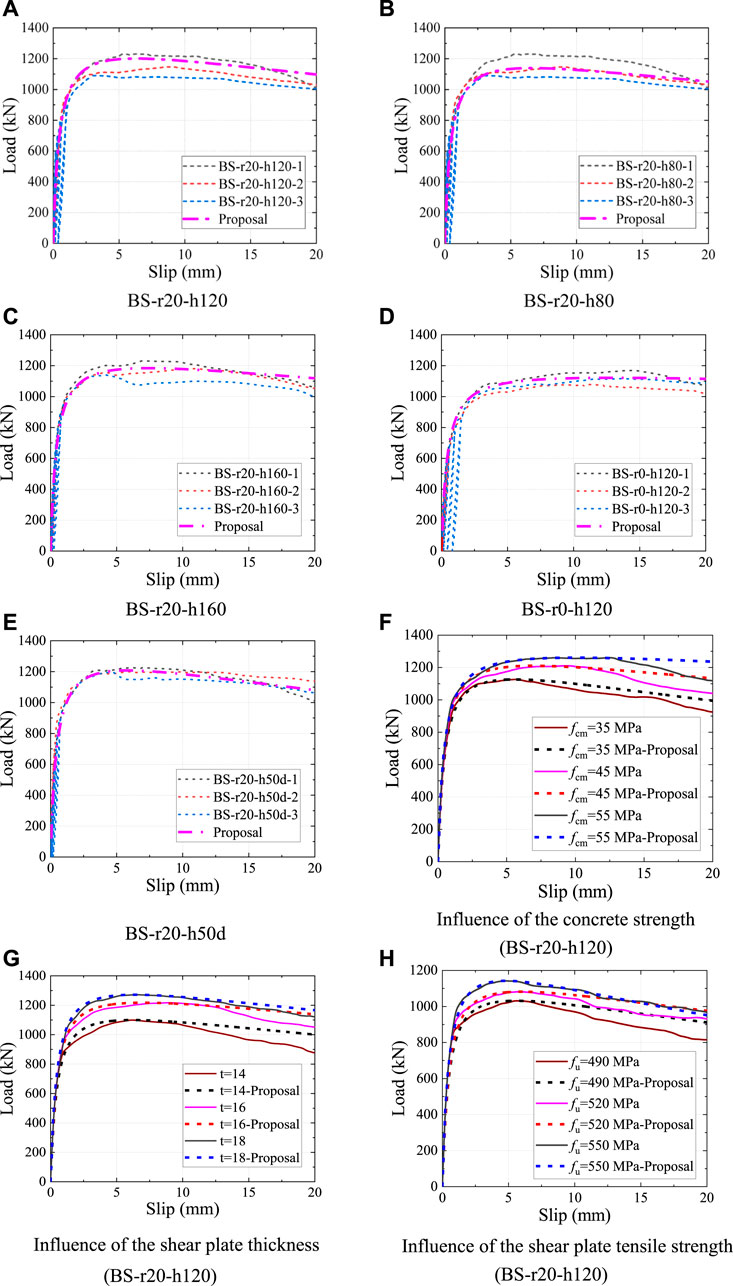
FIGURE 21. Predicted and tested load-slip curves. (A) BS-r20-h120 (B) BS-r20-h80 (C) BS-r20-h160 (D) BS-r0-h120 (E) BS-r20-h50d (F) Influence of the concrete strength (BS-r20-h120) (G) Influence of the shear plate thickness (BS-r20-h120) (H)Influence of the shear plate tensile strength (BS-r20-h120).
Push-out tests and numerical analysis were performed to investigate the shear behavior of the B-S connectors in prefabricated steel-concrete composite structures. Based on the push-out tests, FE analysis and theoretical analysis, the following conclusion can be drawn.
1) The failure modes of the B-S connectors specimens were mainly characterized by the concrete slabs splitting and shear failure of the shear plates.
2) The shape, thickness and tensile strength of the shear plate and the concrete strength significantly influenced the shear behavior of the B-S connectors, but the normalized load-slip curves with these different parameters exhibited the similar trends.
3) The typical load-slip curve of the B-S connectors can be obviously separated into three phases: starting with a linear elastic phase with little slip, followed by an elastic-plastic phase with a decreasing slope, and ending with a slow descending phase.
4) The typical load-slip curve of the B-S connectors contains five key characteristic parameters, including shear stiffness (Ks), initial slip (Si), peak slip (Su), peak load (Pu), and ultimate slip (S0.9). These five characteristic parameters with specific physical meaning are used to establish the analytical model of the load-slip relationship of the B-S connectors.
5) According to the push-out tests, FE analysis and theoretical analysis, an analytical model was suggested to express the load-slip relationship of the B-S connectors. The analytical model agrees well with the results of push-out tests and FE analysis, indicating that this expression can accurately predict the non-linear behavior of the B-S connectors.
The raw data supporting the conclusions of this article will be made available by the authors, without undue reservation.
FQ: Software, Validation, Writing. Supervision. ZH: Writing-review and editing. ZZ: Investigation, Review. YC: Supervision, Review. YZ: Supervision, Review. JD: Investigation.
The authors express their sincere gratitude for the financial support provided by the National Natural Science Foundation of China (No. 52078081), Chongqing Technology Innovation and Application Development Project (No. cstc2020jscx-msxmX0079, CSTB2022TIAD-KPX0103), the Natural Science Foundation of Chongqing (No. cstc2021jcyj-msxmX0937), and the Fundamental Research Funds for the Central Universities (No. 2022CDJKYJH006).
The authors declare that the research was conducted in the absence of any commercial or financial relationships that could be construed as a potential conflict of interest.
All claims expressed in this article are solely those of the authors and do not necessarily represent those of their affiliated organizations, or those of the publisher, the editors and the reviewers. Any product that may be evaluated in this article, or claim that may be made by its manufacturer, is not guaranteed or endorsed by the publisher.
Abaqus, Software (2014). Software version 6.14-5. Providence, RI, USA: Dassault Systemes Simulia Corp.
Alfarah, B., López-Almansa, F., and Oller, S. (2017). New methodology for calculating damage variables evolution in Plastic Damage Model for RC structures. Eng. Struct. 132, 70–86. doi:10.1016/j.engstruct.2016.11.022
Ataei, A., and Zeynalian, M. (2021). A study on structural performance of deconstructable bolted shear connectors in composite beams. Structures 29, 519–533. doi:10.1016/j.istruc.2020.11.065
Birtel, V., and Mark, P. (2006). Parameterised finite element modelling of RC beam shear failure. ABAQUS users' conference (Bochum, Germany: Universitätsstr).
EN1992-1-2: Eurocode 2-Design of concrete structures (2004). EN1992-1-2: Eurocode 2-Design of concrete structures. Part 1-1: General rules and rules for buildings. Brussels, Belgium: European Committee for Standardization CEN.
EN1992-1-4: Eurocode 4. Design of composite steel and concrete structures (2004). EN1992-1-4: Eurocode 4. Design of composite steel and concrete structures. Part 1.1: General rules and rules for buildings. Brussels, Belgium: European Committee for Standardization CEN.
GB 50017- (2017). Standard for design of steel structures. Beijing, China: China Architecture and Building press.
GB/T 228-2010 (2010). Metallic materials Tensile testing-Part 1: Method of test at room temperature. Beijing: Standardization Administration of the P.R.C. (In Chinese).
GB/T 50107-2010 (2010). Standard for evaluation of concrete compressive strength. Beijing: Ministry of Housing and Urban-Rural Development of the People’s Republic of China. (In Chinese).
Guo, J., Zhou, Z., Zou, Y., Zhang, Z., Jiang, J., and Wang, X. (2022). Static behavior of novel shear connectors with post-poured UHPC for prefabricated composite bridge. Structures 43, 1114–1133. doi:10.1016/j.istruc.2022.06.061
Hosseinpour, M., Zeynalian, M., Daei, M., and Ataei, A. (2022). Numerical study on behavior of bolted shear connector used in composite cold-formed steel beams. Thin-Walled Struct. 177, 109377. doi:10.1016/j.tws.2022.109377
JSCE (Japan Society of Civil Engineers) (1996). Standard on push-out test for headed stud. Tokyo: JSCE.
Kwon, G., Engelhardt, M. D., and Klingner, R. E. (2010). Behavior of post-installed shear connectors under static and fatigue loading. J. Constr. Steel Res. 66 (4), 532–541. doi:10.1016/j.jcsr.2009.09.012
Li, H., Liu, B., Wu, B., and Ma, H. (2010). Failure mechanism study on the bond-slip between T section steel and concrete in SRC structures. Sichuan Build. Sci. (5), 45–48. (In Chinese).
Lima, J. M., Bezerra, L. M., Bonilla, J., and Barbosa, W. C. (2022). Study of the behavior and resistance of right-angle truss shear connector for composite steel concrete beams. Eng. Struct. 253, 113778. doi:10.1016/j.engstruct.2021.113778
Nguyen, H. T., and Kim, S. E. (2009). Finite element modeling of push-out tests for large stud shear connectors. J. Constr. Steel Res. 65 (10-11), 1909–1920. doi:10.1016/j.jcsr.2009.06.010
Pavlović, M., Spremić, M., Marković, Z., and Veljković, M. (2016). Headed shear studs versus high-strength bolts in prefabricated composite decks. Compos. Constr. Steel Concr. 7, 687–702. doi:10.1061/9780784479735.052
Qin, Y. (2007). Analysis bond-slip of the steel reinforce concrete structure by nonlinear finite element. China: Xi’an University of Technology.
Ranzi, G., Bradford, M. A., and Uy, B. (2004). A direct stiffness analysis of a composite beam with partial interaction. Int. J. Numer. Methods Eng. 61 (5), 657–672. doi:10.1002/nme.1091
Shariati, M., Sulong, N. R., and Khanouki, M. A. (2012). Experimental assessment of channel shear connectors under monotonic and fully reversed cyclic loading in high strength concrete. Mater. Des. 34, 325–331. doi:10.1016/j.matdes.2011.08.008
Shim, C. S., Kim, J., Chang, S. P., and Chung, C. H. (2000). The behaviour of shear connections in a composite beam with a full-depth precast slab. Proc. Institution Civ. Engineers-Structures Build. 140 (1), 101–110. doi:10.1680/stbu.2000.140.1.101
Shim, C. S., Lee, P. G., and Chang, S. P. (2001). Design of shear connection in composite steel and concrete bridges with precast decks. J. Constr. Steel Res. 57 (3), 203–219. doi:10.1016/S0143-974X(00)00018-3
Wang, S., Fang, Z., Ma, Y., Jiang, H., and Zhao, G. (2022). Parametric investigations on shear behavior of perforated transverse angle connectors in steel–concrete composite bridges. Structures 38, 416–434. doi:10.1016/j.istruc.2022.01.015
Xue, W., Ding, M., Wang, H., and Luo, Z. (2008). Static behavior and theoretical model of stud shear connectors. J. bridge Eng. 13 (6), 623–634. doi:10.1061/(asce)1084-0702(2008)13:6(623)
Yu, J. (2020). Study on mechanical behavior of assembled steel concrete composite beams with group stud and steel block connections. Chongqing, China: Chongqing University.
Zheng, S., Liu, Y., Yoda, T., and Lin, W. (2016). Parametric study on shear capacity of circular-hole and long-hole perfobond shear connector. J. Constr. Steel Res. 117, 64–80. doi:10.1016/j.jcsr.2015.09.012
Zheng, S., Zhao, C., and Liu, Y. (2018). Analytical model for load–slip relationship of perfobond shear connector based on push-out test. Materials 12 (1), 29. doi:10.3390/ma12010029
Zhu, B., Wang, T., and Zhang, L. (2018). Quasi-static test of assembled steel shear panel dampers with optimized shapes. Eng. Struct. 172, 346–357. doi:10.1016/j.engstruct.2018.06.004
Zou, Y., Jiang, J. L., Yang, J., Zhang, Z. Y., and Guo, J. C. (2023). Enhancing the toughness of bonding interface in steel-UHPC composite structure through fiber bridging. Cem. Concr. Compos. 137, 104947. doi:10.1016/j.cemconcomp.2023.104947
Zou, Y., Qin, F., Zhou, J., Zheng, Z., Huang, Z., and Zhang, Z. (2021). Shear behavior of a novel bearing-shear connector for prefabricated concrete decks. Constr. Build. Mater. 268, 121090. doi:10.1016/j.conbuildmat.2020.121090
Zou, Y., Qin, F., Zhou, J., Zhang, Z., Huang, Z., and Zhang, Z. (2021). Shear behavior of a novel bearing-shear connector for prefabricated concrete decks. Constr. Build Mater 268, 121090. doi:10.1016/j.conbuildmat.2020.121090
Keywords: push-out test, numerical analysis, load-slip relationship, stiffness evolution, analytical model
Citation: Qin F, Huang Z, Zheng Z, Chou Y, Zou Y and Di J (2023) Analytical model for the load-slip relationship of bearing-shear connectors. Front. Mater. 10:1110232. doi: 10.3389/fmats.2023.1110232
Received: 28 November 2022; Accepted: 27 January 2023;
Published: 20 February 2023.
Edited by:
Cong Zhang, Jiangnan University, ChinaReviewed by:
Shao-Bo Kang, Chongqing University, ChinaCopyright © 2023 Qin, Huang, Zheng, Chou, Zou and Di. This is an open-access article distributed under the terms of the Creative Commons Attribution License (CC BY). The use, distribution or reproduction in other forums is permitted, provided the original author(s) and the copyright owner(s) are credited and that the original publication in this journal is cited, in accordance with accepted academic practice. No use, distribution or reproduction is permitted which does not comply with these terms.
*Correspondence: Zhichao Zheng, emhpY2hhb3poZW5nMUAxNjMuY29t
Disclaimer: All claims expressed in this article are solely those of the authors and do not necessarily represent those of their affiliated organizations, or those of the publisher, the editors and the reviewers. Any product that may be evaluated in this article or claim that may be made by its manufacturer is not guaranteed or endorsed by the publisher.
Research integrity at Frontiers
Learn more about the work of our research integrity team to safeguard the quality of each article we publish.