 Sabir Khan
 Wiqar H. Shah1*
 M. Tufail
 Akhtar Ali
 Sayed M. Eldin
 Naveed Imran
 Muhammad Sohail
95% of researchers rate our articles as excellent or good
Learn more about the work of our research integrity team to safeguard the quality of each article we publish.
Find out more
ORIGINAL RESEARCH article
Front. Mater. , 08 February 2023
Sec. Colloidal Materials and Interfaces
Volume 10 - 2023 | https://doi.org/10.3389/fmats.2023.1108048
This article is part of the Research Topic New Frontiers in Hybrid Nanofluids for Heat Transfer Process and Applications View all 14 articles
Thallium telluride Tl8.67 Sn1.33-xSbxTe6 nano compound doped with different concentration ratios of Sb (x = 0.63, 0.65, 0.66, 0.68, 0.70, or 0.72) was prepared using solid-state techniques, and the compound was heated up to 550 K in vacuum silica tubes. The structure of the nano system was studied using XRD and EDX. It was confirmed that, without any other impurities, the nano system had a single-phase tetragonal crystal structure. The measured Seebeck coefficient (S) of all nano compounds showed that S increased with increase in temperature from 300 to 550 K. S was positive at all temperatures, showing characteristics of a p-type semiconductor. The complex behaviour of S in an Sb-doped nano system showed that at low temperature (room temperature), S first decreased with an increase in Sb concentration up to x = 0.65 and then increased with an increase in the Sb dopant up to x = 0.72. Similarly, electrical conductivity (σ) decreased with an increase in temperature, and the power factor showed complex behaviour relative to Sb concentration. The power factor observed for Tl8.67 Sn1.33-xSbx Te6 nano compound increased with an increase in temperature, within a temperature range of 300–550 K. Tellurides are semiconductors of very narrow band-gap, with component elements in common oxidation states, according to (Tl+9) (Sb3+) (Te2-)6. The phase range was also assessed, and results demonstrated that different Sb dopant ratios were associated with differences in properties (e.g., electrical, thermal, and Seebeck effect) and hence variation in power factor. These results indicate a route through which the thermoelectric characteristics of Tl8.67 Sn1.33-xSbxTe6-based nano materials were harnessed for the development of thermoelectric and electronic applications.
Green energy and its sources are of great interest due to environmental issues. It provides a way to overcome the energy crises and minimize the use of fossil fuel (Adam et al., 2017; Liu et al., 2018; Rahman et al., 2019), as well as improve the efficiency of existing thermoelectric (TE) materials; therefore, it is important to find new TE materials (Luu and Vaqueiro, 2015; Chen et al., 2016; Ouyang et al., 2018). Scientists and researchers of the current era are taking great interest in TE materials as they are among the best green energy sources, particularly at the nano size, as demonstrated by the chalcogenide nano system of rare Earth elements, which has a high Seebeck coefficient, moderate thermal conductivity, and high electrical conductivity. The bulk of the nano material Tl9Te10 was prepared using ball milling and hot-pressing techniques along with doped lead. The thermal and electrical properties were studied by Yu et al. (2010a), who showed that the figure of merit (ZT) was 1.30 at 299.99°C. The Seebeck coefficient (S) estimated at 400°C was slightly higher than Na nano particle dopants. The temperature at which a nano system (Tl0.020Pb0.98Te) has a high ZT and high TE property was calculated to be 500°C. Pb-doped (Bi0.2Sb0.8-xPbx)2Te3 nano compound was synthesized using the hot pressing sintering and quenching technique established by Lin et al. (2016), and assessment of TE characteristics demonstrated that ZT was enhanced with doping. In order to improve and synthesise new TE material (Khan et al., 2018), nano compounds with different Sb concentration ratios ≥1 were synthesised using a solid-state reaction technique, and the nano particles of the compound were prepared from the ingot using ball milling. It was confirmed that the structure of the compound was tetragonal, with a space group (I4/mcm) and no impurities. P-type behaviour was reported due to doping of thallium telluride with Sb. TE properties, including electrical properties, S, and ZT increased and, therefore, the power factor increased. It was also noted that the semiconduction behaviour of the compound gradually became electrical in nature, while the structure of the compound remained unchanged. The thermal properties of synthesized thallium antimony telluride were carefully studied by Kurosaki et al. (2004), with watchful measurement of thallium and tellurium nano materials. Powder made up of these nano materials was mixed, and pellets were formed by condensing the particles for 6 h in a closed quartz holder K and heated below Argon gas in a 674 K mp climate. The TE power (S) and the electrical resistivity (∫) were measured over the temperature range of 300K–800 K. The estimation of TE power at 3.93 × 10²℃ was measured and found to be basically identical in position of strength for TE properties, while TlSbTe6 showed positive behaviour in the range of perfect temperature. The compound showed comparatively low thermal conductivity, and the power factor at 400 K was greater, with a value of 0.9. This effect was due to the combination of TE materials. According to an in-depth study by Zhang and Zhao (2015), the thermal and electrical properties of nano materials, such as TE materials, have resulted in revolutionary changes since the last century, by providing another approach through which researchers can generate new methods of power generation. Due to high electrical and thermal properties, thallium tellurides were synthesized with lanthanides by Guo and Kleinke (2015). At the first stage, Tl9CeTe6 had a unit cell volume with a wavelength in the range of 1,033 Å. The electrical and thermal conductivity increases from La to Tb, while the thermoelectric power decreases from La to Tb in the lanthanide series. Although both Tl9GdTe6 and Tl9SmTe6 are exceptional, Tl9GdTe6 has more significant TE power. In the lanthanide series, Tl9LaTe6 has the most elevated figure of merit. Increasing the ratio of La (0.9, 0.95, 1.00, 1.05, and 1.10) causes improved unit cell volume, hence a decrease in thermal conductivity and an increase in thermal power. At 600 K, the ZT value for Tl9LaTe6 is 0.57. The research of Kim and Ha (2013) showed isolation of alumina nanoparticles with bismuth–antimony–tellurium lattice (Al2O3/BST) using the framing ball milling technique. At 323 K, the value of ZT increased. The study of Sankar et al. (2012) showed that, in the application of TE materials, thermal and electrical properties play key roles. They worked on compounds of ternary chalcogenides of thallium such as TlGdY2(Y = Te or Se), wherein Tl96 achieved α -Na2 structure, with isostructure demonstrated by TlSbY2 (space group R3m), and Tl9Te6 was isostructural through Tl96 (space group I4/cm). The wide band p-type semiconductor was discovered to have low/lower electrical conductivity and a high Seebeck coefficient of TlGdSe2. Telluride TlGdTe2 had low thermal conductivity (K) of 0.5 W/mK and possessed a semiconductor at 298 K (ambient temperature). Tl9Te6 displayed a relatively small amount of high thermal conductivity at 298 K (room temperature). The impurity of TlBiTe polycrystalline was synthesized by using hot squeezing techniques; the thermoelectric properties were then evaluated at temperatures ranging from 293 K (room temperature) to 700 K by (Yamanaka et al. (2003), confirming that the Seebeck effect was increased across the full temperature range. These data demonstrated that the material acted like a p (hole)-type semiconductor. The electrical resistivity was 12 times higher than the TE materials. The highest assessed ZT was 0.86 at 590 K. Sn at different ratios served as the dopant for (Bi0.25Sb0.75)2-xSnxTe3 nano compounds, where (x = 0, 0.005, 0.01, 0.05, 0.1, or 0.2) in experiments by Cai et al. (2016) using hot energy ball mill and spark plasma techniques to study TE properties. With the help of SEM and TEM, it was confirmed that (Bi0.25Sb0.75)2-xSnxTe3) nanostructure was inhomogeneous and of encrusted structure. The elevated value of ZT was 1.30 at 338 K when the doping value of x = 0.1. The thermal and electrical properties of tellurium telluride (Tl8.67PbxSb1.33-xTe6) with doping of Pb were studied by Shah et al. (2016) with different concentration ratios (x = 0.61, 0.63, 0.65, 0.67, 0.68, or 0.70). The samples were synthesized by a solid-state reaction in an air-free silica tube. The crystal structure was examined by XRD and EDX. It was observed that all the compounds were phase pure. The S values for these compounds increased with the increase in temperature from 295 K to 550 K, which showed that S was positive for the entire temperature range; from these data, it was clear that the compound was a semiconductor with p-type behaviour. At room temperature, it showed complex behaviour after doping with Pb; with increased doping, the Seebeck effect decreased. The electrical conductivity and power factor also showed complex behaviour related to Pb concentration. The power factor over the entire temperature range, from 290 K to 550 K, for Tl8.67PbxSb1.33-xTe6 compounds also increased. As tellurides are semiconductors of small band-gap, a state of normal oxidation was also shown by (Tl+)9 (Sb3+) (Te2-)6. The doping with Pb showed effects on its thermal and electrical properties. The increased concentration of Pb resulted in the increase in hole which led to higher scattering of electrons and reduced S value. The TE characteristics of the quaternary/quadruplet telluride series Tl10– x -ySnxBiyTe6 were introduced by Kuropatwa et al. (2014), with thermal conductivity (κ), thermo power (S), and electrical conductivity (σ). Tl fixations have three divers, which are 8.33, 8.67, and 9 for each formula unit, and there are different Sn concentrations, each with a Bi ratio to resemble the characteristic for each Tl focus. They also found that the crystal structures supported their calculations and observations. The realistic value of ZT was calculated to be 0.6 at 525 K and 575 K for Tl8.67Sn0.50Bi0.83Te6 and Tl8.33Sn1.12Bi0.55Te6, respectively. It was suggested by Chen et al. (2010) that semiconductors of nanostructured thermo materials are becoming a new source of energy in thermo electrical nano materials and may change the proficiency of novel energy sources by keeping the high value of electrical conductivity to allow measurement of the De Broglie wavelength in a way that is similar to the practicality of the TE nanostructure crystal. They showed that there is another easy technique, which involves self-assembly of nano particles of Sb2Te3 by a controlled dimension of particles in a vapour-free crystal transport. With this technique, the sample Sb2Te3 showed an improved Seebeck coefficient at same concentration and that the thermal conductivity was less than the bulk of Sb2Te3. It was confirmed by Yu et al. (2010b) that doping of thallium to lead telluride expanded the ZT value due to expansion of the Seebeck coefficient, while the thermal conductivity was unchanged despite improvement of resonant state around the Fermi level (Egap/2). Still, the technology is monotonous due to moderate cooling for the development of crystal, higher time waste, hot squeezing, and post-smashing. The value of ZT (1.3) at 373 K was examined with a grain size of 3–7 × 10⁻⁶ m by using the ball milling technique with concentrations of thallium, tellurium, and elemental lead nano powder and the hot squeezing technique. In the two I-V bands, which were considered by Min et al. (2016), one was kept under continuous temperature gradient and the other was used to obtain continuous thermal information. Solvable information on this special type of procedure was obtained. The investigators developed a new method that enabled sorting of both I-V bands for acquiring natural results by using impedance techniques and then estimated the TE module results. In our previous paper (Khan et al., 2022), Sn was doped to Tl8.67Sb1.33-xSnxTe6 at different concentration ratios using a solid-state reaction technique. XRD and EDX were used to confirm that the compound was of single phase tetragonal structure without any impurities. The TE properties, including Seebeck effect, electrical conductivity, and ZT, increased. With associated doping concentrations of Sn, the power factor increased with increased temperature (300 K–500 K). Similar studies have been carried out by other groups (Ouyang et al., 2018; Tufail et al., 2021; Xia et al., 2023), but the main differences are in approach to enhancement of TE properties using different techniques.
In this research, Tl8.67Sn1.33-xSbxTe6 was doped with Sb and the resulting electrical properties were studied using crystal structure data obtained through XRD and EDX; pellet morphology was studied using SEM. The electrical and thermal properties of the nano compound changed relative to Sb doping. This research focused on the Seebeck coefficient and electrical conductivity because both have significant effects on electrical properties. Four probes were used to evaluate electrical conductivity (σ), and the power factor was calculated based on the Seebeck coefficient. It was noted that increased temperature also increased the Seebeck coefficient.
Tl8.67Sn1.33-xSbxTe6 was doped with Sb and synthesised using the solid-state reaction technique and different concentrations (x = 0.63, 0.65, 0.66, 0.68, 0.70, or 0.72) in air-free silica tubes and sealed in the presence of oxygen to reduce moisture. Ultra-high purity materials (≥99.999%; Sigma-Aldrich) were used to synthesise the nano materials in powder form in silica tubes in the presence of argon gas, which was heated to a temperature of 650 K for at least 24 h, at a rate of 1K/min. To avoid imperfections, such as dislocation, quenching, and deformation of crystal, the sample was cooled down at a very slow rate. The sample was kept at 27℃ for at least 12 h for uniformity. The Seebeck coefficient (S) of each sample in the formed pellet, each at dimensions of 5 × 1 × 1 mm3, was measured. Unfortunately, there was no change in the Seebeck coefficient on weakly biases tenure when the sample was in open air. For measurement of electrical conductivity, the four-probe method was used to assay each pellet in the rectangular form.
The following XRD figure shows Tl8.67 Sn1.33-xSbxTe6 doped with Sb at different ratios (0.63, 0.65, 0.66, 0.68, 0.70, or 0.72). The highest peak value was observed at an angle of 31.8
FIGURE 1. XRD of Tl8.67SnxSb1.33-xTe6 (x = 0.63, 0.65, 0.66, 0.68, 0.70, or 0.72) at room temperature.
TABLE 1. Crystallite size (D in nm), lattice constant, and volume (A3) of the unit cell.
An Intel diffractometer with CuKα radiation was used for XRD. The peaks of the graph show the concentration of Sb in the nano compound Tl8.67Sn1.33-xSbxTe6.
For structural and chemical analyses, SEM was used. To achieve better and more accurate results, samples were in solid form, as well as sized to fit in the niche shown in Figure 2. For electrical conductivity, the samples were shielded with thin metal to allow better results in measurement of S; mostly carbon is the best option a compound like. Tl8.67Sn1.33-xSbxTe6 was doped with Sb, and due to concentration of Sb, the insignificant grain size paved a path of bulky scattering to the electron. The thermo power of the chalcogenide system was slightly improved; thermo power increased with decreased grain size of the compound to the micro and nano levels (Kuropatwa et al., 2011). These findings have already been illustrated in the literature on the SbTe nano compound.
FIGURE 2. SEM image of the nano compound Tl8.67Sn1.33-xSbxTe6. (A) Tl8.67Sn0.61Sb0.72Te6 and (B) Tl8.67Sn0.70Sb0.63Te6.
The percentage ratio of each element in the compound can be found by using EDX analysis. In the compound, the atomic percentage of each element was assessed: Tl (57.89%), Sb (3.97%), Sn (3.73%), and Te (34.41%). The maximum percentage of Tl was 57.89%. Figure 3 shows the concentration of each element. The weight percentages and atomic percentages are also given in Table 2.
FIGURE 3. EDX data for Tl8.67Sn0.67Sb0.66Te6 at room temperature for the confirmation of stoichiometric ratios from elemental analysis.
TABLE 2. Weight% and atomic% of the elements in the compound Tl8.67Sn0.67Sb0.66Te6.
The electrical conductivity and temperature were plotted against each other and show the inverse behaviour for all samples; increased temperature led to a decreased conductivity (σ) and vice versa, due to the charge carriers being scattered from phonons of the material.
Our focus in this research on electrical conductivity was on Sb doping of the compound at different concentrations (0.63 ≤ x ≤ 0.72) and at various temperature ranges. Results are provided in Table 3. It was noticed that, at the concentration of Sb = 0.66, the electrical conductivity did not increase due to a change in the band gap. The power factor with doping at different concentrations of Sb improved with increased temperature. The concept of discussion given previously is that the semiconductor material is prone to degeneration. Figure 4 shows the change in electrical conductivity (σ) related to the doping concentration ratio of Sb.
TABLE 3. Electrical conductivity (σ S (m-1))(S=Siemens) of Tl8.67Sn1.33-xSbxTe6 (x= 0.63, 0.65, 0.66, 0.68, 0.70, or 0.72) of thermoelectric properties at the temperatures 300, 400, and 500 K.
FIGURE 4. Dependency of electrical conductivity (σ) on the temperature of Tl8.67Sn1.33-xSbxTe6 (x = 0.63, 0.65, 0.66, 0.68, 0.70, or 0.72) as a cooled and hot-pressed pellet.
In this research work, it was observed that the Seebeck coefficient of the p-type compound/sample Tl10-xSnxTe6 increased with rise in temperature and also with doping of Sb at different ratios. It can be seen from the Table 4 that, at x = 0.65, the Seebeck coefficient (S) was maximum, S = 77.65 and 157.36, at temperatures of 300 K and 550 K, respectively, whereas the minimum value for x = 0.68 was 56.04 at 300 K and increased to 93.04 at 550 K. Similarly when the concentration of Sb was 0.63 or 0.72, the Seebeck coefficients varied from 73.87 to 127.00, respectively, at temperatures of 300K–550 K, as indicated in Figure 5.

TABLE 4. Seebeck coefficient S (μV/k) of Tl8.67Sn1.33-xSbxTe6 (x = 0.63, 0.65, 0.66, 0.68, 0.70, or 0.72) at 300, 400, and 550 K.
FIGURE 5. Dependency of Seebeck coefficient (S) on the temperature of Tl8.67Sn1.33-xSbxTe6 (x = 0.63, 0.65, 0.66, 0.68, 0.70, or 0.72).
The power factor is the product of the square of the Seebeck coefficient and the electrical conductivity (S2σ); therefore, a change in either variable will result in a change in the power factor. All the observed values of the compound are plotted in the following Figure 6, which shows changes in the power factor. The compound Tl8.67Sn0.61Sb0.72Te showed its highest values of 7.58 μW/cm1K2 and 3.84 μW/cm1K2 at temperatures 500 K and 300 K, respectively. The lowest power factor values of Tl8.67Sn0.70Sb0.63Te were also recorded: 1.76 μW/cm1K2 and 1.20 μW/cm1K2 at temperatures 500 K and 300 K, respectively. The values of the power factor of all compounds at different temperatures and various doping concentrations are given in Table 5.
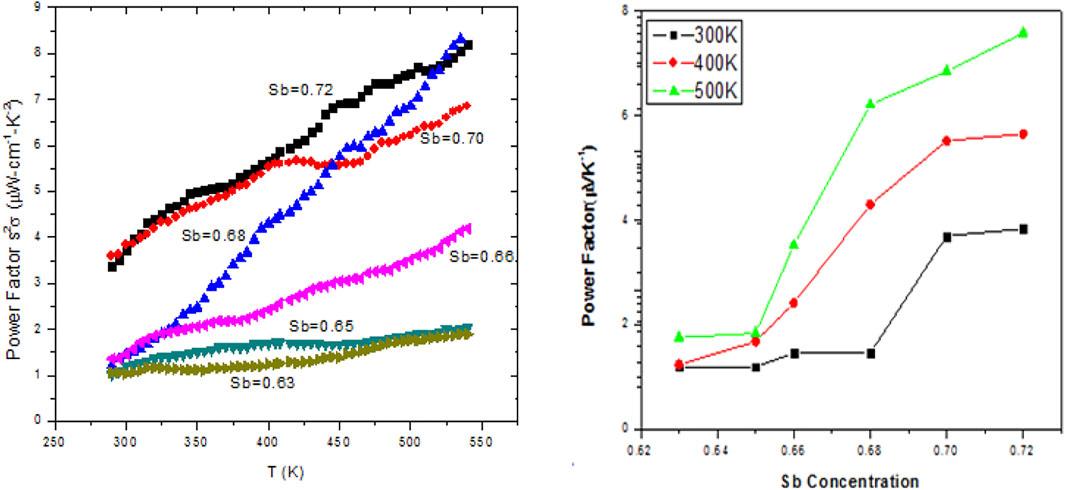
FIGURE 6. Effect of Tl8.67Sn1.33-xSbxTe6 on power factor with changing temperature and doping concentration of Sb, where x = 0.63, 0.65, 0.66, 0.68, 0.70, or 0.72.
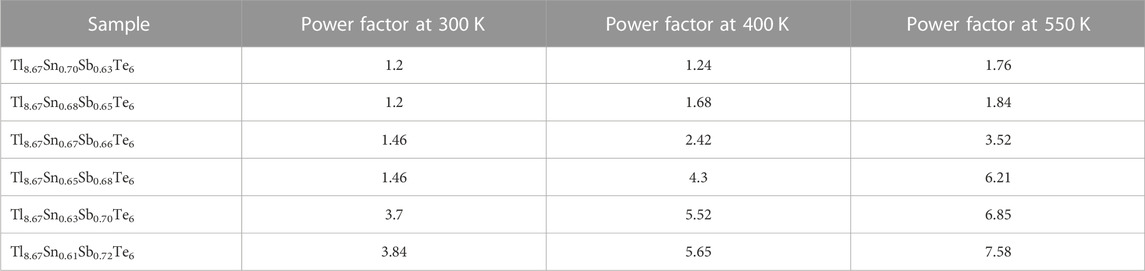
TABLE 5. Variation of power factor at room temperature, 300 K, 400 K, and 550 K.
⁃ Tl8.67Sn1.33-xSbxTe6 nanoparticles doped with Sb at different concentration ratios were synthesised using solid-state reaction techniques.
⁃ XRD analysis confirmed that the sample was single-phase with space group equal to Tl5Te3.
⁃ The observed Seebeck coefficient over the entire range showed that the Seebeck coefficient increased with increased concentration of Sb doping, as well as increased temperature, and vice versa.
⁃ The Seebeck coefficient decreased with high Sb concentration ratio, indicating conduction through holes in the samples; carrier density increased with increased concentration of Sb other than x = 0.65. Therefore, the thermo power also increased due to enhanced electron scattering in the system. Additionally, the power factor increase was likely due to effects at the micro to nano levels, which have been observed in many other studies on SbTe.
⁃ Our data indicate that various dopants enhance the TE properties of samples that can be used as TE generators.
The original contributions presented in the study are included in the article/supplementary material, further inquiries can be directed to the corresponding authors.
The contributions of authors are listed as follows: i) NI, SK, WS, and MT developed the model; ii) AA, SE, and MS handled the resulting expression and plotted the graphs; iii) NI, SK, WS, and MT helped in the literature survey; iv) AA, SE, MS, and MT updated the Introduction section; v) SK, WS, MT, and SE prepared the Results and discussion section; vi) SK, WS, MT, and AA improved the Results and discussion section; vii) NI, SK, WS, MT, and AA updated the Conclusion section in the final stage of submission.
The authors declare that the research was conducted in the absence of any commercial or financial relationships that could be construed as a potential conflict of interest.
All claims expressed in this article are solely those of the authors and do not necessarily represent those of their affiliated organizations, or those of the publisher, the editors, and the reviewers. Any product that may be evaluated in this article, or claim that may be made by its manufacturer, is not guaranteed or endorsed by the publisher.
Adam, A. M., Lilov, E., and Petkv, P. (2017). Optical and thermoelectric properties of nano-particles based Bi 2 (Te 1−x Se x) 3 thin films. Super Lattices Microstruct. 101, 609–624. doi:10.1016/j.spmi.2016.09.034
Cai, Z., Guo, L., Xu, X., Yan, Y., Peng, K., Wang, G., et al. (2016). Effect of Sn doping in (Bi 0.25 Sb 0.75) 2− x Sn x Te 3 (0≤ x≤ 0.1) on thermoelectric performance. J. Electron. Mater. 45 (3), 1441–1446. doi:10.1007/s11664-015-4061-5
Chen, J., Sun, T., Sim, D., Peng, H., Wang, H., Fan, S., et al. (2010). Sb2Te3 nanoparticles with enhanced Seebeck coefficient and low thermal conductivity. Chem. Mater. 22 (10), 3086–3092. doi:10.1021/cm9038297
Chen, W., Pöhls, J.-H., Hautier, G., Broberg, D., Bajaj, S., Aydemir, U., et al. (2016). Under-standing thermoelectric properties from high-throughput calculations: Trends, insights, and comparisons with experiment. J. Mat. Chem. 4, 4414–4426. doi:10.1039/c5tc04339e
Glusker, J. P., and Trueblood, K. N. (2010). Crystal structure analysis: a primer, 14. Oxford University Press.
Guo, Q., and Kleinke, H. (2015). Thermoelectric properties of hot-pressed Tl9LnTe6 (Ln= La, Ce, Pr, Nd, Sm, Gd, Tb) and Tl10− xLaxTe6 (0.90⩽ x⩽ 1.05). J. Alloys Compd. 630, 37–42. doi:10.1016/j.jallcom.2015.01.025
Khan, W. M., Shah, W. H., Khan, S., Shah, S., Syed, W. A., Safeen, A., et al. (2018). Enhanced of thermoelectric properties and effects of Sb doping on the electrical properties of Tl10-xSbxTe6 nano-particles. Int. J. Heat Technol. 36, 602–606. doi:10.18280/ijht.360224
Khan, S., Shah, W. H., Tufail, M., Syed, W. A., and Khan, W. M. (2022). Effects of Sn dopant on power factor of Tl8.67Sb1.33-xSnxTe6 nanoparticles. Chalcogenide Lett. 19, 45–54. doi:10.15251/cl.2022.191.45
Kim, K. T., and Ha, G. H. (2013). Fabrication and enhanced thermoelectric properties of alumina nanoparticle-dispersed Bi 0.5 Sb 1.5 Te 3 matrix composites. J. Nanomater. 8, 2013. doi:10.1155/2013/821657
Kuropatwa, B. A., Assoud, A., and Kleinke, H. (2011). Abdel jalil Assoud, and Holger Kleinke. "Phase range and physical Properties of the thallium tin tellurides Tl10− xSnxTe6 (x≤ 2.2). J. Alloys Compd. Can. 509 (24), 6768–6772. doi:10.1016/j.jallcom.2011.03.182
Kuropatwa, B. A., Guo, Q., Assoud, A., and Kleinke, H. (2014). Optimization of the telluride Tl10-x-ySnxBiyTe6for the Thermoelectric energy conversion. Z. Anorg. Allg. Chem. 640 (5), 774–780. doi:10.1002/zaac.201300577
Kurosaki, K., Uneda, H., Muta, H., and Yamanaka, S. (2004). Thermoelectric properties of thallium antimony telluride. J. Alloys Compd. Jpn. 376 (1), 43–48. doi:10.1016/j.jallcom.2004.01.018
Lin, C-C., Ginting, D., Lydia, R., Lee, M. H., and Rhyee, J. S. (2016). Thermoelectric properties and extremely low lattice thermal conductivity in p-type Bismuth Tellurides by Pb-doping and PbTe precipitation. J. Alloys Compd. 671, 538–544. doi:10.1016/j.jallcom.2016.02.123
Liu, S., Sun, N., Sucharitakul, S., and Gao, X. P. A. (2018). Nanostructured SnSe: Synthesis, doping, and thermoelectric properties. J. Appl. Phys. 123, 115109. doi:10.1063/1.5018860
Luu, S. D., and Vaqueiro, P. (2015). Synthesis, characterisation and thermoelectric properties of the oxytelluride Bi2O2Te. J. Solid State Chem. 226, 219–223. doi:10.1016/j.jssc.2015.02.026
Min, G., Singh, T., Garcia-Canadas, J., and &Ellor, R. (2016). Evaluation of thermoelectric generators by i–v curves. J. Electron. Mater. 45 (3), 1700–1704. doi:10.1007/s11664-015-4180-z
Ouyang, T., Jiang, E., Tang, C., Li, J., He, C., and Zhong, J. (2018). Thermal and thermoelectric properties of monolayer indium tri phosphide (InP3): A first-principles study. J. Mat. Chem. A 6, 21532–21541. doi:10.1039/c8ta07012a
Pradel, A., Tedenac, J. C., Coquillat, D., and Brun, G. (1982). Proprieties of thermoelectric ques de Tl9BiTe6. Rev. Chim. Miner. 19, 43–48.
Rahman, J. U., Nam, W. H., Du, N. V., Rahman, G., Rahman, A. U., Shin, W. H., et al. (2019). Oxygen vacancy revived phonon-glass electron-crystal in SrTiO3. J. Eur. Ceram. Soc. 39, 358–365. doi:10.1016/j.jeurceramsoc.2018.09.036
Sankar, C. R., Bangarigadu- Sanasy, S., and Kleinke, H. (2012). Thermoelectric properties OfTlGdQ 2 (Q= Se, Te) and Tl 9 GdTe 6. J. Electron. Mater. 41 (6), 1662–1666. doi:10.1007/s11664-011-1846-z
Shah, W. H., Khan, A., and Syed, W. A. (2016). Effects of Pb doping on the thermoelectric properties of Tl8. 67PbxSb1. 33-xTe6 materials. Xiv preprint arXiv:1610.00849.
Skomedal, G., Kristiansen, N. R., Engvoll, M., and Middleton, H. (2014). Methods for enhancing the thermal durability of high- Temperature thermoelectric materials. J. Electron. Mater. Nor. 43 (6), 1946–1951. doi:10.1007/s11664-013-2917-0
Tufail, M., U Rahman, A., Gul, B., Akram, W., Ullah, H., Iqbal, M. W., et al. (2021). Effect of Pb doping on electronic and thermoelectric properties of thallium antimony telluride (Tl8.33Sb1.67−Pb Te6) nano-compound: A combined experimental and theoretical investigations. Phys. Condens. B 608, 412789. doi:10.1016/j.physb.2020.412789
Xia, M., Record, M. C., and Boulet, P. (2023). Investigation of PbSnTeSe high-entropy thermoelectric alloy: A dft approach. A DFT Approach Mater. 16, 235. doi:10.3390/ma16010235
Yamanaka, S., Kosuga, A., and Kurosaki, K. (2003). Thermoelectric properties of Tl9BiTe6. J. Alloys Compd. 352 (1-2), 275–278. doi:10.1016/s0925-8388(02)01114-3
Yu, B., Zhang, Q., Wang, H., Wang, X., Wang, H., Wang, D., et al. (2010). Thermoelectric property studies on thallium-doped lead telluride prepared by ball milling and hot pressing. J. Appl. Phys. U. S. A. 108, 016104. doi:10.1063/1.3452323
Yu, B., Zhang, Q., Wang, H., Wang, X., Wang, H., Wang, D., et al. (2010). Thermoelectric property studies on thallium-doped lead telluride prepared by ball milling and hot pressing. J. Appl. Phys. 108, 016104. doi:10.1063/1.3452323
Keywords: Sb-doped thermoelectric materials, Seebeck coefficient, thermoelectric materials, electrical conductivity, power factor
Citation: Khan S, Shah WH, Tufail M, Ali A, Eldin SM, Imran N and Sohail M (2023) Sb-doped Tl8.67 Sn1.33-xSbx Te6 nanoparticles improve power factor and electronic charge transport. Front. Mater. 10:1108048. doi: 10.3389/fmats.2023.1108048
Received: 25 November 2022; Accepted: 18 January 2023;
Published: 08 February 2023.
Edited by:
Safia Akram, National University of Sciences and Technology, PakistanReviewed by:
Liaquat Ali Lund, Sindh Agriculture University, PakistanCopyright © 2023 Khan, Shah, Tufail, Ali, Eldin, Imran and Sohail. This is an open-access article distributed under the terms of the Creative Commons Attribution License (CC BY). The use, distribution or reproduction in other forums is permitted, provided the original author(s) and the copyright owner(s) are credited and that the original publication in this journal is cited, in accordance with accepted academic practice. No use, distribution or reproduction is permitted which does not comply with these terms.
*Correspondence: M. Tufail, dHVmYWlsLnBoZHBoeTYxQGlpdS5lZHUucGs=; Wiqar H. Shah, d2lxYXIuaHVzc2FpbkBpaXUuZWR1LnBr; Muhammad Sohail, bXVoYW1tYWQuc29oYWlsQGtmdWVpdC5lZHUucGs=
Disclaimer: All claims expressed in this article are solely those of the authors and do not necessarily represent those of their affiliated organizations, or those of the publisher, the editors and the reviewers. Any product that may be evaluated in this article or claim that may be made by its manufacturer is not guaranteed or endorsed by the publisher.
Research integrity at Frontiers
Learn more about the work of our research integrity team to safeguard the quality of each article we publish.