 João PF Grilo1
 Atul Jamale
 Filipe ML Figueiredo
 Fernando MB Marques
95% of researchers rate our articles as excellent or good
Learn more about the work of our research integrity team to safeguard the quality of each article we publish.
Find out more
REVIEW article
Front. Mater. , 28 September 2022
Sec. Energy Materials
Volume 9 - 2022 | https://doi.org/10.3389/fmats.2022.993583
This article is part of the Research Topic Celebrating 20 Years of CICECO – Aveiro Institute of Materials - Current and future perspectives in the use of Material Sciences, Chemistry, and Photonics for a more sustainable future View all 20 articles
This work provides an overview on established achievements and debatable findings involving Ca, Gd or Sm-doped ceria-based electrolytes, using Li2CO3, LiNO3 and Na2CO3 as sintering aid or as second phase. The performance of these materials is discussed considering the characteristics of the oxides and of the salts or derived second(ary) phases (e.g., alkali metal oxides and hydroxides, eutectic mixtures), extensively surveyed to identify influential parameters with respect to processing and electrical performance (e.g., melting and boiling points, thermal decomposition, hydrolysis). The analysis of published data highlights the possible contribution of additional charge carriers to the total conductivity, besides oxide-ion vacancies. Claimed bulk and grain boundary conductivity enhancements are deeply discussed, as well as advantages and limitations of impedance spectroscopy as characterization tool. Irrespective of controversial reasons, reports on unusual improvements of grain boundary conductivity sustain the possibility of advanced grain boundary engineering to enhance the performance of these materials.
Solid oxide fuel cells (SOFCs) are devices able to convert chemical into electrical energy via electrochemical reactions, where electrolyte and electrodes play a key role. Lower processing and operating temperatures are desirable targets to decrease cost and improve long term performance. Ceria-based ceramics are promising electrolyte materials due to their high ionic conductivity with respect to conventional zirconia-based electrolytes, enabling lower operating temperatures (Mogensen et al., 2000; Kharton et al., 2004). Drawbacks include the partial reduction of Ce4+ to Ce3+ under reducing conditions, also the high sintering temperatures (>1500°C) needed to achieve almost full densification (Inaba and Tagawa, 1996; Kharton et al., 2001).
Chemical routes, yielding reactive ceria-based powders, were exploited to lower sintering temperatures (Herle et al., 1997; Chinarro et al., 2007; Ding et al., 2008; Moure et al., 2009; Cela et al., 2011; Teoh and Chiang, 2012). Large attention was also given to sintering aids, including transition metal oxides (Kleinlogel and Gauckler, 2000; Fagg et al., 2002; Avila-Paredes and Kim, 2006; Pérez-Coll et al., 2006; Pikalova et al., 2007; Gao et al., 2010; Ge et al., 2011; Xu et al., 2011; Villas-boas et al., 2014; Taub et al., 2015; Neuhaus et al., 2018a, 2018b; Santos et al., 2018), and alkali metal salts (Nicholas and De Jonghe, 2007; Li et al., 2012; Le et al., 2013; Zhu et al., 2014; Maheshwari and Wiemhöfer, 2016). Sintering temperatures around 1000°C are easily reached using these admixtures, providing high densifications (in the 95–99% range), and regular grain size distributions.
This work exploits alternative explanations to claimed conductivity enhancements of selected materials using salts as sintering aids or second phases. Bulk conductivity augmentation is hardly explained by conventional effects involving dopant concentration and/or mobility of ionic defects (Figueiredo and Marques, 2013). Thus, emphasis is dedicated to grain boundary effects, large in most reports. Own expertise in similar materials provides a sound background for this purpose (Grilo et al., 2019, 2020; 2021a; 2021b).
Selected examples used in this work might be described as typical of debatable findings, deviating from a conventional review where extensive sets of data on similar oxides are collected and discussed. Here, emphasis is on data on distinct salt-derived phases that might coexist under specific conditions, yielding unusual performance effects. Proper consideration of second(ary) phase effects is almost absent from previous analyses in the literature. While new hypotheses are introduced to explain some findings, there is no intention to disregard previous explanations. The complexity of studied systems cannot be ignored. The presence of minor salt-derived phases is a clear source of uncertainty. Molten phases easily originate quasi steady state rather than true equilibrium conditions. Even in solid state systems, due to slow equilibration kinetics, exact phase boundaries are often uncertain (e.g., see (Duwez et al., 1952; Grain, 1967; Stubican, 1986; Duran et al., 1991)).
This work has a clear focus on ceria-based solid electrolytes, in contrast to composites involving one oxide and one molten phase (e.g., see (Benamira et al., 2007; Ferreira et al., 2011b; Rondão et al., 2013)). The borderline between these families of materials is established by the fully dominant solid-state condition. In oxide+molten salt composites, the molten phase corresponds to more than 10 vol%, and is conceived as provider of specific functionalities, like additional ionic pathway in fuel cells or CO2 gas separation membranes (Li et al., 2009; Patrício et al., 2014).
The electrical characterization of single-phase solid electrolytes is often based on impedance spectroscopy measurements. This technique provides information on contributions within the bulk grains, across grain boundaries and even on the electrolyte/electrode interfacial processes of a polycrystalline ceramic electrolyte (Van Dijk and Burggraaf, 1981; Maier, 1986; Guo et al., 2002, 2003).
The presence of a second phase, even in minor amounts, can be the source of disturbance of impedance arcs. Porous electrolytes are one of the best studied examples, showing that pore size distribution and volume fraction influence the so-called bulk and grain boundary arcs (Roberts and Schwartz, 1985; Kleitz and Steil, 1997; Pérez-Coll et al., 2010; Marrero-López et al., 2014; El Khal et al., 2017; Cordier et al., 2019). For dispersed insulating phases within a conducting phase, the effective medium theory offers proper background for data analysis (Maxwell, 1904; Kleitz and Steil, 1997). The often-disregarded complexity of analysis in electrolytes with two potential conducting phases is hereby addressed, including a survey of impedance spectra characteristics and corresponding equivalent circuits.
Materials considered in this work are based on ceria, with Ca, Gd or Sm as dopants. The first composition is interesting with respect to (low) cost, the remaining compositions are electrolytes with premium ionic conductivity. This selection is enough to cover a variety of situations where interaction between oxide and salt (or derived phases) might reveal distinct characteristics. Table 1 shows the acronyms and basic properties of these high-density ceramic refractory materials.
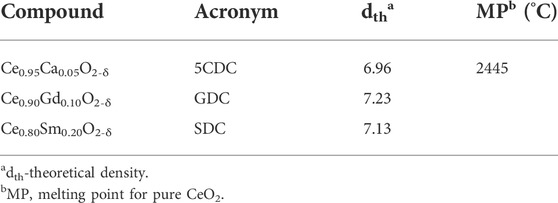
TABLE 1. List of acronyms and selected physical properties of single-phase electrolytes (Duran et al., 1990; Zha et al., 2003; Maheshwari and Wiemhöfer, 2016).
Salts are often used only as sintering aids (Nicholas and De Jonghe, 2007), as those listed in Table 2. Carbonates or nitrates, the most common admixtures, might end up as oxides or hydroxides, after thermal processing or exposure to specific environmental species. Comparison with data from Table 1 shows the sharp difference in density and melting point between these compounds and previous oxides.
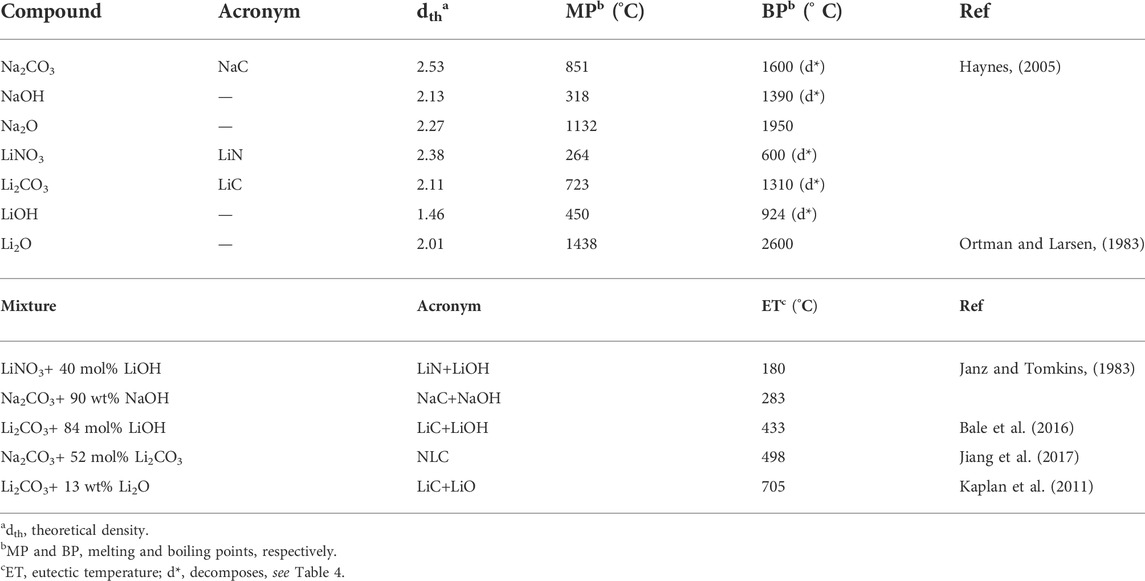
TABLE 2. List of acronyms and selected physical properties of salts, derived compounds and eutectic mixtures.
Table 3 shows the exact compositions and firing conditions experienced by electrolytes considered in this work, grouped according to data sources rather than composition. The first three rows correspond to materials prepared by authors from distinct institutions. The last row includes three materials prepared in one single institution (own work). These materials will be used as reference.
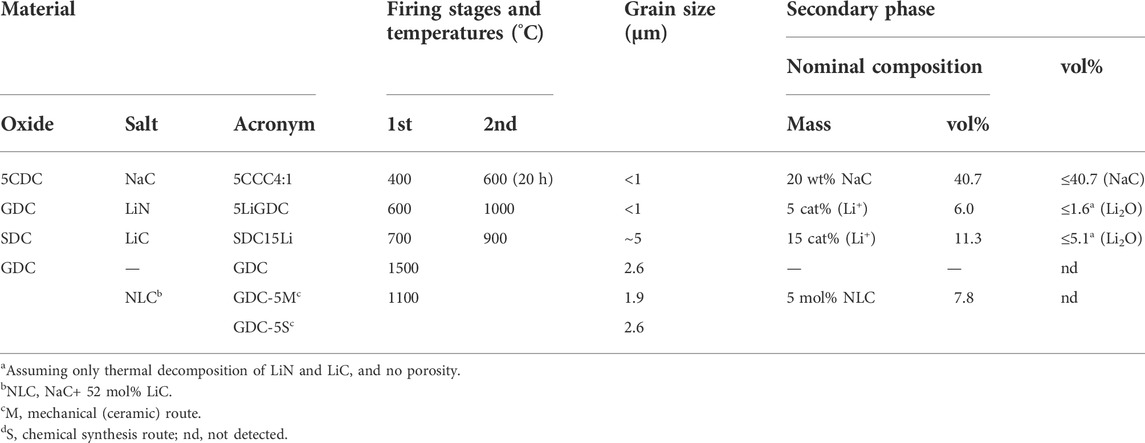
TABLE 3. List of ceria-based solid electrolytes (from top to bottom: Maheshwari and Wiemhöfer, 2016; Zhu et al., 2014; Li et al., 2012; Grilo et al., 2020).
Materials acronyms in Table 3 were partly introduced in Tables 1, 2. These follow closely those adopted in the source references. However, the range of combinations is wide, and a few examples are used to assist in the capture of the meaning of acronyms. 5CCC4:1 means a Ceria (5CDC) - Carbonate (NaC) - Composite with a 4:1 weight ratio. 5LiGDC means GDC with 5 cat% Li+. GDC-5S corresponds to GDC with 5 mol% NLC, prepared by a chemical synthesis (S) route. The extension (M) in GDC-5M designates a ceramic route, starting with mechanical milling. SDC15Li is SDC with 15 cat% Li+. When needed, the material acronym also includes a reference to the highest firing temperature (e.g., SDC15Li-900 means SDC15Li sintered at 900°C). Table 3 also provides information on grain size and vol% of distinct phases, with impact on electrical performance.
The first obvious conclusion from these data is that processing temperatures are below salt melting (5CCC4:1), exceed the salt melting and boiling points (5LiGDC), or surpass only the melting point of precursor salts (SDC15Li-900).
Salts are also likely to suffer total or partial decomposition during thermal processing. Table 4 lists typical examples of known reactions, conversion levels and conditions. NaC (used in 5CCC4:1) is expected to be preserved after firing at 600°C. Melting is only at 851°C, and thermal decomposition is significant only above the sintering temperature (600°C). LiN (used in 5LiGDC) might easily boil but also partly decompose, being converted into Li2O. LiC (used in SDC15Li) is expected to be partly converted to Li2O. NLC (used in GDC-5S and GDC-5M), the eutectic mixture of NaC and LiC, melts at around 500°C. The stability of this phase is high at moderate temperatures (e.g., 650°C), but volatilization and even decomposition to oxides are likely at higher temperatures. These comments explain the values listed in the last column of Table 3, on predictable higher limits of oxides, from thermal decomposition of salts.
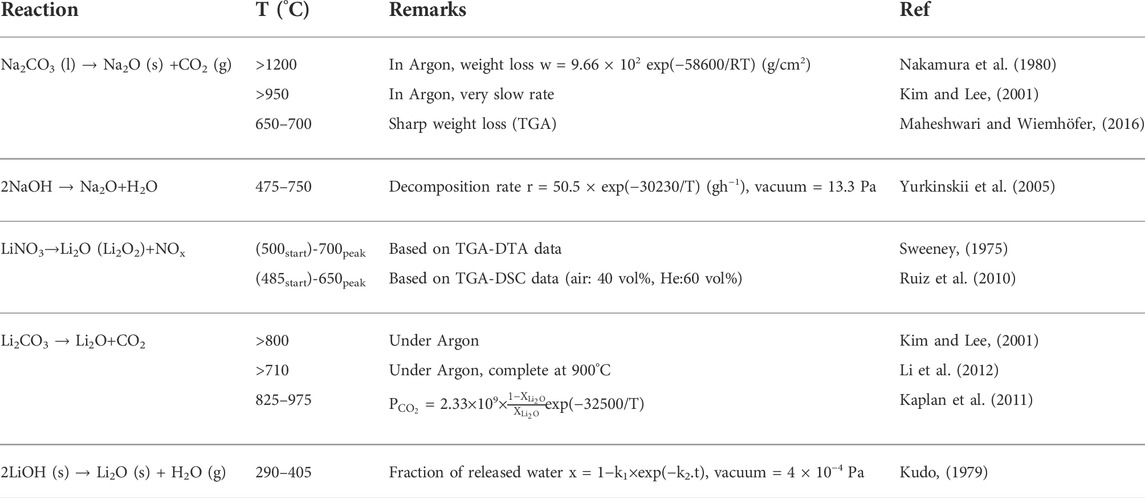
TABLE 4. Selected reactions involving alkali metal-based materials.
Standard “lab working conditions,” involving ambient air during measurements (with moisture and CO2), and unknown/diverse storage conditions of samples, are additional sources of considerable uncertainty. As example, an investigation on the hydrolysis of lithium oxide showed that the starting material (nominally pure Li2O) consists of particles with a Li2O core covered by a LiOH protective shell (Weber et al., 2018). Furthermore, the loss of water from alkali hydroxides is not fast or easy, requiring high temperatures and long periods of time (see Table 4).
5CDC with NaC should have a considerable volume fraction of this phase (30–40 vol%), the most stable with respect to the adopted thermal processing (600°C). SDC with LiC should have a moderate volume fraction of Li2O and/or LiOH (up to 5.1 vol%). The oxide is the most stable phase with respect to the thermal processing steps (up to 900°C), but the hydroxide should form easily from exposure to moisture. GDC with LiN should have a residual volume fraction of Li2O (up to 1.6 vol%) and/or LiOH, since LiN starts decomposing before boiling and the oxide and hydroxide are the most stable after the adopted processing temperature (1000°C). GDC-5S and GDC-5M might have residual amounts of alkali-metal carbonates, oxides and/or hydroxides.
The likely presence of alkali oxides and/or hydroxides in these materials is source of additional phase interactions. Table 2 lists eutectic compositions involving these compounds. The corresponding eutectic temperatures, starting below 200°C, are commonly used in electrical measurements. Partial decomposition of carbonates and nitrates, besides melting and boiling, were considered in the literature only as part of the processing route (Stern and Weise, 1969; Nakamura et al., 1980; Kim and Lee, 2001; Singh and Singh, 2007; Ruiz et al., 2010; Olivares, 2012; Lee et al., 2013). The presence of hydroxides, confirmed in different situations (Lapa et al., 2010; Ferreira et al., 2011a; Xing et al., 2015), is mostly disregarded.
As summary, in ceria-based solid electrolytes with salts, the nominal and actual phase compositions can be quite distinct because of the effects of multiple processing parameters (e.g., gas phase composition, weight losses during firing, weight gain during storage or measurements). Since the kinetics of some reactions is also slow, studied materials include metastable phases, with their proportions changing during measurements under diverse conditions. As example, conductivity hysteresis was found only during a first heating/cooling cycle in Na-doped ceria (Pearce and Thangadurai, 2009).
The presence of Li and/or amorphous phases in these electrolytes decreases the efficacy of energy-dispersive X-ray spectroscopy (EDS) to properly map chemical compositions, or X-ray diffraction (XRD) for complete phase identification. These limitations should be understood only as background information on potential scenarios behind published reports.
Table 5 includes data obtained with Na2CO3, Li2CO3 and LiNO3 salt additions, and ceria-based electrolytes (CDC, GDC and SDC) (Li et al., 2012; Zhu et al., 2014; Maheshwari and Wiemhöfer, 2016).
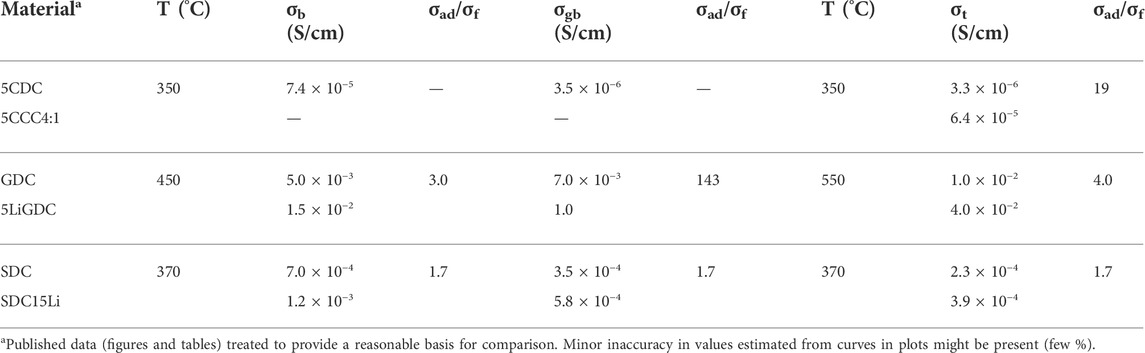
TABLE 5. Literature data on bulk (σb), grain boundary (σgb) and total conductivity (σt) of electrolytes without and with salt additions (Li et al., 2012; Chen et al., 2014; Maheshwari and Wiemhöfer, 2016). Conductivity ratios (σad - material with admixture; σf - admixture free) highlight conductivity enhancements (see Tables 1–3 for acronyms).
These data show impressive, claimed conductivity enhancements for salt containing materials with respect to pure (salt free) oxides, reaching factors of 3 in bulk conductivity, 143 in grain boundary conductivity, and 19 in total conductivity. While all microstructures are slightly distinct, grain size is between 1 and 5 μm (Table 3), and densifications exceed 95%. Sintering temperature, duration, and sintering aids, originate distinct grain size and densification effects, preventing fully comparable sets of sintering parameters and final microstructures.
The microstructural characteristics of these materials can be obtained from a combination of information on grain size (in the order of 1 μm for 5CCC4:1 and 5LiGDC and 5 μm for SDC15Li (Li et al., 2012; Chen et al., 2014; Maheshwari and Wiemhöfer, 2016)) and of volume percentage of the likely residual second phase, after sintering (NaC or Li2O, see Table 3). Assuming a conventional brick-layer model (see Section 5 for details), volume fractions can be used to relate grain size (D) and grain boundary thickness (δgb), as depicted in Figure 1.
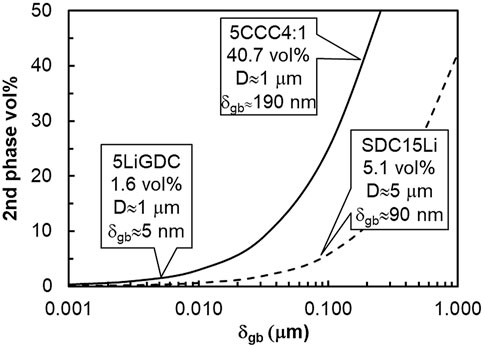
FIGURE 1. Estimated volume fraction of second phases and different grain sizes, based on the brick-layer model (see section 5 for details). Materials considered here are identified in Table 3.
Typical values of δgb in ionic conductors range between a few nm and a few dozens of nm (Kingery, 1974b, 1974a; Christie and Van Berkel, 1996). Increasing the grain boundary thickness, the volume fraction of this region easily slides to values in excess of 10 vol%, which is already composite territory. With more than 30 vol% of a second phase, percolation is almost inevitable (Jiang and Wagner, 1995). Materials under consideration here include thin grain boundaries (5LiGDC, δgb ≈ 5 nm), moderately thick grain boundaries (SDC15Li, δgb ≈ 90 nm), and others clearly seating in the composites category (5CCC4:1), with a “nominal grain boundary thickness” around 190 nm.
For CDC-based electrolytes, NaC is present in large quantity (about 40 vol%), percolating throughout the material. Figure 2 shows the electrical conductivity of 5CDC, 5CCC4:1, and likely secondary phases. Irrespective of this overpopulated plot, naked eye analysis immediately shows that several secondary phases exceed the conductivity of 5CDC (□) or even 5CCC4:1 (∆).
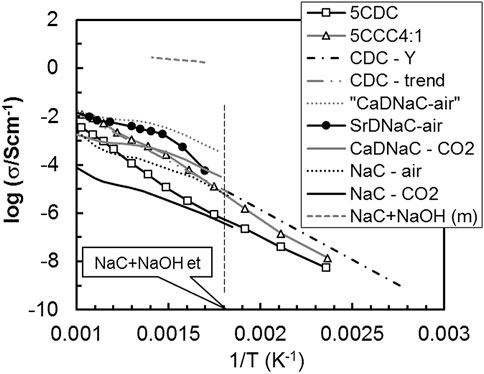
FIGURE 2. Total conductivity (σ) versus the reciprocal of absolute temperature (1/T) of Ca-doped ceria electrolytes with and without salts, and possible secondary phases (Cerisier and Roux, 1978; Janz and Tomkins, 1983; Guth et al., 1987; Yamashita et al., 1995).
With respect to salts, pure NaC (in CO2 and air) and Sr or Ca-doped NaC are all considered. The trends are for higher conductivity of NaC in air with respect to CO2 (see NaC curves), also higher conductivity of Ca-doped NaC with respect to pure NaC (see CaDNaC curve in Figure 2). 5CCC4:1 shows conductivity levels within the range of values reported for pure NaC in air or CaDNaC in CO2.
The consideration of Ca or Sr-doped NaC deserves a short comment. Doped NaC has a conductivity higher than pure NaC. This is a consequence of the formation of mobile and negatively charged Na+ vacancies (VNa′, in Kröger-Vink notation) to compensate the presence of positively charged M2+ ions (M = Ca2+ or Sr2+) in normal Na+ lattice positions
The Na+ vacancies are the dominant charge carriers in Ca-doped NaC, and the effect of Ca-doping was demonstrated measuring the electrical conductivity of materials with dopant concentrations increasing up to 0.093 mol% (Figure 2 (Cerisier and Roux, 1978)). The 5CDC electrolyte could easily be the source of minor amounts of Ca as dopant of NaC, where only 0.1 mol% is a meaningful level.
The “fictional” curve suggested for CaDNaC in air exceeds the values in CO2 by one order of magnitude, taking into consideration that these relative magnitudes were observed for pure NaC in air and in CO2. To corroborate this approach, data for SrCO3 (1 mol%)-doped NaC, in air, is also plotted (Guth et al., 1987). These results are impressively close or even exceed those observed for 5CCC4:1. Overall, the high-volume fraction (about 40 vol%) of NaC in these composites would justify the consideration of the exact role of this phase in the composite material.
If, irrespective of cautious thermal processing, some NaC partly decomposed to Na2O, and converted into NaOH, the presence of liquid phase (acronym extension “m” for molten) could be expected at temperatures as low as 283°C. Alkali salts or hydroxides show extremely high values of electrical conductivity above melting, in the range 0.1–1 Scm−1 (Li et al., 2007). The electrical conductivity of the NaC+NaOH eutectic composition is also plotted in Figure 2 to highlight this fact. The presence of a molten phase (NaC+NaOH (m)), even a few vol%, could explain or contribute to the observed high conductivity. Molten phases easily spread and percolate in between grains.
If present in significant amounts, a solid to liquid transition often appears as a sharp change in conductivity with temperature (elongated z-shape in Arrhenius plots). The observed conductivity trend for 5CCC4:1 indeed shows a slight upwards bending close to the NaC+NaOH eutectic temperature (NaC+NaOH et), highlighted in Figure 2 (vertical dashed line). This is the opposite of the downwards bending observed at high temperature in ceramic oxide-ion conductors. This is not a demonstration of the presence of a molten phase but justifies due consideration of this possibility.
LiN was added in a small quantity (5 cat% Li+) to GDC, sintered at a temperature (1000°C) where melting, boiling and partial salt thermal decomposition are expected. If either LiN, or Li2O, or LiOH were present, molten phases could be found starting at temperatures as low as 264°C (melting of LiN), 480°C (melting of LiOH) or even 180°C (LiN+LiOH eutectic temperature). However, the total equivalent amount of Li2O is below 1.6 vol% in the studied electrolyte. From a microstructural point of view, the material has the features of a polycrystalline ceramic with a thin grain boundary.
Figure 3 shows multiple sets of data on the electrical conductivity of distinct materials. Unlike the previous case of NaC+CDC, the reported solid LiN conductivity values are all below the conductivity of 5LiGDC1000. Pure LiN has a phase change with some hysteresis on heating/cooling, with the breaking region shown within a dashed circle (Figure 3), separating data for the two solid LiN phases (s1 and s2, (Claes and Glibert, 1985; Yamashita et al., 1995; Skobelev et al., 1996; Zhu et al., 2014)).
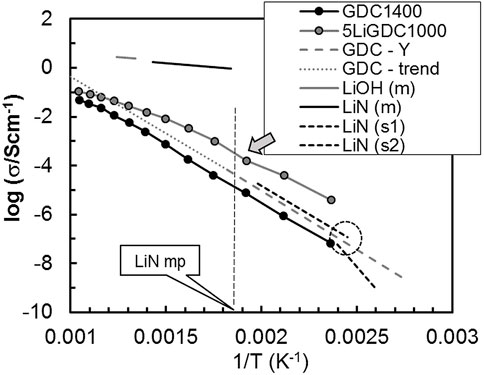
FIGURE 3. Total conductivity (σ) versus the reciprocal of absolute temperature (1/T) of GDC without and with LiN and possible secondary phases (Claes and Glibert, 1985; Yamashita et al., 1995; Skobelev et al., 1996; Zhu et al., 2014). See text for details.
The electrical conductivity of molten LiN and molten LiOH (acronyms with extension “m”) highlights the enormous impact that minor amounts of these phases would have on conductivity. Again, a small upwards bending in the conductivity curve of 5LiGDC1000 (see arrow in Figure 3) coincides with the melting point (mp) of LiN (signaled with a vertical dashed line). Accordingly, the potential presence of molten LiN could be considered as a possible source of unusual conductivity contributions.
Recently, the addition of NaC+LiC (NLC) to GDC, was assessed in own work, to decrease the GDC sintering temperature to 1100°C (Grilo et al., 2020). This is above the eutectic point of NLC (500°C). We recall that materials with a small amount of NLC (5 mol%) were prepared using a ceramic route starting with mechanical milling (M) or a wet chemical synthesis route (S). There was no evidence for localized spots of Na in any sample, and lattice parameters also did not show evidence for solubility of alkali-metal ions in the ceria lattice. Figure 4 depicts low temperature impedance spectra for these materials in air. An introduction to this type of plots is skipped here since these are rather standard in the literature on solid electrolytes.
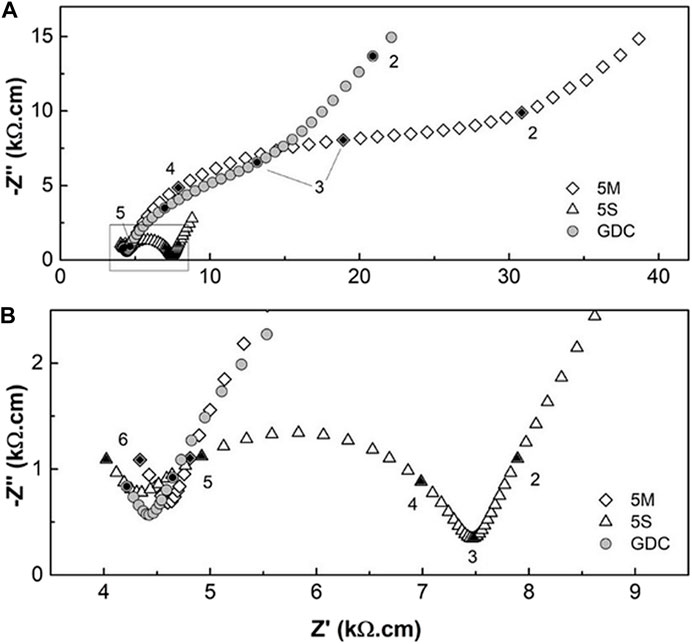
FIGURE 4. (A) Impedance spectra of GDC materials without and with NLC as sintering aid; (B) zoomed area from (A). Numbers close to data points correspond to the log10 of the frequency (Hz). Adapted from (Grilo et al., 2020). See text for details.
Figure 4 shows that the same sintering admixture might affect the performance of these materials in distinct manners, depending on the exact processing route. We invoke these materials here since we can fully compare couples of materials versus performance (e.g., “S” versus “M” routes, or pure GDC versus “M” route). All materials were prepared using the same chemicals and shaping routes, and final grain size (around 2–2.5 μm) and densifications (close to 100%) are comparable. Fluctuations often found in data obtained in distinct labs, are ruled out here.
The impedance spectra in Figure 4 include two arcs at high and intermediate frequency usually attributed to the contributions of bulk (higher frequency range) and grain boundary (intermediate frequency range). An incipient third arc, in the low frequency range, indicates the contribution of electrode processes. Figure 4B shows that there is no meaningful bulk impedance effect, only a slight data scatter. However, when obtained by wet chemistry (GDC-5S), materials present a much lower grain boundary resistivity (Figure 4A). We could add extra evidence to show that materials with high densification, show slight changes in bulk conductivity, but grain boundary conductivity is highly sensitive to contact with salts (e.g., see (Grilo et al., 2021b)).
LiC was added in considerable amounts (15 cat% Li+) to SDC. Sintering of these samples was performed at temperatures where melting and even thermal decomposition of LiC would be expected. The upper value of about 5 vol% of a secondary phase after sintering (as Li2O) shows that this material is in the transition from a typical polycrystalline ceramic to a composite. If LiC, Li2O, or LiOH, were present, molten phases could be found starting at temperatures as low as 723°C (melting of LiC), 480°C (melting of LiOH) or 705°C (LiC+ Li2O eutectic temperature). Figure 5 shows multiple sets of data on the electrical conductivity of SDC and likely secondary phases. The reported pure solid salt (LiC) conductivity is anisotropic (parallel or perpendicular to plane (002)), with distinct values depending on direction. In all cases, the performance of solid LiC is below the performance of SDC15Li-900.
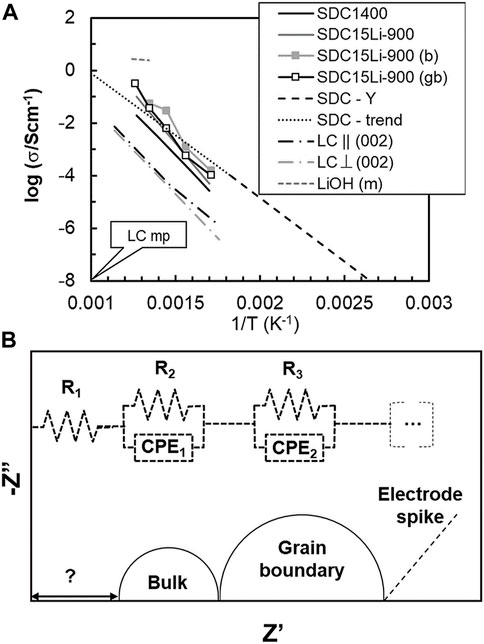
FIGURE 5. (A) Total conductivity (σ) versus the reciprocal of absolute temperature (1/T) of SDC without and with LiC and possible secondary phases (Claes and Glibert, 1985; Dissanayake and Mellander, 1986; Mizusaki et al., 1992; Yamashita et al., 1995; Li et al., 2012); (B) schematic drawing of the reported equivalent circuit (Li et al., 2012).
The electrical conductivity of molten LiOH is also shown in Figure 5 to highlight again the enormous impact that minor amounts of a molten phase may have on conductivity. The most controversial aspect in this case is related to the claimed temperature dependence of bulk and grain boundary conductivity, which deviates considerably from common trends for SDC1400 and SDC15Li-900. Activation energies for electrical conductivity in clear excess of 1 eV are unusual in ceria-based electrolytes (see SDC-Y and SDC trend lines, Yamashita et al., 1995). Deeper analysis of source data might explain these findings.
Impedance spectra reported at temperatures below 400°C show two arcs and a spike at low frequency, schematically reproduced in Figure 5, together with the adopted equivalent circuit. The lower frequency arc is interpreted as typical of grain boundary performance and the higher frequency arc is related to the bulk performance (Li et al., 2012). The high frequency intercept of this arc with the Z’ axis (real part of impedance) is distant from the origin. To account for this situation the authors introduced a resistor (R1 > 100 ohm) in series with bulk (R2||CPE1) and grain boundary (R3||CPE2) standard parallel R||CPE circuits (resistance||constant phase element). However, no physical meaning was provided for R1. Standard setups (external electrical cables and cell wiring/electrodes) hardly show a resistance compatible with the reported value of R1. The analysis of these data is halted here. Additional comments on impedance spectroscopy measurements are provided in the last section of this work.
Ceria-based electrolytes are oxide-ion conductors where the prevailing defects are acceptor dopants (e.g., Ca, Gd or Sm, negative defects as substitutional dopants) and oxide-ion vacancies (positive defects). Enhanced bulk conductivity must rely on enhanced concentration and/or mobility of oxide-ion vacancies.
The presence of alkali metal ions (Na+, Li+) in solid solution could imply an enhanced concentration of oxide-ion vacancies to balance the total concentration of dopants. The dimensions of these ions for 8-fold coordination (1.18, 0.92 and 0.97 Å for Na+, Li+ and Ce4+, respectively (Shannon, 1976)), seem consistent with the possibility of partial replacement. The solubility of up to 7 cat% Na+ in ceria was assumed from XRD patterns (Pearce and Thangadurai, 2009), but without consensus (Grilo et al., 2020). The solubility of Li+ in ceria also seems controversial. This possibility was raised due to variable lattice parameter of GDC after distinct firing conditions (Zhu et al., 2014). However, in the case of SDC, the XRD patterns showed no changes and this was interpreted as sign of no solubility of Li+ in the lattice (Li et al., 2012). In any case, Li was lost from the SDC15Li samples with increasingly high sintering temperatures, with only 1.5 cat% remaining in SDCLi15 fired at 800°C (Li et al., 2012).
The plausible simplified electroneutrality conditions, assuming that alkali metal ions are dissolved in ceria, should be:
for Na+
as additional dopant in calcia-doped ceria, and
for Li+ as additional dopant in rare earth (RE)-doped ceria, with RE = Gd3+ or Sm3+. The total concentration of oxide-ion vacancies
Dissolved Na+ would imply an enhanced concentration of oxide-ion vacancies but impedance spectroscopy showed an extremely poor electrical conductivity for 7 cat% Na+, about two orders of magnitude lower than reported for pure SDC (Pearce and Thangadurai, 2009). From simple charge balance effects, 7 cat% Na+ as dopant should be identical to 21 cat% Gd3+ or Sm3+. A conductivity two orders of magnitude lower with respect to SDC must imply vestigial solubility of Na+ or deep trapping of oxide-ion vacancies due to strong defect association. The latter effect would be expected for heavily (triply) charged acceptor dopant defects (NaCe‴) with strong tendency to associate with positively (double) charged oxide-ion vacancies. Bulk oxide-ion conductivity enhancements, without substantial increase in the activation energy of ionic conduction, are inconsistent with this picture.
Following a similar reasoning, in the case of Li+ as dopant, the reported low solubility (negligible?) cannot justify substantially higher concentration of oxide-ion vacancies. A negative impact on the mobility of oxide-ion vacancies should also be considered since dopants smaller than the host cation originate local lattice strain effects (Mogensen et al., 2000; Skinner and Kilner, 2003). There is no apparent rationale for a reported bulk conductivity enhancement (up to three times higher, see Table 5) when salts with Li are used as sintering admixtures. Both, concentration and mobility of oxide-ion vacancies, are unable to explain this claim. Enhanced bulk conductivity effects exceed what might be considered the state-of-the-art knowledge on the defect chemistry of these systems.
Unlike for bulk conductivity, grain boundary effects may easily surpass one order of magnitude (Table 5). However, significant grain boundary improvements are claimed in situations ranging from 1 to about 40 vol% of secondary phases. This diversity of situations justifies distinct attempts to explain grain boundary effects.
Early work in the field of ceramic electrolytes identified clear correlations between total conductivity and temperature. In Arrhenius-type plots of ln(σt) versus 1/T, the low temperature activation energy often exceeds the high temperature activation energy, and the effect is enhanced in materials with low purity or small grain size. With the adoption of impedance spectroscopy as characterization tool, two distinct contributions could be clearly identified, corresponding to the bulk and grain boundary (Bauerle, 1969). Defect association is also noticed in the low temperature range (Mogensen et al., 2000; Skinner and Kilner, 2003), but this will be ignored here.
The classical description used to explain grain boundary effects is shown as scheme in Figure 6A). Grain boundaries are understood as a crystallographic feature, where crystal misorientation and presence of impurities implies excess energy requirements for ionic migration, and interfacial polarization effects.
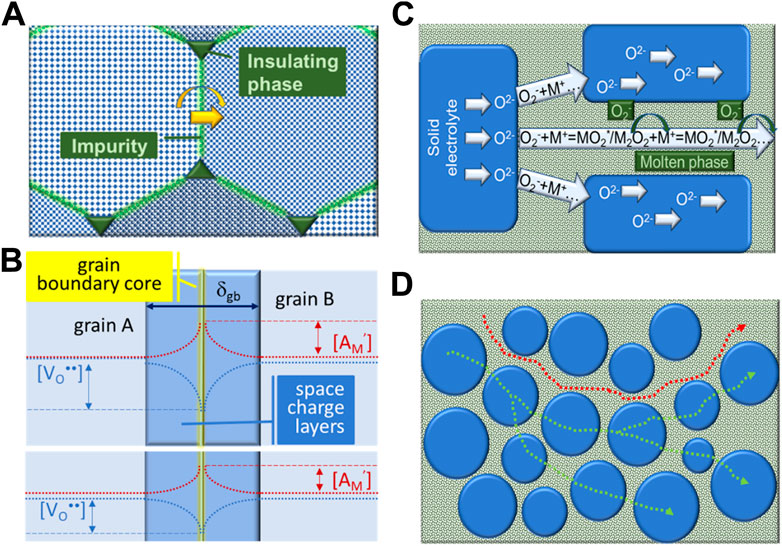
FIGURE 6. Grain boundary schemes: (A) traditional description, including crystallographic orientation mismatch between grains, impurities in the grain boundary region and insulating particles in triple contact points (Bauerle, 1969); (B) electrical grain boundary, with core, space charge layers and concentration profiles of acceptor dopant ([AM’]) and oxide-ion vacancies ([VO••]) (Guo et al., 2003; Guo and Waser, 2006). In the lower insert, levelling of concentration profiles due to an extrinsic species acting as local scavenger (Zhu et al., 2014); (C) combined oxide-ion transport mechanisms, where several species might assist O2− transport in between grains or along the salt phase; (D) single (salt) phase and dual phase O2− pathways (Maheshwari and Wiemhöfer, 2016). See text for details.
Secondary phases, namely impurities, might be wetting and covering the entire grain boundary region (blocking ion transport), or might be non-wetting, forming isolated particles in triple joints between multiple grains. The discovery of grain boundary “scavenging” agents, able to combine chemically with impurities/glassy phases, forming isolated particles in joints between grains, like addition of alumina to zirconia-based electrolytes, is a good example of this process. This description, even if more than 40 years old, is still used in many cases to explain grain boundary conductivity improvements (Beekmans and Heyne, 1976; Butler and Drennan, 1982; Guo et al., 1995; Zhang et al., 2004; Sudarsan and Krishnamoorthy, 2018).
Several authors introduced a distinct grain boundary concept, often named as electrical grain boundary (Guo et al., 2003; Guo and Waser, 2006). In acceptor doped oxide-ion conductors, the defect concentrations in the grain boundary region deviate from bulk values due to segregation of dopant. Their negative charge equalizes a positively charged grain boundary core, which in turn implies the depletion of oxide-ion vacancies in the same region. The overall consequence is the formation of space charge layers around the grain boundary core, decreasing locally the oxide-ion conductivity due to an enhanced electrical potential barrier and depletion of mobile defects. This model is able to explain why ions are partly blocked in high purity materials. The physical scheme used to describe these situations is shown in Figure 6B.
The presence of salts in considerable amounts introduced the need to consider the role of this phase in such materials. As first remark, the concept of grain boundary conductivity seems inaccurate in this case. In the presence of large concentrations of both phases, the oxide grains are fully covered by the salt phase. This means that the often measured “grain boundary” conductivity corresponds to a designation “freely” adopted from the field of polycrystalline solid electrolytes, where impedance spectra can be deconvoluted into bulk, grain boundary and electrode contributions, as introduced earlier.
Having in mind this remark, an enhanced “grain boundary” performance was explained in 5CCC4:1 composites by the presence of a highly conductive phase in the inter-grain region, where several species provide net transport of oxide ions (Maheshwari and Wiemhöfer, 2016). The firstly suggested cooperating mechanism involved the net transport of O2− (superoxide), via NaO2* (intermediate species) and Na2O2 (peroxide), as drafted in Figures 6C,D.
The idea was revised after consideration of the possible role of CO2, involving several elementary reactions:
and
inside Na2CO3, where CO2 moves via pores of Na2CO3. Other mechanisms can be envisaged, involving water molecules and OH− ions:
Water vapor is present in ambient air and water molecules are known to easily combine with Na2O or Li2O. Fast transport of OH− and fast diffusion of water molecules is expected in molten phases. In fact, the diffusion coefficient of water molecules in molten hydroxides (or salts) is one order of magnitude higher than for most ions (Janz and Bansa, 1982). Also, water molecules are smaller than CO2 molecules and should diffuse faster (Bergmann et al., 2007; Talesh et al., 2010). In this case, no porosity is required, unlike when CO2 is considered.
For materials with minor concentrations of sintering aids, a distinct line of reasoning was introduced, invoking modified electrical characteristics of the grain boundary region, with leveling of acceptor dopant and oxide-ion vacancy concentrations nearby the grain boundary core, (Figure 6B, lower insert). This possibility relies on experimental evidence of changes in acceptor dopant profiles close to the grain boundary core (Zhu et al., 2014). This might be named advanced grain boundary engineering. Own experiments, designed to confine the interaction between oxide and salt exclusively to the grain boundary region of sintered GDC ceramics, found consistent grain boundary conductivity improvements (Grilo et al., 2021b).
Figure 7 shows Arrhenius-type plots in the 200–300°C temperature range, where deconvolution of impedance spectra into bulk and grain boundary arcs is quite accurate, for total (σt), bulk (σb), and grain boundary conductivity (σgb) of pure GDC sintered at 1500°C/4 h, and GDC+NLC ceramics prepared using (M) and (S) processing routes. The corresponding activation energies (Ea) are depicted in the σb and σgb plots.
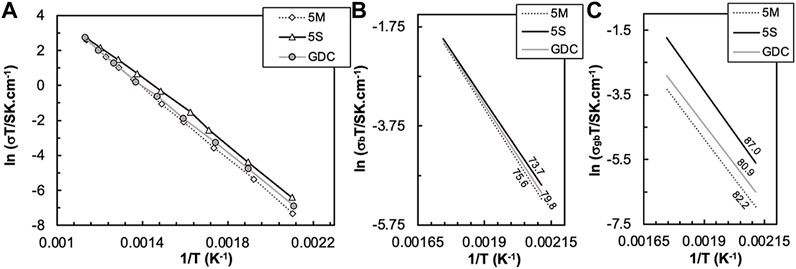
FIGURE 7. Arrhenius-type plots of total (A), bulk (B) and grain boundary conductivity (C) of GDC-based materials sintered without and with NLC (Grilo et al., 2020). In (B,C), lines correspond to data linear trends used to estimate Ea (kJ.mol−1).
The total conductivity of all materials is within a small range of values (Figure 7A). There is no evidence for any impact of molten phases as possible contributors to the total conductivity. Bulk conductivities of all samples showed in Figure 7B are nearly identical, confirming that bulk transport is poorly sensitive to the effect of NLC additions. On the contrary, σgb values are somewhat distinct, with samples prepared using chemical synthesis showing higher conductivity, even higher than observed for standard GDC (Figure 7C).
For materials prepared using chemical synthesis, dense ceramics were obtained at 1100 °C. The presence of NLC changes the local chemical environment. At 1100°C, migration of Gd3+ cations to the grain boundaries is restrained, unlike in pure GDC on cooling from high sintering temperatures. With lower concentration of acceptor cations, the grain boundary potential barrier decreases, and the oxide-ion vacancy concentration profile in the space charge layers are smoother (Lei et al., 2002; Guo and Waser, 2006). A specific mechanism might be considered, where Gd3+ cations combine with Li+ to form GdLiO2, scavenging selectively the concentration of the acceptor dopant. The chemical reaction is known to occur at moderate temperatures (Yamauchi et al., 2008), but there is no report yet on a conclusive observation of GdLiO2 in GDC+NLC grain boundaries.
In the case of materials prepared using mechanical milling, the effect seems the opposite, with σgb values lower than for all other materials. While the chemical synthesis route is expected to originate homogeneous materials at ionic level during wet chemistry steps, in the ceramic route, with low processing temperatures, heterogeneities are more likely. Any residual salt particles, with dimensions below the analytical capability of SEM/EDS, may act as potential oxide-ion blocking phases present in the grain boundary region (Cho et al., 2007, 2008; Lin et al., 2015).
The wide range of effects previously introduced is able to explain reports from enhanced to decreasing grain boundary conductivity. Previous comments also indicate that likely phenomena are local, within the few nm distance with respect to the grain boundary core. Only characterization tools with high spatial and chemical resolution (for light elements) can disclose the exact grain boundary characteristics. Such reports are scarce, and most analyses are based on indirect signs. In any case, experimental evidence opens the possibility of advanced grain boundary engineering solutions to circumvent drawbacks observed in conventional ceramics.
Typical impedance spectra obtained at low temperature for solid electrolytes consist of two arcs, associated to bulk and grain boundary contributions (see examples in Figure 4). The grain boundary may represent a secondary phase distributed along intergranular regions, namely low melting point phases. The reported tendencies of the bulk and intergranular contributions are based on fitting of impedance spectroscopy data using a common equivalent circuit with a series association of resistors to account for the bulk (Rb) and grain boundary (Rgb,s) resistances, each having constant phase elements (CPEb and CPEgb,s) in parallel, as schematized by the bottom branch in Figure 8A. For simplicity, CPEs are replaced by simple capacitors (Cb, Cgb).
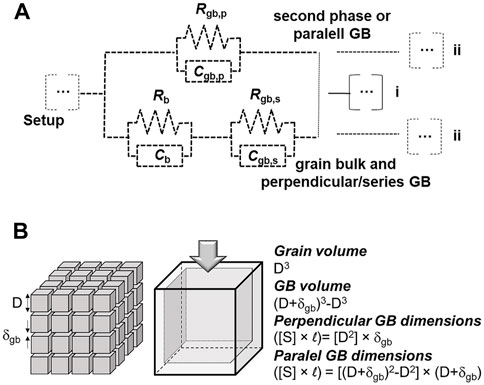
FIGURE 8. (A) Equivalent circuit comprising a (upper) branch for transport along grain boundaries (parallel to the current flow) and another (bottom) branch for transport along grains in series with grain boundaries (perpendicular to the current flow); (B) Brick-layer model scheme of a ceramic with grain size D and grain boundary thickness δgb, highlighting relationships between volume and dimensions.
The so-called brick-layer model describes a material with cross-sectional area A and thickness L, composed of cubic grains with average grain size D, surrounded by grain boundaries of thickness δgb (Figure 8B) (Guo and Waser, 2006; Gomes et al., 2009). Considering only the bottom branch of the equivalent circuit to describe a polycrystalline ceramic with large average grain size, thus neglecting transport along parallel grain boundaries with huge electrical resistance due to obvious geometric reasons, the specific grain boundary conductivity (σsp) depends on the microscopic geometric factor of the grain boundaries δgbD−1. The latter is given by δgbD−1 = CbCgb−1, assuming equivalent dielectric constants for bulk and grain boundaries (εb ≈ εgb). Therefore, δgb can be estimated from:
and σsp from:
All values needed for Eqs 8, 9 are easily obtained from microstructures (D), impedance plots (Cb and Cgb), and macroscopic sample dimensions. Often, authors try to correlate the reduction of the amplitude of the grain boundary arc with enhanced grain boundary conductivity, resulting from changes of the core potential or localized effects of sodium or lithium salts (see e.g. (Zhu et al., 2014)). This is a reasonable approach if the grain boundary thickness is small (typically of few nm), or the amount of second phases corresponds to that of an additive (1–2 vol% maximum), and not typical of composites (well above 10 vol%).
The possibility of a parallel branch to this series association was never considered in the analysis of impedance spectra of this kind of electrolytes. However, in a classical brick-layer model, grain boundaries offer two distinct pathways with respect to electrical transport. In between consecutive grains along the current direction the grain boundary is perpendicular to the ionic flow. In between sides of grains, the grain boundary offers a parallel pathway (Figure 8A). The usually assumed high grain boundary resistivity (with respect to the bulk grain) explains the tendency to discard the second branch of the equivalent circuit.
In the following discussion the full circuit with two parallel branches is considered (Figure 8A). The parallel, upper branch (circuit elements with subscript p) might correspond to a secondary phase or a parallel grain boundary. In the latter case, the electrical properties of the perpendicular and parallel grain boundaries are interlinked (same conductivity and dielectric constant). In the former case they can be manipulated independently.
Other circuit elements besides these are neglected. This includes possible contact/electrical setup impedances and electrode impedances. A remark is needed to emphasize that if the upper branch involves the transport of the same ionic species the electrode impedance should be common to both branches (Figure 8A), case i). However, if a distinct ionic species is involved, a distinct electrode branch should thus be included (Figure 8A), case ii).
Figure 9 shows a set of model impedance spectra where the circuit (s) series and (p) parallel branches are both considered. The order of magnitude of resistances and capacitances is selected to generate spectra with the graphical features commonly observed in published data (clear bulk and grain boundary arcs), but there is no attempt to reproduce exact sets of published data. Arbitrary units are assumed in all examples discussed below.
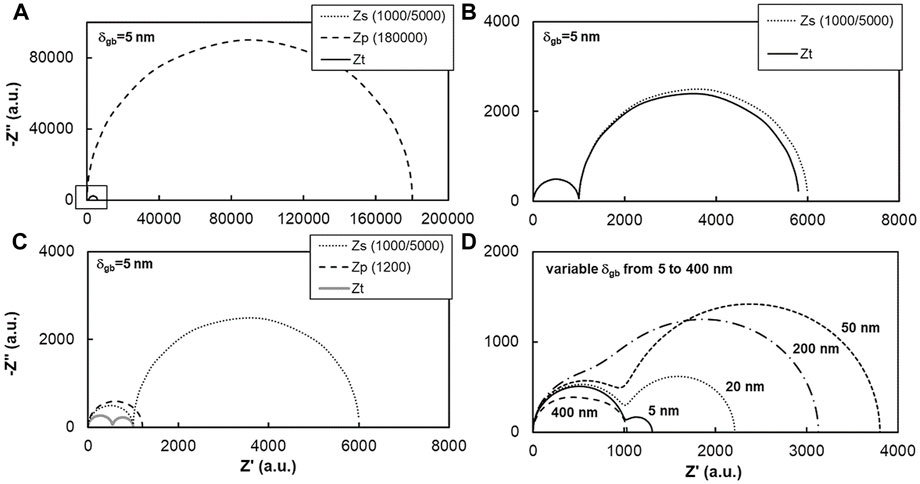
FIGURE 9. Simulated impedance spectra based on the equivalent circuit of Figure 8A, where Zs is the impedance of the series (bottom) circuit, Zp is the impedance of the parallel (upper) branch and Zt is the total impedance of the circuit. The spectra in Figures (A–C) were simulated with Rb, Rgb,s and Rgb,p values given in the legend, and D=1 µm and δgb=5 nm. Spectra in (D) obtained assuming a constraint on the electrical properties that scale with a variable δgb (see text for details).
In Figure 9A the bulk resistance (Rb = 1000, in the bottom series branch) is only one fifth of the perpendicular/series grain boundary resistance (Rgb,s = 5000), and both much smaller than the upper parallel resistance (Rgb,p = 180,000). The much larger impedance of the parallel grain boundary branch (Zp) prevents the observation in this plot of the impedance of the series branch (Zs) and of the total circuit impedance (Zt), both detailed in Figure 9B. The spectra for Zs and Zt are almost identical because of the large Zp. In this case, the upper parallel branch is almost electrically inactive.
Figure 9C shows the result of a much lower Zp (Rp = 1200), while the remaining circuit parameters were preserved. Zt now is completely different from Zs, due to the role of the low parallel resistance. Simple naked eye analysis of these spectra suggests that the (perpendicular) grain boundary impedance is only about 1/10 of the original value while the bulk impedance shrank to about 1/2 of the original value. In fact, they were fully preserved but they appear as if the corresponding conductivities increased. The situation just described fits quite well with previous reports on enormous enhancement of grain boundary conductivity and moderate bulk conductivity improvement. Migration from spectra in Figures 9B,C was obtained with simple consideration of a fast-ionic parallel pathway. This can be easily done assuming distinct phases and properties for the parallel and perpendicular grain boundaries.
Figure 9D repeats the previous exercise but with a constraint on the electrical properties of parallel and perpendicular grain boundaries, by assuming the same specific conductivity (σsp, see Eq. 9) and dielectric constant (εr) for the series and the parallel grain boundaries. The initial values of Rb = 1000, Rgb,s = 300, Cb = 10−9 and Cgb,s = 2 × 10⁻⁷ corresponding to δgb = 5 nm and D = 1 µm, determine the other relevant parameters, which scale with δgb according to
The spectra in Figure 9D show the impact of increasing δgb on the total impedance. Starting from the initial geometry corresponding to δgb = 5 nm, one observes a significant increase of the total impedance up to δgb = 50 nm, which is essentially determined by the increase of Rgb,s (Eq. 12). The other parameter in the series branch, Rb, also increases with increasing δgb (Eq. 11), but much less. Comparison of the two spectra for δgb = 5 nm and δgb = 50 nm visually confirms this trend since the high frequency arc (on the left, for low impedance) remains nearly unchanged, whereas the low frequency contribution is much larger for δgb = 50 nm. Further increase of δgb reverses the trend (the impedance for δgb = 200 nm is already smaller than for δgb = 50 nm), and the two arcs lose some of their distinctive features and start to overlap.
At δgb = 400 nm one observes that the total impedance is already (slightly) smaller than the initial condition (δgb = 5 nm), and the spectrum appears as a single, highly depressed arc. This behavior is explained by the accentuated decrease of the parallel branch resistance Rgb,p, which, as shown by Eq. 10, scales down with δgb to the power of −3, whereas Rgb,s scales up with a simple unity exponent. Therefore, significant changes in the total impedance are only observed for an exorbitant δgb of 400 nm, requiring a large volume fraction of a secondary phase. This condition is typical of a composite but not of a ceramic with a minor secondary phase (partly) in the grain boundary region.
Overall, Figure 9 shows that the usually reported enormous enhancement of the grain boundary conductivity and moderate improvement of the bulk conductivity are not compatible with a simply enhanced grain boundary conductivity, even with due consideration of the so-called parallel pathway. On the contrary, consideration of a secondary phase with high conductivity (Figure 9C) can easily generate the reported changes in the spectra with sintering admixtures. From known properties of solid and molten ionic conductors, the latter are closer to fulfil the high conductivity requirements. From a microstructural point of view, even minor amounts of molten phases can easily percolate throughout contacts between grains, still bonded via common grain boundaries.
The presence of a secondary charge transport pathway and carrier (e.g., alkali metal ions) should show up under direct current (dc) conditions (and long tests), since typical electrodes cannot act as sink and source of alkali metal ions. However, this situation is not necessarily detected under alternate current (ac) analysis, as with impedance spectroscopy. A report on dc experiments (Hebb-Wagner method (Neuhaus et al., 2018b)) suggests peculiar constraints while testing Ca-doped ceria with Na2CO3 as second phase, namely with respect to the (limited) range of allowed applied voltages, with respect to the situation observed with pure Ca-doped ceria. Whether or not this is a confirmation of the presence of multiple species is obviously unclear.
The assumption of exclusive oxide-ion conductivity in ceria-based electrolytes prepared with salts of alkali metals neglects the possible contribution of other species and compounds with significant conductivity, situation aggravated when even minor amounts of molten phases might be present. A small fraction of a fast-ionic conductor can easily explain claimed trends in (moderate) bulk and (enormous) grain boundary conductivity enhancements.
With (ac) impedance spectroscopy all mobile species can contribute to the total conductivity, preventing the identification of separate contributions. Tests performed under dc conditions and complementary techniques able to detect alternative molten/amorphous phases (e.g., FTIR to detect hydroxides) are needed to fully discard alternative explanations for reported conductivity enhancements. Furthermore, confirmation of exact mechanisms behind grain boundary conductivity enhancements, require advanced analytical tools to confirm most hypotheses under discussion. Advanced grain boundary engineering is feasible using admixtures, opening possibilities up to now rarely exploited. This involves manipulation of the local concentration of species at low temperature, preventing the accumulation of dopants, often observed after high temperature processing. This solution is of particular interest in materials like ceria-based electrolytes. Long term stability of these materials under typical operating conditions also needs proper assessment.
JG: writing—original draft, formal analysis; AJ and MS: writing—review; FF: conceptualization, writing—review and editing, supervision; FM: conceptualization, writing—review and editing, funding acquisition, supervision.
This work was developed within the scope of the project CICECO-Aveiro Institute of Materials, UIDB/50011/2020, UIDP/50011/2020 and LA/P/0006/2020, financed by national funds through the FCT/MEC (PIDDAC). Specific support (AJ) provided by national funds (OE), through FCT, IP, in the scope of the framework contract foreseen in the numbers 4, 5, and 6 of the article 23, of the Decree-Law 57/2016, of August 29, changed by Law 57/2017, of July 19. MS acknowledges the support of the FCT–2020.00625.CEECIND grant.
The authors declare that the research was conducted in the absence of any commercial or financial relationships that could be construed as a potential conflict of interest.
All claims expressed in this article are solely those of the authors and do not necessarily represent those of their affiliated organizations, or those of the publisher, the editors and the reviewers. Any product that may be evaluated in this article, or claim that may be made by its manufacturer, is not guaranteed or endorsed by the publisher.
Avila-Paredes, H. J., and Kim, S. (2006). The effect of segregated transition metal ions on the grain boundary resistivity of gadolinium doped ceria: Alteration of the space charge potential. Solid State Ionics 177, 3075–3080. doi:10.1016/j.ssi.2006.08.017
Bale, C. W., Bélisle, E., Chartrand, P., Decterov, S. A., Eriksson, G., Gheribi, A. E., et al. (2016). FactSage thermochemical software and databases, 2010–2016. Calphad 54, 35–53. doi:10.1016/j.calphad.2016.05.002
Bauerle, J. E. (1969). Study of solid electrolyte polarization by a complex admittance method. J. Phys. Chem. Solids 30, 2657–2670. doi:10.1016/0022-3697(69)90039-0
Beekmans, N. M., and Heyne, L. (1976). Correlation between impedance, microstructure and composition of calcia-stabilized zirconia. Electrochim. Acta 21, 303–310. doi:10.1016/0013-4686(76)80024-2
Benamira, M., Albin, V., Ringuedé, A., Vannier, R.-N., Bodén, A., Lagergren, C., et al. (2007). Structural and electrical properties of gadolinia-doped ceria mixed with alkali earth carbonates for SOFC applications. ECS Trans. 7, 2261–2268. doi:10.1149/1.2729343
Bergmann, U., Di Cicco, A., Wernet, P., Principi, E., Glatzel, P., and Nilsson, A. (2007). Nearest-neighbor oxygen distances in liquid water and ice observed by x-ray Raman based extended x-ray absorption fine structure. J. Chem. Phys. 127, 174504. doi:10.1063/1.2784123
Butler, E. P., and Drennan, J. (1982). Microstructural analysis of sintered high-conductivity zirconia with Al2O3 additions. J. Am. Ceram. Soc. 65, 474–478. doi:10.1111/j.1151-2916.1982.tb10336.x
Cela, B., de Macedo, D. A., de Souza, G. L., Martinelli, A. E., do Nascimento, R. M., and Paskocimas, C. A. (2011). NiO–CGO in situ nanocomposite attainment: One step synthesis. J. Power Sources 196, 2539–2544. doi:10.1016/j.jpowsour.2010.11.026
Cerisier, P., and Roux, F. (1978). A study of the electrical conductivity and transition points of potassium carbonate. Solid State Commun. 26, 661–663. doi:10.1016/0038-1098(78)90102-3
Chen, M., Zhang, H., Fan, L., Wang, C., and Zhu, B. (2014). Ceria-carbonate composite for low temperature solid oxide fuel cell: Sintering aid and composite effect. Int. J. Hydrogen Energy 39, 12309–12316. doi:10.1016/j.ijhydene.2014.04.004
Chinarro, E., Jurado, J. R., and Colomer, M. T. (2007). Synthesis of ceria-based electrolyte nanometric powders by urea-combustion technique. J. Eur. Ceram. Soc. 27, 3619–3623. doi:10.1016/j.jeurceramsoc.2007.02.007
Cho, P.-S., Lee, S. B., Cho, Y. H., Kim, D.-Y., Park, H.-M., and Lee, J.-H. (2008). Effect of CaO concentration on enhancement of grain-boundary conduction in gadolinia-doped ceria. J. Power Sources 183, 518–523. doi:10.1016/j.jpowsour.2008.05.041
Cho, Y. H., Cho, P.-S., Auchterlonie, G., Kim, D. K., Lee, J.-H., Kim, D.-Y., et al. (2007). Enhancement of grain-boundary conduction in gadolinia-doped ceria by the scavenging of highly resistive siliceous phase. Acta Mat. 55, 4807–4815. doi:10.1016/j.actamat.2007.05.001
Christie, G. M., and Van Berkel, F. P. F. (1996). Microstructure - ionic conductivity relationships in ceria-gadolinia electrolytes. Solid State Ionics 83, 17–27. doi:10.1016/0167-2738(95)00155-7
Claes, P., and Glibert, J. (1985). Electrical conductivity and specific mass of the molten LiOH-LiNO3, NaOH-NaNO3, and KOH-KNO3 Mixtures. J. Electrochem. Soc. 132, 857–862. doi:10.1149/1.2113973
Cordier, A., El Khal, H., Siebert, E., and Steil, M. C. (2019). On the role of the pore morphology on the electrical conductivity of porous yttria-stabilized zirconia. J. Eur. Ceram. Soc. 39, 2518–2525. doi:10.1016/j.jeurceramsoc.2019.02.027
Ding, D., Liu, B., Zhu, Z., Zhou, S., and Xia, C. (2008). High reactive Ce0.8Sm0.2O1.9 powders via a carbonate co-precipitation method as electrolytes for low-temperature solid oxide fuel cells. Solid State Ionics 179, 896–899. doi:10.1016/j.ssi.2007.11.015
Dissanayake, M. A. K. L., and Mellander, B.-. E. (1986). Phase diagram and electrical conductivity of the Li2SO4 -Li2OC3 system. Solid State Ion. 21, 279–285. doi:10.1016/0167-2738(86)90190-6
Duran, P., Gonzalez, M., Moure, C., Jurado, J. R., and Pascual, C. (1990). A new tentative phase equilibrium diagram for the ZrO2-CeO2 system in air. J. Mat. Sci. 25, 5001–5006. doi:10.1007/bf00580121
Duran, P., Rodriguez, J. M., and Recio, P. (1991). The ZrO2-rich region of the ZrO2-MgO system. J. Mat. Sci. 26, 467–472. doi:10.1007/bf00576544
Duwez, P., Odell, F., and Brown, F. H. (1952). Stabilization of zirconia with calcia and magnesia. J. Am. Ceram. Soc. 35, 107–113. doi:10.1111/j.1151-2916.1952.tb13081.x
El Khal, H., Cordier, A., Batis, N., Siebert, E., Georges, S., and Steil, M. C. (2017). Effect of porosity on the electrical conductivity of LAMOX materials. Solid State Ionics 304, 75–84. doi:10.1016/j.ssi.2017.03.028
Fagg, D. P., Kharton, V. V., and Frade, J. R. (2002). P-type electronic transport in Ce0.8Gd0.2O2−δ : The effect of transition metal oxide sintering aids. J. Electroceram. 9, 199–207. doi:10.1023/a:1023269326651
Ferreira, A. S. V., Soares, M. C., Figueiredo, F. M. H. L. R., and Marques, F. M. B. (2011b). Intrinsic and extrinsic compositional effects in ceria/carbonate composite electrolytes for fuel cells. Int. J. Hydrogen Energy 36, 3704–3711. doi:10.1016/j.ijhydene.2010.12.025
Ferreira, A. S. V., Saradha, T., Figueiredo, F. L., and Marques, F. M. B. (2011a). Compositional and microstructural effects in composite electrolytes for fuel cells. Int. J. Energy Res. 35, 1090–1099. doi:10.1002/er.1843
Figueiredo, F. M. L., and Marques, F. M. B. (2013). Electrolytes for solid oxide fuel cells. WIREs Energy Env. 2, 52–72. doi:10.1002/wene.23
Gao, L., Zhou, M., Zheng, Y., Gu, H., Chen, H., and Guo, L. (2010). Effect of zinc oxide on yttria doped ceria. J. Power Sources 195, 3130–3134. doi:10.1016/j.jpowsour.2009.11.117
Ge, L., Li, S., Zheng, Y., Zhou, M., Chen, H., and Guo, L. (2011). Effect of zinc oxide doping on the grain boundary conductivity of Ce0.8Gd0.2O1.9 ceramics (Ln = Y, Sm, Gd). J. Power Sources 196, 6131–6137. doi:10.1016/j.jpowsour.2011.03.032
Gomes, E., Mather, G. C., Figueiredo, F. M., and Marques, F. M. B. (2009). Microstructure and electrical properties of aluminium-substituted La(Sr)Ga(Mg)O3-δ-based solid electrolytes. Monatsh. Chem. 140, 1041–1052. doi:10.1007/s00706-009-0139-1
Grain, C. F. (1967). Phase relations in the ZrO2-MgO system. J. Am. Ceram. Soc. 50, 288–290. doi:10.1111/j.1151-2916.1967.tb15111.x
Grilo, J. P. F., Macedo, D. A., Nascimento, R. M., and Marques, F. M. B. (2021a). Assessment of processing route on the performance of ceria-based composites. Int. J. Energy Res. 45, 9069–9082. doi:10.1002/er.6438
Grilo, J. P. F., Macedo, D. A., Nascimento, R. M., and Marques, F. M. B. (2019). Electronic conductivity in Gd-doped ceria with salt additions. Electrochim. Acta 318, 977–988. doi:10.1016/j.electacta.2019.06.148
Grilo, J. P. F., Macedo, D. A., Nascimento, R. M., and Marques, F. M. B. (2021b). Innovative improvement of sintered ceramic electrolytes by salt infiltration. Ceram. Int. 47, 5079–5090. doi:10.1016/j.ceramint.2020.10.086
Grilo, J. P. F., Macedo, D. A., Nascimento, R. M., and Marques, F. M. B. (2020). Performance of GDC with alkali metal carbonates as sintering aids. Solid State Ionics 346, 115221. doi:10.1016/j.ssi.2020.115221
Guo, X., Sigle, W., Fleig, J. U., and Maier, J. (2002). Role of space charge in the grain boundary blocking effect in doped zirconia. Solid State Ionics 154 (155), 555–561. doi:10.1016/s0167-2738(02)00491-5
Guo, X., Sigle, W., and Maier, J. (2003). Blocking grain boundaries in yttria-doped and undoped ceria ceramics of high purity. J. Am. Ceram. Soc. 86, 77–87. doi:10.1111/j.1151-2916.2003.tb03281.x
Guo, X., Tang, C. Q., and Yuan, R. Z. (1995). Grain boundary ionic conduction in zirconia-based solid electrolyte with alumina addition. J. Eur. Ceram. Soc. 15, 25–32. doi:10.1016/0955-2219(95)91296-z
Guo, X., and Waser, R. (2006). Electrical properties of the grain boundaries of oxygen ion conductors: Acceptor-doped zirconia and ceria. Prog. Mat. Sci. 51, 151–210. doi:10.1016/j.pmatsci.2005.07.001
Guth, U., Babwisch, F., Wulff, H., Möbius, H.-H., and Mobius, H. H. (1987). Electrical conductivity and crystal structure of pure and SrCO3-doped Na2CO3. Cryst. Res. Technol. 22, 141–145. doi:10.1002/crat.2170220127
Herle, J. Van, Horita, T., Kawada, T., Sakai, N., Yokokawa, H., and Dokiya, M. (1997). Fabrication and sintering of fine yttria-doped ceria powder. J. Am. Ceram. Soc. 80, 933–940. doi:10.1111/j.1151-2916.1997.tb02924.x
Inaba, H., and Tagawa, H. (1996). Ceria-based solid electrolytes. Solid State Ionics 83, 1–16. doi:10.1016/0167-2738(95)00229-4
Janz, G. J., and Bansa, N. P. (1982). Molten salts data: Diffusion coefficients in single and multi-component salt systems. J. Phys. Chem. Ref. Data 11, 505–693. doi:10.1063/1.555665
Janz, G. J., and Tomkins, R. P. T. (1983). Molten salts: Volume 5, Part 2. Additional single and multi component salt systems. Electrical conductance, density, viscosity and surface tension data. J. Phys. Chem. Ref. Data 12, 591–815. doi:10.1063/1.555693
Jiang, S., and Wagner, J. B. (1995). A theoretical model for composite electrolytes—II. Percolation model for ionic conductivity enhancement. J. Phys. Chem. Solids 56, 1113–1124. doi:10.1016/0022-3697(95)00026-7
Jiang, Y., Sun, Y., Bruno, F., and Li, S. (2017). Thermal stability of Na2CO3-Li2CO3 as a high temperature phase change material for thermal energy storage. Thermochim. Acta 650, 88–94. doi:10.1016/j.tca.2017.01.002
Kaplan, V., Wachtel, E., and Lubomirsky, I. (2011). Conditions of stability for (Li2CO3 + Li2O) melts in air. J. Chem. Thermodyn. 43, 1623–1627. doi:10.1016/j.jct.2011.05.020
Kharton, V. V., Marques, F. M. B., and Atkinson, A. (2004). Transport properties of solid oxide electrolyte ceramics : A brief review. Solid State Ion. 174, 135–149. doi:10.1016/j.ssi.2004.06.015
Kharton, V. V., Figueiredo, F. M., Navarro, L., Naumovich, E. N., Kovalevsky, A. V., Yaremchenko, A. A., et al. (2001). Ceria-based materials for solid oxide fuel cells. J. Mat. Sci. 36, 1105–1117. doi:10.1023/a:1004817506146
Kim, J. W., and Lee, H. G. (2001). Thermal and carbothermic decomposition of Na2CO3 and Li2CO3. Metall. Materi. Trans. B 32, 17–24. doi:10.1007/s11663-001-0003-0
Kingery, W. D. (1974a). Plausible concepts necessary and sufficient for interpretation of ceramic grain‐boundary phenomena: I, grain-boundary characteristics, structure, and electrostatic potential. J. Am. Ceram. Soc. 57, 1–8. doi:10.1111/j.1151-2916.1974.tb11350.x
Kingery, W. D. (1974b). Plausible concepts necessary and sufficient for interpretation of ceramic grain‐boundary phenomena: II, solute segregation, grain‐boundary diffusion, and general discussion. J. Am. Ceram. Soc. 57, 74–83. doi:10.1111/j.1151-2916.1974.tb10818.x
Kleinlogel, C. M., and Gauckler, L. J. (2000). Mixed electronic-ionic conductivity of cobalt doped cerium gadolinium oxide. J. Electroceram. 5, 231–243. doi:10.1023/a:1026583629995
Kleitz, M., and Steil, M. C. (1997). Microstructure blocking effects versus effective medium theories in YSZ. J. Eur. Ceram. Soc. 17, 819–829. doi:10.1016/s0955-2219(97)89966-9
Kudo, H. (1979). The rates of thermal decomposition of LiOH(s), LiOD(s) and LiOT(s). J. Nucl. Mater. 87, 185–188. doi:10.1016/0022-3115(79)90137-5
Lapa, C. M., Figueiredo, F. M. L., de Souza, D. P. F., Song, L., Zhu, B., and Marques, F. M. B. (2010). Synthesis and characterization of composite electrolytes based on samaria-doped ceria and Na/Li carbonates. Int. J. Hydrogen Energy 35, 2953–2957. doi:10.1016/j.ijhydene.2009.05.036
Le, S., Zhu, S., Zhu, X., and Sun, K. (2013). Densification of Sm0.2Ce0.8O1.9 with the addition of lithium oxide as sintering aid. J. Power Sources 222, 367–372. doi:10.1016/j.jpowsour.2012.08.020
Lee, S., Kim, M., Hwang, M., Kim, K., Jeon, C., and Song, J. (2013). Thermal stability and viscosity behaviors of hot molten carbonate mixtures. Exp. Therm. Fluid Sci. 49, 94–104. doi:10.1016/j.expthermflusci.2013.04.006
Lei, Y., Ito, Y., Browning, N. D., and Mazanec, T. J. (2002). Segregation effects at grain boundaries in fluorite-structured ceramics. J. Am. Ceram. Soc. 85, 2359–2363. doi:10.1111/j.1151-2916.2002.tb00460.x
Li, S., Wang, X., and Zhu, B. (2007). Novel ceramic fuel cell using non-ceria-based composites as electrolyte. Electrochem. Commun. 9, 2863–2866. doi:10.1016/j.elecom.2007.10.010
Li, S., Xian, C., Yang, K., Sun, C., Wang, Z., and Chen, L. (2012). Feasibility and mechanism of lithium oxide as sintering aid for Ce0.8Sm0.2Oδ electrolyte. J. Power Sources 205, 57–62. doi:10.1016/j.jpowsour.2012.01.010
Li, Y., Rui, Z., Xia, C., Anderson, M., and Lin, Y. S. (2009). Performance of ionic-conducting ceramic/carbonate composite material as solid oxide fuel cell electrolyte and CO2 permeation membrane. Catal. Today 148, 303–309. doi:10.1016/j.cattod.2009.08.009
Lin, Y., Fang, S., Su, D., Brinkman, K. S., and Chen, F. (2015). Enhancing grain boundary ionic conductivity in mixed ionic-electronic conductors. Nat. Commun. 6, 6824–6829. doi:10.1038/ncomms7824
Maheshwari, A., and Wiemhöfer, H. (2016). Augmentation of grain boundary conductivity in Ca2+ doped ceria-carbonate-composite. Acta Mat. 103, 361–369. doi:10.1016/j.actamat.2015.10.024
Maier, J. (1986). On the conductivity of polycrystalline materials. Berichte Bunsenges. fur Phys. Chem. 90, 26–33. doi:10.1002/bbpc.19860900105
Marrero-López, D., Dos Santos-Gómez, L., León-Reina, L., Canales-Vázquez, J., and Losilla, E. R. (2014). Influence of the microstructure on the bulk and grain boundary conductivity in apatite-type electrolytes. J. Power Sources 245, 107–118. doi:10.1016/j.jpowsour.2013.06.111
Mizusaki, J., Tagawa, H., Saito, K., Uchida, K., and Tezuka, M. (1992). Lithium carbonate as a solid electrolyte. Solid State Ionics 53 (56), 791–797. doi:10.1016/0167-2738(92)90256-o
Mogensen, M., Sammes, N. M., and Tompsett, G. A. (2000). Physical, chemical and electrochemical properties of pure and doped ceria. Solid State Ionics 129, 63–94. doi:10.1016/s0167-2738(99)00318-5
Moure, A., Tartaj, J., and Moure, C. (2009). Synthesis and low-temperature sintering of Gd-doped CeO2 ceramic materials obtained by a coprecipitation process. J. Am. Ceram. Soc. 92, 2197–2203. doi:10.1111/j.1551-2916.2009.03215.x
Nakamura, Y., Harashima, K., Hukuda, Y., Tokumitsu, N., and Yamamoto, S. (1980). Decomposition of sodium carbonate and its mixture with silica by heating and carbon-reduction. Tetsu-to-Hagane 66, 2023–2031. doi:10.2355/tetsutohagane1955.66.14_2023
Neuhaus, K., Baumann, S., Dolle, R., and Wiemhöfer, H.-D. (2018a). Effect of MnO2 concentration on the conductivity of Ce0.9Gd0.1MnxO2−δ. Crystals 8, 40. doi:10.3390/cryst8010040
Neuhaus, K., Dolle, R., and Wiemhöfer, H.-D. (2018b). Assessment of the effect of transition metal oxide addition on the conductivity of commercial Gd-doped ceria. J. Electrochem. Soc. 165, F533–F542. doi:10.1149/2.1111807jes
Nicholas, J. D., and De Jonghe, L. C. (2007). Prediction and evaluation of sintering aids for cerium gadolinium oxide. Solid State Ionics 178, 1187–1194. doi:10.1016/j.ssi.2007.05.019
Olivares, R. I. (2012). The thermal stability of molten nitrite/nitrates salt for solar thermal energy storage in different atmospheres. Sol. Energy 86, 2576–2583. doi:10.1016/j.solener.2012.05.025
Ortman, M. S., and Larsen, E. M. (1983). Preparation, characterization, and melting point of high-purity lithium oxide. J. Am. Ceram. Soc. 66, 645–648. doi:10.1111/j.1151-2916.1983.tb10614.x
Patrício, S. G., Papaioannou, E., Zhang, G., Metcalfe, I. S., and Marques, F. M. B. (2014). High performance composite CO2 separation membranes. J. Memb. Sci. 471, 211–218.
Pearce, M. C., and Thangadurai, V. (2009). Electrical transport properties of aliovalent cation-doped CeO2. Asia. Pac. J. Chem. Eng. 4, 33–44. doi:10.1002/apj.185
Pérez-Coll, D., Marrero-López, D., Núñez, P., Piñol, S., and Frade, J. R. (2006). Grain boundary conductivity of Ce0.9Ln0.1O2−δ ceramics (Ln = Y, La, Gd, Sm) with and without Co-doping. Electrochim. Acta 51, 6463–6469.
Pérez-Coll, D., Sánchez-López, E., and Mather, G. C. (2010). Influence of porosity on the bulk and grain-boundary electrical properties of Gd-doped ceria. Solid State Ionics 181, 1033–1042. doi:10.1016/j.ssi.2010.06.006
Pikalova, E. Y., Demina, A. N., Demin, A. k., Murashkina, A. A., Sopernikov, V. E., and Esina, N. O. (2007). Effect of doping with Co2O3, TiO2, Fe2O3 , and M2O3 on the properties of Ce0.8Gd0.2O2−δ. Inorg. Mat. 43, 830–837.
Roberts, J. N., and Schwartz, L. M. (1985). Grain consolidation and electrical conductivity in porous media. Phys. Rev. B 31, 5990–5997. doi:10.1103/physrevb.31.5990
Rondão, A. I. B., Patrício, S. G., Figueiredo, F. M. L., and Marques, F. M. B. (2013). Impact of ceramic matrix functionality on composite electrolytes performance. Electrochim. Acta 109, 701–709. doi:10.1016/j.electacta.2013.07.229
Ruiz, M. L., Lick, I. D., Ponzi, M. I., Castellón, E. R., Jiménez-López, A., and Ponzi, E. N. (2010). Thermal decomposition of supported lithium nitrate catalysts. Thermochim. Acta 499, 21–26. doi:10.1016/j.tca.2009.10.016
Santos, T. H., Grilo, J. P. F., Loureiro, F. J. A., Fagg, D. P., Fonseca, F. C., and Macedo, D. A. (2018). Structure, densification and electrical properties of Gd3+ and Cu2+ co-doped ceria solid electrolytes for SOFC applications: Effects of Gd2O3 content. Ceram. Int. 44, 2745–2751. doi:10.1016/j.ceramint.2017.11.009
Shannon, R. D. (1976). Revised effective ionic radii and systematic studies of interatomic distances in halides and chalcogenides. Acta Cryst. Sect. A A32, 751–767. doi:10.1107/s0567739476001551
Singh, N. B., and Singh, N. P. (2007). Formation of CaO from thermal decomposition of calcium carbonate in the presence of carboxylic acids. J. Therm. Anal. Calorim. 89, 159–162. doi:10.1007/s10973-006-7565-7
Skinner, S. J., and Kilner, J. A. (2003). Oxygen ion conductors. Mat. TodayKidlingt. 6, 30–37. doi:10.1016/s1369-7021(03)00332-8
Skobelev, I., Uvarov, N., and Hairetdinov, E. (1996). Composite solid electrolytes MeNO3-Al2O3 (me = Li, Na, K). Solid State Ionics 88, 577–580. doi:10.1016/0167-2738(96)00208-1
Stern, K. H., and Weise, E. L. (1969). High temperature properties and decomposition of inorganic salts. Natl. Bur. Stand., 1–27.
Stubican, V. S. (1986). Phase equilibria and metastabilities in the systems ZrO2-MgO, ZrO2-CaO and ZrO2-Y2O3. Adv. Ceram. 24, 71–82.
Sudarsan, P., and Krishnamoorthy, S. B. (2018). Grain boundary scavenging through reactive sintering of strontium and iron in samarium doped ceria electrolyte for ITSOFC applications. Mat. Res. Bull. 100, 446–457. doi:10.1016/j.materresbull.2017.12.047
Sweeney, M. (1975). Thermal stabilities of isoelectronic, isostructural nitrates, carbonates and borates. Thermochim. Acta 11, 409–424. doi:10.1016/0040-6031(75)80007-4
Talesh, A., Siamak, S., and Jalal, S. (2010). Comparative study of carbon dioxide and methane adsorption by synthesized fine particles of SAPO-34 molecular sieve. J. Chem. Chem. Eng. 29.
Taub, S., Neuhaus, K., Wiemhöfer, H.-D., Ni, N., Kilner, J. A., and Atkinson, A. (2015). The effects of Co and Cr on the electrical conductivity of cerium gadolinium oxide. Solid State Ionics 282, 54–62. doi:10.1016/j.ssi.2015.09.024
Teoh, L. G., and Chiang, G. W. (2012). Preparation and characterization of nanocrystalline Ca-doped CeO2 by sol–gel process. J. Sol-Gel Sci. Technol. 64, 530–533. doi:10.1007/s10971-012-2885-5
Van Dijk, T., and Burggraaf, A. J. (1981). Grain boundary effects on ionic conductivity in ceramic GdxZr(1-x)O2-(x/2) solid solutions. Phys. Stat. Sol. 63, 229–240. doi:10.1002/pssa.2210630131
Villas-boas, L. A., Figueiredo, F. M. L., Souza, D. P. F. De, and Marques, F. M. B. (2014). Zn as sintering aid for ceria-based electrolytes. Solid State Ionics 262, 522–525. doi:10.1016/j.ssi.2013.11.002
Weber, G., Sciora, E., Guichard, J., Bouyer, F., Bezverkhyy, I., Marcos Salazar, J., et al. (2018). Investigation of hydrolysis of lithium oxide by thermogravimetry, calorimetry and in situ FTIR spectroscopy. J. Therm. Anal. Calorim. 132, 1055–1064. doi:10.1007/s10973-017-6943-7
Xing, W., Peters, T., Fontaine, M. L., Evans, A., Henriksen, P. P., Norby, T., et al. (2015). Steam-promoted CO2 flux in dual-phase CO2 separation membranes. J. Memb. Sci. 482, 115–119. doi:10.1016/j.memsci.2015.02.029
Xu, D., Liu, X., Xu, S., Yan, D., Pei, L., Zhu, C., et al. (2011). Fabrication and performance of Ce0.85Gd0.15O1.925 -Fe2O3 electrolytes in IT-SOFCs. Solid State Ionics 192, 510–514. doi:10.1016/j.ssi.2010.03.026
Yamashita, K., Ramanujachary, K. V., and Greenblatt, M. (1995). Hydrothermal synthesis and low temperature conduction properties of substituted ceria ceramics. Solid State Ionics 81, 53–60. doi:10.1016/0167-2738(95)99031-h
Yamauchi, M., Itagaki, Y., Aono, H., and Sadaoka, Y. (2008). Reactivity and stability of rare Earth oxide-Li2CO3 mixtures. J. Eur. Ceram. Soc. 28, 27–34. doi:10.1016/j.jeurceramsoc.2007.06.013
Yurkinskii, V. P., Firsova, E. G., and Proskura, S. A. (2005). Thermal dissociation of sodium hydroxide upon evacuation. Russ. J. Appl. Chem. 78, 360–362. doi:10.1007/s11167-005-0296-x
Zha, S., Xia, C., and Meng, G. (2003). Effect of Gd (Sm) doping on properties of ceria electrolyte for solid oxide fuel cells. J. Power Sources 115, 44–48. doi:10.1016/s0378-7753(02)00625-0
Zhang, T. S., Ma, J., Kong, L. B., Chan, S. H., Hing, P., and Kilner, J. A. (2004). Iron oxide as an effective sintering aid and a grain boundary scavenger for ceria-based electrolytes. Solid State Ionics 167, 203–207. doi:10.1016/j.ssi.2004.01.006
Keywords: ceria, alkali metal salt, solid electrolyte, bulk conductivity, grain boundary conductivity, impedance spectroscopy, microstructure
Citation: Grilo JP, Jamale A, Starykevich M, Figueiredo FM and Marques FM (2022) Role of salts on the electrical performance of ceria-based electrolytes: An overview. Front. Mater. 9:993583. doi: 10.3389/fmats.2022.993583
Received: 13 July 2022; Accepted: 01 September 2022;
Published: 28 September 2022.
Edited by:
Verónica de Zea Bermudez, University of Trás-os-Montes and Alto Douro, PortugalReviewed by:
Rodrigo Moreno, Spanish National Research Council (CSIC), SpainCopyright © 2022 Grilo, Jamale, Starykevich, Figueiredo and Marques. This is an open-access article distributed under the terms of the Creative Commons Attribution License (CC BY). The use, distribution or reproduction in other forums is permitted, provided the original author(s) and the copyright owner(s) are credited and that the original publication in this journal is cited, in accordance with accepted academic practice. No use, distribution or reproduction is permitted which does not comply with these terms.
*Correspondence: Filipe ML Figueiredo, bGVicmVAdWEucHQ=; Fernando MB Marques, Zm1hcnF1ZXNAdWEucHQ=
Disclaimer: All claims expressed in this article are solely those of the authors and do not necessarily represent those of their affiliated organizations, or those of the publisher, the editors and the reviewers. Any product that may be evaluated in this article or claim that may be made by its manufacturer is not guaranteed or endorsed by the publisher.
Research integrity at Frontiers
Learn more about the work of our research integrity team to safeguard the quality of each article we publish.