 Qian Liu
 Jiaxuan Jiang2
 Ming Chen
 Xiaohu Deng
- 1School of Materials and Metallurgy, University of Science and Technology Liaoning, Anshan, China
- 2School of Mechanical Engineering and Automation, University of Science and Technology Liaoning, Anshan, China
- 3National Local Joint Engineering Laboratory of Intelligent Manufacturing Oriented Automobile Die & Mold, Tianjin University of Technology and Education, Tianjin, China
- 4College of Material Science and Engineering, Hebei University of Science and Technology, Shijiazhuang, China
- 5Saitama Institute of Technology, Fukaya, Japan
In this paper, the thermodynamics database describing Gibbs free energy of FCC phase and M23C6 phase based on Fe-Cr-C ternary alloy was coupled into phase field simulation, and the phase field model was developed on the mesoscopic scale which simulates precipitation, growth and coarsening of M23C6 carbides in FCC austenitic matrix by considering the elastic energy. As the boundary condition of imported phase field calculation, the heat treatment COSMAP software was applied to obtain the macro numerical simulation results of quenching. The phase composition, element distribution, and the evolution including the nucleation, growth and coarsening was simulated by phase field method for the M23C6 carbides in quenching process of GCr15 bearing ring. By means of comparison between the calculation results of phase field simulation and the morphology, quantity and distribution of carbides observed by SEM experiment, this paper present the mechanism on precipitation of micro M23C6 carbides influenced by quenching process parameters, and the experiment verifies the feasibility and accuracy of phase field simulation.
1 Introduction
Bearings have already been indispensable core components in many areas, such as aerospace, high-speed rail, and the automotive industry. In practical application, a bearing has been designed to withstand cyclical loads and resist external shocks. The purpose has provided an important guarantee for the high rotational accuracy and high wear resistance of many rotary machines at high speeds (Zhao-kun et al., 2016; Zou, 2021). In the manufactured process of bearing, metallurgy, and preparation of the material, the processing technology of materials and heat treatment technology have been the main factors affecting bearing performance. The bearing ring is the main part. The quenching process of the bearing ring has been very important in determining the final strength, wear resistance, rotation accuracy, and rotation noise performance because it is close to the last process of manufacturing the bearing ring.
High-carbon–chromium bearing steel has good fatigue resistance, elasticity, and toughness. After quenching, it could have high and uniform hardness (Laing et al., 1967). The distribution and composition of carbides have an important influence on the properties of bearing steel. Research on it has been difficult at present, providing a basis for improving the bearing ring dimensional stability and optimizing the heat treatment process (Zong et al., 2020). GCr15 is high-carbon–chromium earing steel. M23C6 are the main carbides in GCr15. Their phase composition, element distribution, and evolution, including nucleation, growth, and coarsening, have an important influence on the dimensional stability of the bearing outer ring (Du, 2017). And
The phase-field method is a powerful mesoscale calculation method based on density. Based on the concept of MGI, the phase-field method simulates organizational evolution, realizes the prediction of material properties, and accelerates the material development process (Li, 2009; Ding, 2019). Xin et al. provided compelling morphological, chemical, structural, and thermodynamic evidence for the spinodal decomposition and showed that the lattice mismatch at the diffuse transition region between the spinodal zones and matrix is the dominating factor for enhancing yield strength in this class of alloy (Xin et al., 2021). Zhao et al. studied the multi-controlling factors of the dendritic growth in directional solidification through the phase-field method. The effects of the temperature gradient, propelling velocity, thermal disturbance, and growth orientation angle on the growth morphology of the dendritic growth at the solid/liquid interface were discussed (Zhao et al., 2019). Zhang et al. (2018) developed a model of rapid solidification of non-stoichiometric intermetallic compounds based on the thermodynamic extremal principle, and the Co-xat. %Si alloys (x ¼ 50, 53, 55) were undercooled to test the model. Kuang et al. (2018) considered the thermodynamic extremal principle and proposed a modified quasi-sharp-interface model that integrates trans-interface diffusion from the product phase to the interface, trans-interface diffusion from the interface to the parent phase, and interface migration and bulk diffusion of C and X. Applications to isothermal and cyclic phase transformations showed that the model allows the arbitrary setting of the initial conditions. Zhao et al. used a multi-component continuous phase-field model based on the Gibbs free energy of the sub-regular solution. The core-shell structure precipitates of Fe-xCu-3.0Mn-1.5Ni-1.5Al alloys under internal and external strain were investigated (Zhao et al., 2022a). Tian et al. (2022) used the phase-field-crystal method and dynamically displayed the interaction between twins and dislocations. In this study, the phase-field method was used to study the effect of the precipitation mechanism of M23C6 carbides during bearing ring quenching. First, COSMAP was used to simulate the GCr15 bearing ring quenched to obtain elastic field data. The heat treatment simulation results were introduced into the phase-field model to obtain the nucleation, growth, and coarsening process of M23C6 carbides precipitated from the FCC matrix phase under the influence of coupling elastic energy and describe the morphology and distribution of M23C6 carbides in the FCC matrix phase. Finally, the morphology and distribution of M23C6 carbides in the quenched GCr15 bearing ring were tested by SEM, and the phase-field simulation and experimental results were compared.
2 Multi-field coupling quenching process simulation
The research sample is the bearing ring, and the material is GCr15. The workflow is as follows: first, it completes model preprocessing by GID and then analyzes the material properties. These are preparations for the next numerical simulation. The main focus of the quenching process is the deformation problem for the bearing ring. The temperature field variation and deformation behavior could be analyzed. The simulation process by COSMAP is shown in Figure 1.
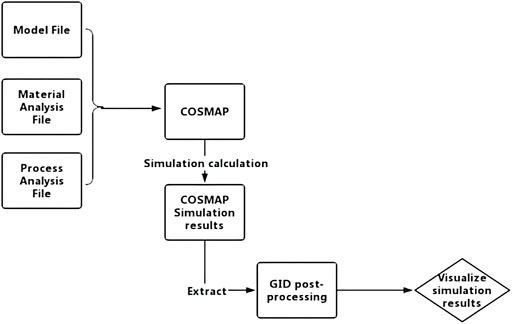
FIGURE 1. Flowchart of COSMAP simulation.
2.1 Geometric model
The specimen’s critical dimensions are a diameter of 125 mm, a wall thickness of 7.5 mm, and a width of 11 mm. It belongs to the thin-walled part.
2.2 Building a finite element model
As shown in Figure 2, analytical model had been created 16,611 nodes and 13,328 cells. On the section of the bearing model, there are three points, called P1, P2, P3, and P1 node represent endpoint of the outer ring, P2 node represent endpoint of the middle surface and P3 node represent endpoint of the inner surface. These three nodes move along the arc and vertical direction and divided the model into hexahedral elements of similar size for the calculation units of finite element analysis. The purpose is to determine the temperature f variation and deformation at different positions and accurately describe the deformation behavior of the quenched bearing ring.
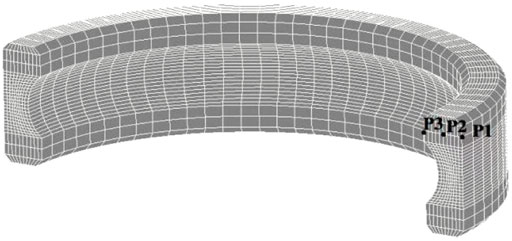
FIGURE 2. Diagram of the analysis area based on the model meshed.
2.3 Quenching process
The experimental heat treatment process is heating for 15 min to 845°C, then holding for 25 min, and finally quenching in oil. According to experience, the heat transfer law of the ring has been set, and the adopted values are shown in Figure 3. The heat transfer coefficient curve could accurately reflect the temperature cooling in oil quenching, compared with the oil cooling curve (Liu et al., 2022) Table 1 shows the chemical composition of GCr15 used in the analysis.
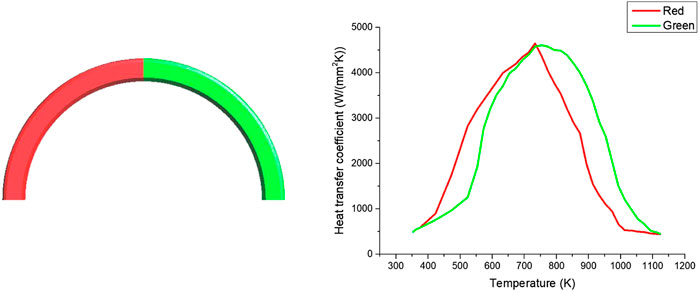
FIGURE 3. Surface heat transfer coefficient law of GCr15 steel quenched in oil.

TABLE 1. Chemical composition of GCr15 steel.
2.4 Simulation results and analysis
Temperature variation and deformation law are listed in this study. From Figure 4, the results of temperature cooling in various regions of the ring quenched could be analyzed. Temperature cooling varies for the interior and surface of the bearing ring entity. Because the surface has direct contact with the oil, its cooling rate is faster. The heat transfer between the surface and the interior is heat conduction; there is a certain time difference, so the internal cooling rate is slow. There is no obvious temperature difference between the inner and outer surfaces for the thin-walled part. Temperature difference at different locations is likely to affect carbide formation, distribution, and coarsening. It could be verified in the subsequent phase-field simulation and test.
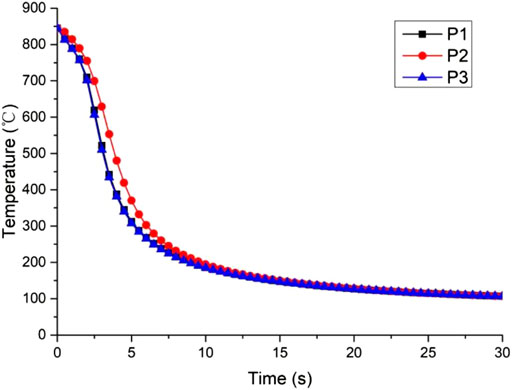
FIGURE 4. Cooling curves of different nodes during quenching of the GCr15 bearing ring.
Studying the deformation mechanism of the quenched bearing outer ring is always difficult. Although the ovality of the outer ring can be adjusted by subsequent processing, the dimensional stability is an unresolved fundamental problem for long-term applications, which affects the performance of bearings. Therefore, how to better control the deformation of the heat treatment process is still a topic of research in the industry.
The variation trend of deformation can be obtained from Figure 5. When the cooling rate is the fastest, the deformation is reduced to the lowest. After about 6 s, a parabolic trend appears, which is affected by the latent heat of phase change. In the convective heat transfer stage, the deformation tends to be stable.
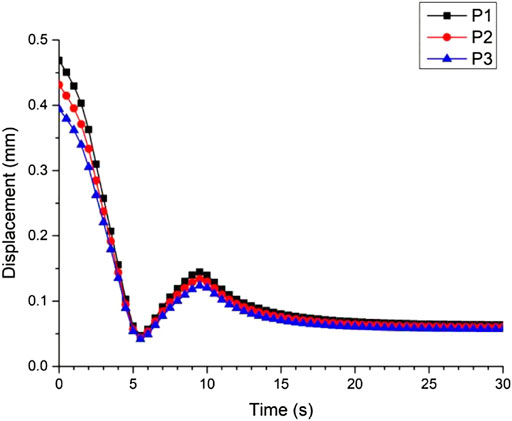
FIGURE 5. Curve of deformation in quenching.
3 Phase-field simulation
The precipitation process of carbides from phases in GCr15 bearing steel was simulated by the phase-field method. The influence of elastic energy on the
4 Flowchart for introducing elastic energy in phase-field simulation
Figure 6 shows the analysis process of elastic strain energy introduction.
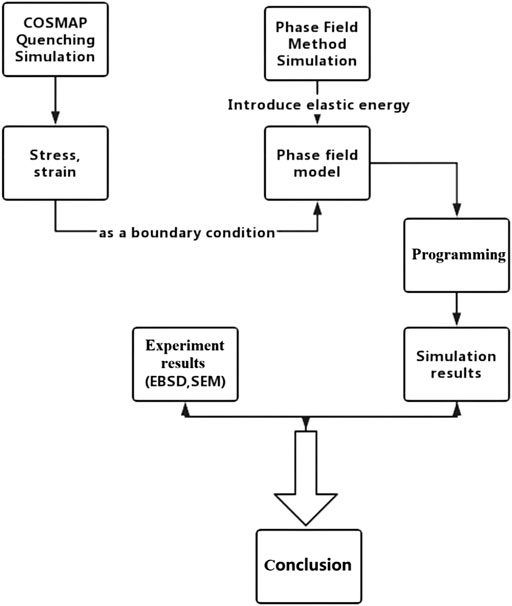
FIGURE 6. Flowchart for the introduction of elastic energy.
4.1 Establishment of the phase-field model
Because there are many kinds of elements in GCr15 bearing steel and our phase-field simulation program only supports the ternary alloy system, three main elements (Fe, Cr, and C) in GCr15 steel are selected. Independent component field variables
where
where
where
where parameter
where the parameter
Available kinetic parameters have been referred to in Table 2.
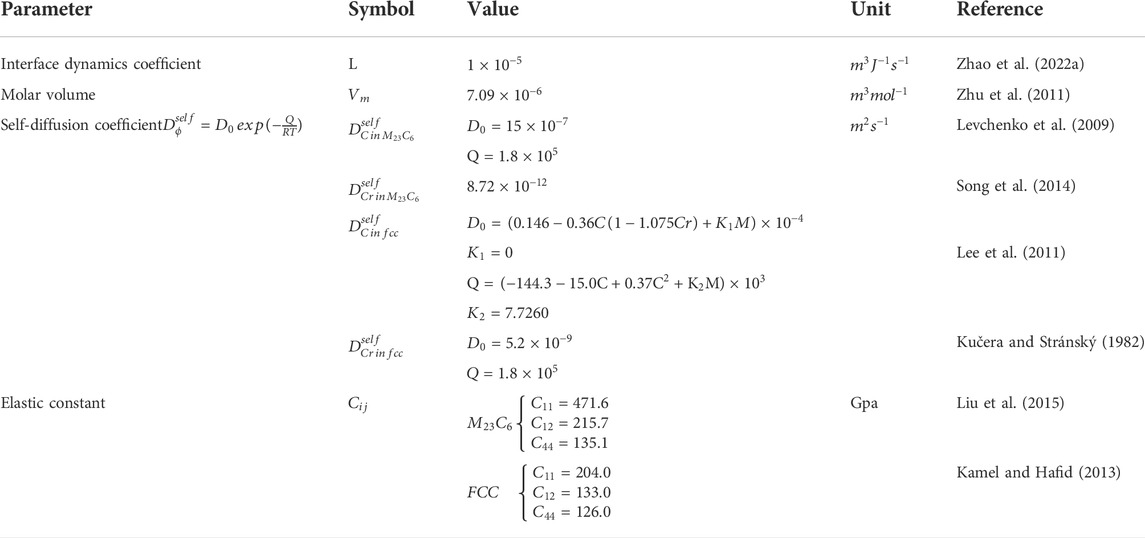
TABLE 2. Calculation results of kinetic parameters.
4.2 Local chemical free energy
The Wheeler et al. (1992) (WBM) model has been applied to the analysis. Local chemical free energy can be considered by combining two single-phase free energies:
The relationship between them can be derived from Eq. 10 (Loginova et al., 2003):
Based on the CALPHAD method (Saunders and Miodownik, 1992), the molar Gibbs free energy of the FCC matrix phase can be described through two sub-lattice models (Fe, Cr) and (C, Va). Metal elements have been mixed in the first sublattice and carbon and vacancy in the interstitial sub-lattice (Andersson, 1988; Khvan et al., 2014):
where
Molar free energy of the
In Eq. 15,
All thermodynamic parameters in the molar Gibbs free energy of the
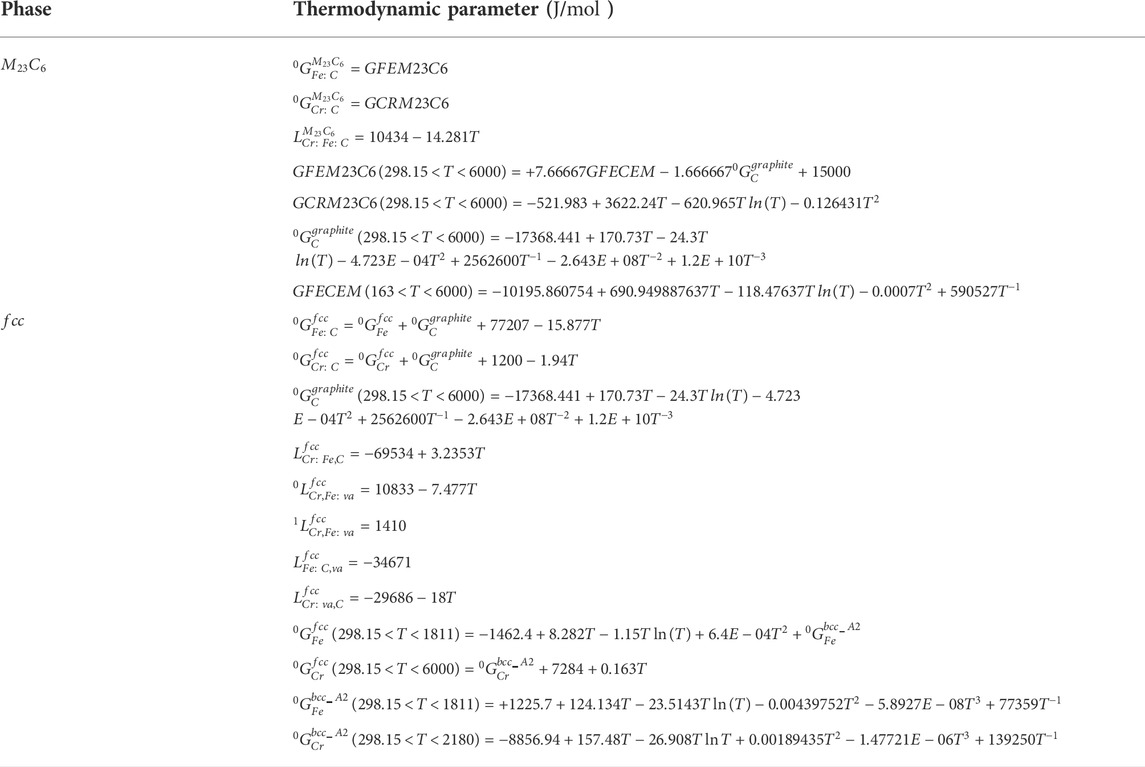
TABLE 3. Calculation parameters of thermodynamic parameters with the
The distribution of the molar free energy of the
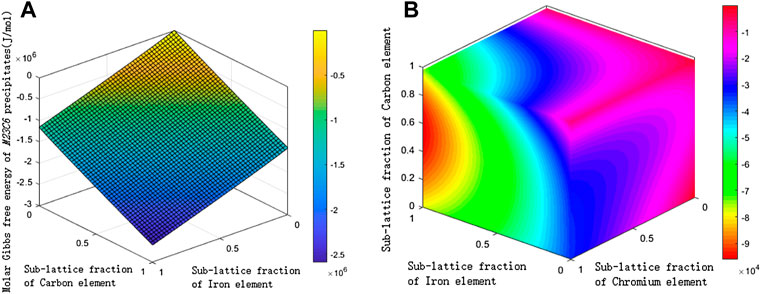
FIGURE 7. Distribution of free energy at 1,073 K. (A)
4.3 Gradient energy (physics)
The uneven interface composition and difference in structural order parameters should be the main reason for the existence of gradient energy. There is a certain relationship between gradient energy and system interface energy. System interface energy could reflect gradient energy, and details can be explained using Eq. 16.
where
4.4 Elastic strain energy
The elastic strain energy plays an important role in the morphology, size, and orientation of precipitates and the precipitation kinetic process during the solid-state transformation of alloys. Differences in elastic constants between the new and parent phases, the lattice mismatch between elements or phases, and external stress or strain field should actuate the generation of elastic strain energy and form a stress–strain effect (Sun., 2020; Wu, 2021). For these reasons, strain energy should be added to the total free energy equation to develop the phase-field model, which would study the effect of elastic energy on the solid-state phase transformation process of alloys. Elastic energy in the phase-field model is analyzed using Eq. 17.
In Eq 17,
The value of the eigenstrain, which should be calculated through Eq. 19, has been affected by the concentration field:
The total strain
where
Assuming there is a linear elastic relation between the
The elastic modulus of the matrix phase is different from that of the precipitated phase. The elastic modulus tensor
In Eq. 24,
In Eq. 25,
4.5 Phase-field solution
In order to obtain the instantaneous state for the phase-field simulation of the microstructure, the dynamic equations in the phase-field model are solved. As the expression of free energy belongs to the nonlinear equation, the phase-field evolution is mostly to solve the complex nonlinear partial differential equation. At present, there are three methods for solving such complex partial differential equations: the Fourier spectrum method, the finite element method, and the finite difference method (Chen and Jie, 1998). These equations usually have no analytical solution, so an efficient solution has been used to improve the computational efficiency. The Fourier spectral algorithm could transform nonlinear partial differential equations into ordinary differential equations. The Fourier spectral algorithm has eliminated spatial dependence of field variables and realized the Fourier transform rapidly, so computational efficiency achieved improvement. By referring to the factor, the semi-implicit Fourier spectral algorithm has been applied to solving equations in the phase-field model.
Eqs. 27, 28 are obtained by deducing Eqs. 1, 2:
In Eqs. 27, 28,
Eqs. 27, 28 are treated by the semi-implicit method, including implicit processing of linear and second-order items and display processing of other items. Eqs. 29, 30 result from this derivation:
where
Finally, the simulation results are saved in the VTK format, and the results are visualized to obtain the dynamic simulation of the phase transition process.
4.6 Simulation of the phase-field evolution of carbide growth
Red represents the precipitated carbide phase, and the matrix phase is represented by blue in Figure 8. Noise nucleation has been used in the simulation. When the dimensionless time equals 14, there are only a few
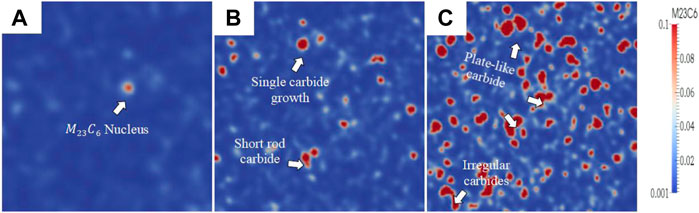
FIGURE 8. Evolution of carbide over time based on 1,123 K. (A)
4.7 Concentration field evolution
Figure 9 shows the change in the concentration field with time. The initial temperature equals 1,123 K, corresponding to the precipitation process of the
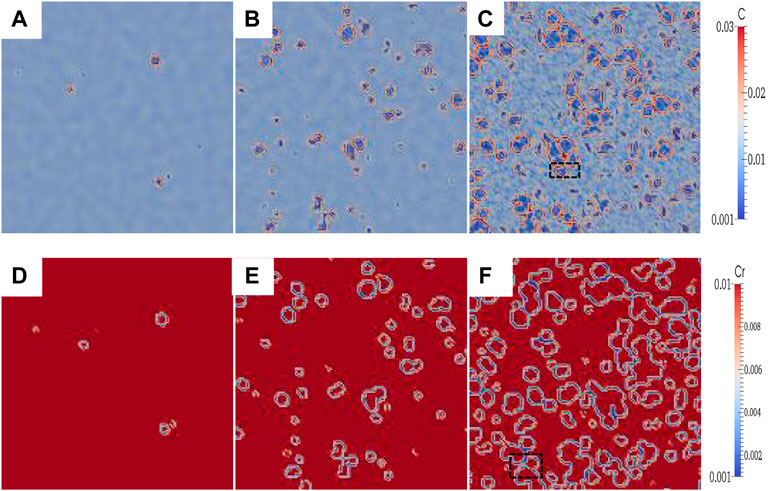
FIGURE 9. Evolution of the concentration field with time based on 1,123 K. (A–C) C concentration field; (D–F) Cr concentration field. Dimensionless time: (a, d) t* = 14; (b, e) t* = 15; (c, f) t* = 16.
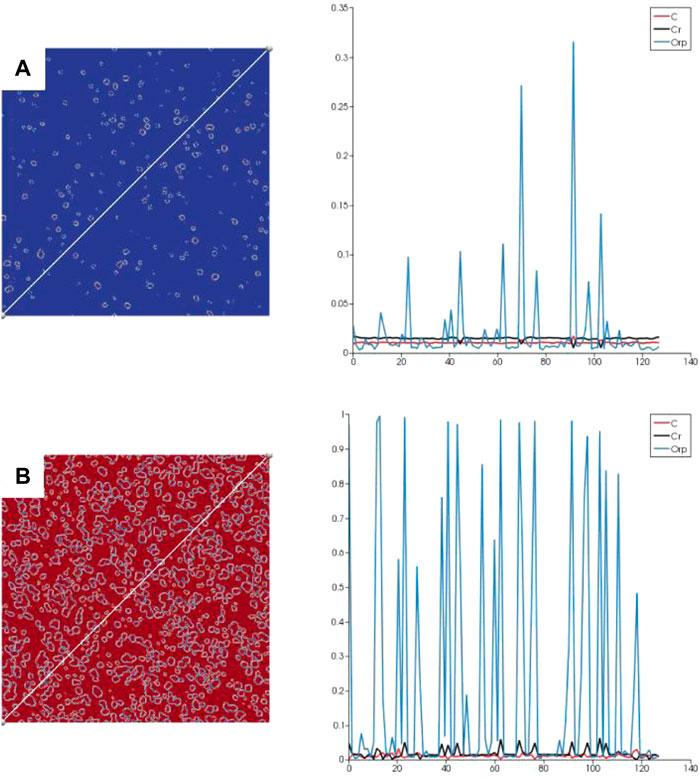
FIGURE 10. Concentration versus time curve along the concentration field diagonal. (A) Carbon concentration field. (B) Cr concentration field.
5 Experimental and simulation comparison
5.1 SEM experimental study on
Figure 11A1 shows that many round carbides exist in the matrix for the neutral surface of the quenched part. By local amplification, it could be observed that, in addition to several round carbides, there are some single coarse and short rod carbides. As a result, the
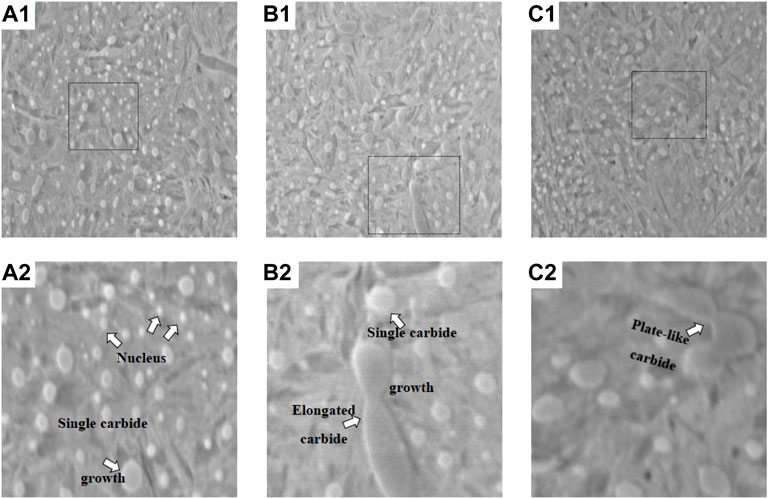
FIGURE 11. Microstructure of the GCr15 bearing outer ring quenched at different positions. (A1) Neutral surface of the quenched part. (B1) Outer surface of the quenched part. (C1) Inner surface of the quenched part. (A2) Local amplification of the neutral surface. (B2) Local amplification of the outer surface. (C2) Local amplification of the inner surface.
As shown in Figures 11B1,C1, in addition to the existence of round and short rod-like carbides, a small amount of elongated rod-like and a few irregular
Figure 12A1 represents the phase-field simulation results of the
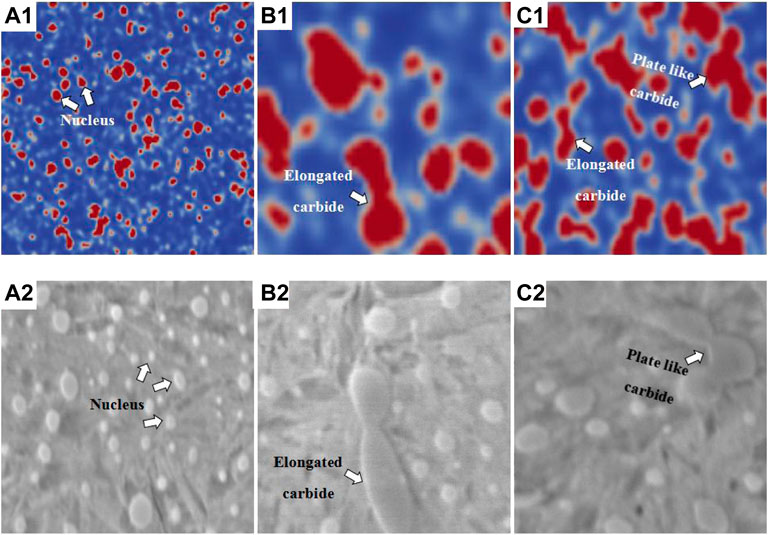
FIGURE 12. Comparison of phase-field simulation results with SEM experimental results.
6 Conclusion
By compared the simulation results with the SEM results, we can judge the formation mechanism of carbide; for mono-nuclear carbide itself, carbide would grow. When two or more carbide core phases contact each other, necking could occur. This argument has been verified in comparison with SEM results. When the two carbide phases contact each other, the total free energy of the system decreases, the contact surface shrinks inward, and the specific surface area decreases, causing necking. With the continuous aging time, a series of irregular carbides could be formed.
The cooling rate in quenching could affect
It indicates that the experimental results agree with the phase-field simulation results, proving the feasibility of the phase-field simulation method used. Meanwhile, the difference between the parameters selected in the phase-field simulation and the true value may lead to errors in the analysis results. Further optimization of the phase-field model is the direction of future efforts.
Data availability statement
The original contributions presented in the study are included in the article/Supplementary Material; further inquiries can be directed to the corresponding author.
Author contributions
Conceptualization: MC and DJ. Methodology: QL and JJ. Software: MC and DJ. Validation: QL and JJ. Formal Analysis: JJ and QL. Experiment: QL. Investigation: MC and DJ. Resources: MC and DJ. Data curation: XD and JW. Supervision: MC and DJ. Writing—original draft preparation: JJ and QL. Writing—review and editing: QL and JJ. Project administration: DJ. All authors read and agreed to the published version of the manuscript.
Funding
This research was funded by the National Key Research and Development Project (2018YFE0207000).
Acknowledgments
The authors thank ChangZhou NRB Corporation in China and the High-Tech Research Center at the Saitama Institute of Technology in Japan for the related experiments.
Conflict of interest
The authors declare that the research was conducted in the absence of any commercial or financial relationships that could be construed as a potential conflict of interest.
Publisher’s note
All claims expressed in this article are solely those of the authors and do not necessarily represent those of their affiliated organizations, or those of the publisher, the editors, and the reviewers. Any product that may be evaluated in this article, or claim that may be made by its manufacturer, is not guaranteed or endorsed by the publisher.
References
Andersson, J. O . (1988). A thermodynamic evaluation of the Fe-Cr-C system. J. 19 (3), 627–636. doi:10.1007/bf02649276
Andersson, J. O . (1987). Thermodynamic properties of Cr-C. Calphad 11, 271–276. doi:10.1016/0364-5916(87)90045-9
Cahn, J. W., and Hilliard, J. E. (1958). Free energy of a nonuniform system. I. Interfacial free energy. J. Chem. Phys. 28 (2), 258–267. doi:10.1063/1.1744102
Chen, L. Q., and Jie, S. (1998). Applications of semi-implicit Fourier-spectral method to phase field equations. Comput. Phys. Commun. 108 (2-3), 147–158. doi:10.1016/s0010-4655(97)00115-x
Ding, W (2019). Study on the evolution of residual stress during continuous cooling and annealing process of high strength steel [D]. China, Beijing: University of Science and Technology Beijing.
Du, G (2017). Study on the control of carbides in bearing steel GCr15 based on electroslag remelting process [D]. China, Beijing: University of Science and Technology Beijing.
Guo, Z (2021). Study on precipitation mechanism of Ni一rich phase in Cu-Ni-Si-Mg alloy by phase field method [D]. Taiyuan, China: North University of China.
Gururajan, M. P., and Abinandanan, T. A. (2007). Phase field study of precipitate rafting under a uniaxial stress. Acta Mater. 55 (15), 5015–5026. doi:10.1016/j.actamat.2007.05.021
Hu, S. Y., Murray, J., Weiland, H., Liu, Z., and Chen, L. (2007). Thermodynamic description and growth kinetics of stoichiometric precipitates in the phase-field approach. Calphad 31 (2), 303–312. doi:10.1016/j.calphad.2006.08.005
Jiang, X.-A., Zhao, Y.-H., Wen-Kui, Y., Xiao-Lin, T., and Hou, H. (2022). Mechanism of internal magnetic energy of Cu-rich phase precipitation in Fe84Cu15Mn1 alloy by phase field method [J]. Acta Phys. Sinca 71 (8), 080201. doi:10.7498/aps.71.20212087
Jokisaari, A. M ., and Thornton, K . (2015). General method for incorporating CALPHAD free energies of mixing into phase field models : Application to the α -zirconium/δ-hydride system. Calphad 51, 334–343. doi:10.1016/j.calphad.2015.10.011
Kamel, B., and Hafid, A. (2013). Elastic constants of austenitic stainless steel: Investigation by the first-principles calculations and the artificial neural network approach. Comput. Mater. Sci. 67 (1-2), 353–358. doi:10.1016/j.commatsci.2012.09.005
Khvan, A. V., Hallstedt, B., and Broeckmann, C. (2014). A thermodynamic evaluation of the Fe–Cr–C system. Calphad 46, 24–33. Pergamon Press. doi:10.1016/j.calphad.2014.01.002
Kitashima, T., Yokokawa, T., Yeh, A. C., and Harada, H. (2008). Analysis of element-content effects on equilibrium segregation at γ/γ′ interface in Ni-base superalloys using the cluster variation method. Intermetallics 16 (6), 779–784. doi:10.1016/j.intermet.2008.02.015
Koyama, T., Hashimoto, K., and Onodera, H. (2006). Phase-field simulation of phase transformation in Fe-Cu-Mn-Ni quaternary alloy. Mat. Trans. 47 (11), 2765–2772. doi:10.2320/matertrans.47.2765
Koyama, T., and Onodera, H. (2005). Computer simulation of phase decomposition in Fe–Cu–Mn–Ni quaternary alloy based on the phase-field method. Mat. Trans. 46 (6), 1187–1192. doi:10.2320/matertrans.46.1187
Kuang, W., Wang, H., Xin, L., Zhang, J., Zhou, Q., and Zhao, Y. (2018). Application of the thermodynamic extremal principle to diffusion-controlled phase transformations in Fe-C-X alloys: Modeling and applications. Acta Mater. 159, 16–30. doi:10.1016/j.actamat.2018.08.008
Kučera, J., and Stránský, K. (1982). Diffusion in iron, iron solid solutions and steels. Mater. Sci. Eng. 52 (1), 1–38. doi:10.1016/0025-5416(82)90067-2
Laing, P G., Ferguson, A B., and Hodge, Ph.D. E S. (1967). Tissue reaction in rabbit muscle exposed to metallic implants. J. Biomed. Mat. Res. 1 (1), 135–149. doi:10.1002/jbm.820010113
Lee, S. J., Matlock, D. K., and Tyne, C. J. V. (2011). An empirical model for carbon diffusion in austenite incorporating alloying element effects. ISIJ Int. 51 (11), 1903–1911. doi:10.2355/isijinternational.51.1903
Levchenko, E. V., Evteev, A. V., Belova, I. V., and Murch, G. (2009). Molecular dynamics simulation and theoretical analysis of carbon diffusion in cementite. Acta Mater. 57 (3), 846–853. doi:10.1016/j.actamat.2008.10.025
Li, F (2009). Phase-field method research on microstructure of multicomponent alloys solidification [D]. Lanzhou, China: Lanzhou University of Technology.
Liu, Q., Ju, D., Li, X., Ishikawa, K., Lv, R., Lian, W., et al. (2022). Verification of the non-axisymmetric deformation mechanism of bearing rings after quenched in a multi-field coupled simulation. Coatings (Basel). 12 (5), 676. doi:10.3390/coatings12050676
Liu, Y., Jiang, Y., Xing, J., Zhou, R., and Jing, F. (2015). Mechanical properties and electronic structures of M23C6 (M = Fe, Cr, Mn)-type multicomponent carbides. J. Alloys Compd. 648, 874–880. doi:10.1016/j.jallcom.2015.07.048
Loginova, I., Odqvist, J., Amberg, G., and Agren, J. (2003). The phase-field approach and solute drag modeling of the transition to massive γ → α transformation in binary Fe-C alloys. Acta Mater. 51 (5), 1327–1339. doi:10.1016/s1359-6454(02)00527-x
Saunders, N., and Miodownik, A. P. (1992). Calphad (calculation of phase diagrams) A comprehensive guide[J]. pergamon: Elsevier.
Song, W, Choi, P-P, Inden, G, Prahl, U, Raabe, D, and Bleck, W (2014). On the spheroidized carbide dissolution and elemental partitioning in high carbon bearing steel 100Cr6. Metall. Mat. Trans. A 45, 595–606. doi:10.1007/s11661-013-2048-5
Sun., Y. (2020). Effects of elastic field and microelements on the precipitation of Cu-rich phase in Fe-Cu-Mn-Ni-A1 quinary alloy: A phase-field study [D]. Taiyuan, China: North University of China.
Tian, X., Zhao, Y., Gu, T., Guo, Y., Xu, F., and Hou, H. (2022). Cooperative effect of strength and ductility processed by thermomechanical treatment for Cu–Al–Ni alloy. Mater. Sci. Eng. A 849, 143485. doi:10.1016/j.msea.2022.143485
Wheeler, A. A., Boettinger, W. J., and Mcfadden, G. B. (1992). Phase-field model for isothermal phase transitions in binary alloys. Phys. Rev. A . Coll. Park. 45 (10), 7424–7439. doi:10.1103/physreva.45.7424
Wieczerzak, K., Bala, P., Dziurka, R., Tokarski, T., Cios, G., Koziel, T., et al. (2016). The effect of temperature on the evolution of eutectic carbides and M 7 C 3 → M 23 C 6 carbides reaction in the rapidly solidified Fe-Cr-C alloy. J. Alloys Compd. 698, 673–684. doi:10.1016/j.jallcom.2016.12.252
Wu, M. (2021). Hot deformation behavior, microstructure and property of super duplex stainless steel S32750 [D]. Taiyuan, China: Taiyuan University of Technology.
Xin, T., Zhao, Y., Mahjoub, R., Jiang, J., Yadav, A., Nomoto, K., et al. (2021). Ultrahigh specific strength in a magnesium alloy strengthened by spinodal decomposition. Sci. Adv. 7 (23), eabf3039. doi:10.1126/sciadv.abf3039
Zhang, J. B., Wang, H. F., Kuang, W. W., Zhang, Y. H., Li, S., Zhao, Y. H., et al. (2018). Rapid solidification of non-stoichiometric intermetallic compounds: Modeling and experimental verification. Acta Mater. 148, 86–99. doi:10.1016/j.actamat.2018.01.040
Zhao, Y., Liu, K., Hou, H., and Chen, L-Q. (2022). Role of interfacial energy anisotropy in dendrite orientation in Al-Zn alloys: A phase field study. Mater. Des. 216, 110555. doi:10.1016/j.matdes.2022.110555
Zhao, Y. (2022). Stability of phase boundary between L12-Ni3Al phases: A phase field study. Intermetallics 144, 107528. doi:10.1016/j.intermet.2022.107528
Zhao, Y., Sun, Y., and Hou, H. (2022). Core-shell structure nanoprecipitates in Fe-xCu-3.0Mn-1.5Ni-1.5Al alloys: A phase field study. Prog. Nat. Sci. Mater. Int. 32 (3), 358–368. doi:10.1016/j.pnsc.2022.04.001
Zhao, Y., Zhang, B., Hou, H., Chen, W., and Wang, M. (2019). Phase-field simulation for the evolution of solid/liquid interface front in directional solidification process. J. Mater. Sci. Technol. 35 (6), 1044–1052. doi:10.1016/j.jmst.2018.12.009
Zhao-kun, L., Jian-zhong, L., Xu, H., Yu, F., Dong, H., and Wen-quan, C. (2016). Current status and development trend of bearing steel in China and abroad [J]. J. Iron Steel Res. 28 (3), 1–12. doi:10.13228/j.boyuan.issn1001-0963.20150345
Zhu, J. Z., Wang, T., Ardell, A. J., Zhou, S., Liu, Z., and Chen, L. (2004). Three-dimensional phase-field simulations of coarsening kinetics of γ′ particles in binary Ni–Al alloys. Acta Mater. 52 (9), 2837–2845. doi:10.1016/j.actamat.2004.02.032
Zhu, N. Q., He, Y. L., Liu, W. Q., L, L., Huang, S. G., Vleugels, J., et al. (2011). Modeling of nucleation and growth of M23C6 carbide in multi-component Fe-based alloy. J. Mater. Sci. Technol. 27 (8), 725–728. doi:10.1016/s1005-0302(11)60133-3
Zong, N., Huang, J., Liu, J., Lu, Z., and Jing, T. (2020). Present situation and prospect of Key metallurgical technologies for improving quality of bearing steel [J]. Bearing (12), 60–66. doi:10.19533/j.issn1000-3762.2020.12.013
Keywords: phase-field method, carbide, GCr15 bearing steel, elastic properties, quenching, phase change
Citation: Liu Q, Jiang J, Chen M, Deng X, Wang J and Ju D (2022) Study on the mechanism of carbide precipitation by surface quenching treatment on GCr15 bearing rings based on the phase-field method. Front. Mater. 9:978025. doi: 10.3389/fmats.2022.978025
Received: 25 June 2022; Accepted: 05 October 2022;
Published: 11 November 2022.
Edited by:
Yu-Hong Zhao, North University of China, ChinaReviewed by:
Qing Wang, Dalian University of Technology, ChinaZhiqin Wen, Guilin University of Technology, China
Copyright © 2022 Liu, Jiang, Chen, Deng, Wang and Ju. This is an open-access article distributed under the terms of the Creative Commons Attribution License (CC BY). The use, distribution or reproduction in other forums is permitted, provided the original author(s) and the copyright owner(s) are credited and that the original publication in this journal is cited, in accordance with accepted academic practice. No use, distribution or reproduction is permitted which does not comply with these terms.
*Correspondence: Ming Chen, Y2hlbm1pbmdAdXN0bC5lZHUuY24=