 Shuai Jiang
 Yiping Shen
 Songlai Wang1
94% of researchers rate our articles as excellent or good
Learn more about the work of our research integrity team to safeguard the quality of each article we publish.
Find out more
ORIGINAL RESEARCH article
Front. Mater., 02 September 2022
Sec. Smart Materials
Volume 9 - 2022 | https://doi.org/10.3389/fmats.2022.958775
This article is part of the Research TopicInnovators in Smart MaterialsView all 4 articles
Ultrasonic guided wave (UGW) technology based on piezoelectric sensors is considered a very promising technology for aircraft structural damage detection. Traditional piezoelectric sensors are made of lead zirconate titanate (PZT) ceramics, but their brittleness and hardness make them difficult to apply to curved structure surfaces. In this study, a novel 0–3 flexible piezoelectric composite was fabricated by dispersing PZT particles in silicone resin, and its performance for potential applications in UGW sensors was studied. The effects of polarization conditions, PZT volume fraction, and PZT powder size on the performance of the composite were investigated. The influence of ambient temperature on composite performance was discussed, and temperature adaptability experiments were conducted. The results show that the optimal poling process of 0–3 PZT/silicone resin piezoelectric composite has a poling time of 25 min, a poling electric field of 4 kV/mm, and a poling temperature of 100°C. When the sensor is required to meet the test strain range of 8,000 με, the composite should be fabricated with a PZT volume fraction of 50% and a powder size of 170∼212 μm to obtain optimal sensing sensitivity. At an ambient temperature range of -55–75°C, the fabricated piezoelectric composite sensor has good flexibility and sensitivity in detecting the guide wave signals. These research results provide a new flexible piezoelectric sensing technology for aircraft structural damage detection.
Large-area complex curved plate structures, such as the fuselage and the wings of an aircraft, can easily experience micro-damage during service. If the micro-damage is not detected promptly, it accumulates and expands, leading to rapid structural damage, and possibly, even sudden disastrous accidents (Royon et al., 2021; Wang et al., 2021). Ultrasonic guided waves (UGW) can travel long distances even in materials with low attenuation and are highly sensitive to slight damage along a propagation path, making them suitable for large area structural damage detection (Jiang et al., 2021). Ultrasonic guided wave technology based on piezoelectric sensors is considered a very promising technology for aircraft structural damage detection (Ricci et al., 2022). Traditional UGW sensors are made of lead zirconate titanate (Pb(Zr0.52Ti0.48)O3; abbreviated PZT) ceramics, but their large density, brittleness, and small limit strain make them difficult to apply to curved structure surfaces (Zhang, 2016; Rocha et al., 2021).
In recent years, researchers have developed many new types of flexible piezoelectric materials, such as polyvinylidene fluoride (PVDF) (Kang and Cao, 2014; Jin et al., 2018), 1–3 or 2–2 piezoelectric fiber composites, and 0–3 piezoelectric composites (Pramanik and Arockiarajan, 2019; Jia et al., 2021). PVDF piezoelectric film has advantages of small thickness and high flexibility, but its piezoelectric performance fluctuates greatly at ambient temperatures. Piezoelectric fiber composites are fine diameter piezoelectric fibers evenly arranged in a polymer, such as macro fiber composites (MFC) (Di Rito et al., 2020) and active fiber composites (AFC) (Stepinski et al., 2017). However, their fabrication is complex and their production cost is high, resulting in their limited application. The 0–3 piezoelectric composite is a material of piezoelectric particles randomly dispersed in a polymer matrix. It has broad potential applications in structural health monitoring sensors because of its low production cost, high flexibility, and effective piezoelectric properties (Yang, 2017; Arul and Rao, 2020).
The low production cost and high flexibility of 0–3 piezoelectric composites make them easy to be applied to aircraft wings (Han and Kang, 2020). Many researchers have verified the feasibility of fabricating flexible piezoelectric sensors with 0–3 PZT/polymer piezoelectric composites (Sofi et al., 2022). Yang and Fritzen (2012) reviewed the research on 0–3 PZT/polymer composites over the last century, prepared a PZT/epoxy resin composite using a casting method, and explored its application in vibration mode tests. Kang and Lee (2014) prepared a PNN–PZT/epoxy resin composite and verified its application potential as a vibration sensor. Kang and Kang (2017) sprayed a suspension of PNN–PZT powder and epoxy resin composite on curved wind turbine blades using it as an acoustic emission sensor to monitor bird collision signals. Sappati and Bhadra (2020) prepared a 0–3 PZT/PDMS piezoelectric composite, studied the effects of PZT concentration on material piezoelectric properties and elastic modulus, and verified its application in pressure sensors. Han and Kang (2018) studied the effects of poling conditions and piezoelectric materials on the piezoelectric properties of a PNN–PZT/epoxy piezoelectric composite. It was used as an impact guide wave sensor to be applied in large aircraft fuselage wings.
The working conditions of an aircraft structure are very complex during service, including large strain structural vibrations, hail or bird impact, and fluctuating ambient temperatures (Giurgiutiu, 2015). Sensors used for aircraft structural health monitoring must be sensitive, flexible, impact-resistant, and have service condition adaptability. For example, the failure strain cannot be less than 8,000 με (Scarponi, 2015), and the service temperature range must be at least -55–75°C (Salamone et al., 2009). Silicone resin is a semi-inorganic polymer featuring good flexibility, strong cohesion, and a low curing shrinkage rate. It also has high-temperature and high-frequency dielectric properties and temperature stability (Wang et al., 2010), making it an ideal material for a 0–3 piezoelectric composite matrix.
In this study, we prepared a novel 0–3 PZT/silicone resin piezoelectric composite. System characterization and measurement methods were proposed for flexible piezoelectric composites used for UGW sensors according to piezoelectric sensor response sensitivity and application performance-influencing factors. The effects of poling conditions, PZT volume fraction, and PZT powder size on its characterization were investigated. Sensitivity test experiments determined the fabrication process for materials with optimal sensing sensitivity. The influence of ambient temperatures on the response amplitude of guide wave sensing was explained through dynamic thermomechanometry analysis. This research provides sensor fabrication parameters for the large test range required by aircraft structural health monitoring applications under complex ambient temperature conditions.
PZT-5A has high piezoelectric sensitivity, wide frequency response bandwidth and excellent stability to time and temperature, which means that it is more suitable for sensor materials and can be used in various environments (Eltouby et al., 2021). Therefore, PZT-5A powder was selected to prepare the piezoelectric composite in this study. PZT-5A, provided by Yantai Xingtao Electronic Technology Co., Ltd (Yantai, China), has a density of 7.75 g/cm3. The matrix material is 192 silicone resin produced by Ausbond (China) Co., Ltd. (Shenzhen, China), with a silicone resin density of 1.40 g/cm3 after curing, a relative dielectric constant of 3.3, Young’s modulus of 2.5 GPa, and a Shore hardness of 60 HA.
PZT powders serve as a functional phase of the PZT/silicone resin piezoelectric composite, so its volume fraction and powder size are important parameters determining composite material properties. This study focuses on the influence of micron PZT powder on the piezoelectric composite properties. PZT blocks were treated by crushing, ball grinding, and screening to fabricate powders of seven different sizes: 1∼15 μm, 45∼80 μm, 90∼113 μm, 113∼170 μm, 170∼212 μm, 212∼315 μm, and 315∼400 μm, as shown in Figure 1.

FIGURE 1. Preparation process of PZT piezoelectric ceramic powder.
The preparation procedure of 0–3 PZT/silicone resin piezoelectric composites is shown in Figure 2. First, silicone resin and curing agent were mixed in a 1:1 ratio and stirred in a vacuum. Then the PZT powder was added with specified volume fractions to the composite, continuing to be stirred in a vacuum to remove bubbles and form a paste mixture. The mixture was injected into a mold and cured for 12 h at 10 MPa and 80°C. The final PZT/silicone resin piezoelectric composite was obtained after standing for 12 h.
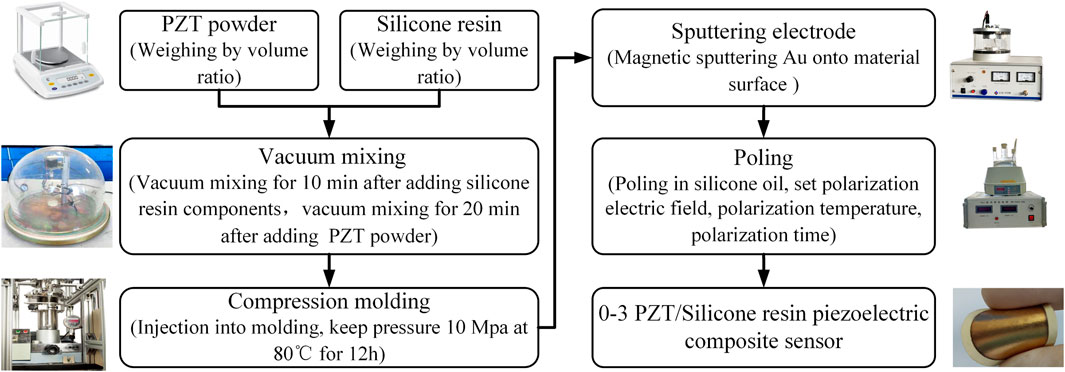
FIGURE 2. Preparation process of the PZT/silicone resin piezoelectric composite.
The ET500 magnetic sputter was used to fabricate the upper and the lower surface electrodes by spraying gold film. The composite material is polarized along its thickness direction in a constant temperature silicon oil bath to activate its piezoelectric properties. The fabricated PZT/silicone resin piezoelectric composite sensor is shown in Figure 3A and we can see that it has good flexibility. Scanning electron microscopy (SEM) was used to analyze the microstructural morphology of the composite, as shown in Figure 3B. It can be seen that PZT particles are evenly distributed in the continuous silicone resin, and the connection of the two phases belongs to the simplest composite type, the “0–3″ connectivity.
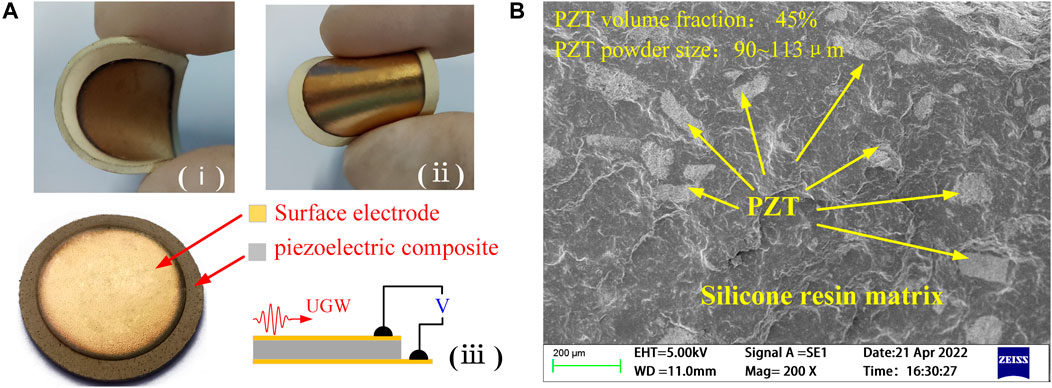
FIGURE 3. 0–3 PZT/silicone resin piezoelectric composites and sensors. (A) Material image. (B) SEM photograph of the material.
The 0–3 PZT/silicone resin piezoelectric composite sensor was bonded to the surface of the workpiece with epoxy resin to ensure guide wave transmission between the workpiece and the sensor. Generally, the bonding layer is a thin layer with mechanical properties very similar to piezoelectric composites, and a robust and seamless adhesion between the sensor and the workpiece is assumed. Therefore, the influence of the bonding material and strain transfer coefficient on the sensor performance is ignored in this study.
The model of the response of the flexible piezoelectric composite to guide wave sensing in the rectangular coordinate and the polar coordinate systems is shown in Figure 4. According to the piezoelectric constitutive equation, the charge generated on the surface of the piezoelectric composite sensor can be written as (Zhang, 2016)
where
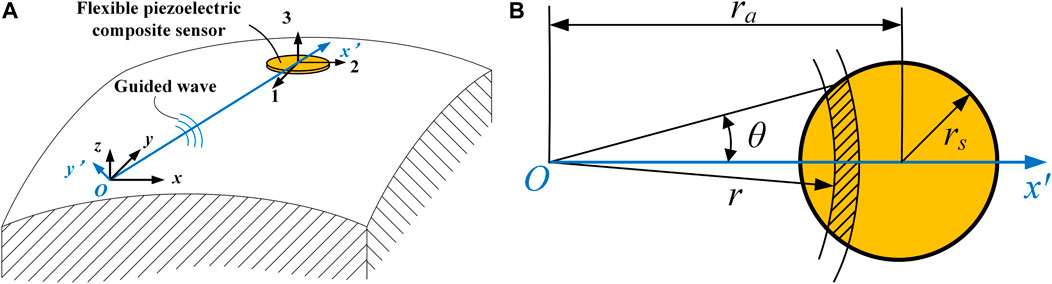
FIGURE 4. Response of the piezoelectric composite to the guided wave. (A) Rectangular coordinate system. (B) Polar coordinate system.
By considering the piezoelectric composite sensors as a capacitor, the capacitance can be written as
where
According to Eqs 1, 2, the sensing voltage response of the piezoelectric composite sensor to the guide wave is expressed as
The sensing voltage response of the piezoelectric composite can be obtained by substituting the structural surface strain expression into Eq. 3, which can be rewritten in the polar coordinate system (see Figure 4B) as
According to the distance
The piezoelectric constant
It is found that the sensing response of the piezoelectric composite is directly related to the elastic modulus, piezoelectric constant, and dielectric constant. The elastic modulus is the most important composite material property to be applied on the curved structure surface. The piezoelectric constant is the quantification of the piezoelectric properties of the composite, and the dielectric constant is the physical quantity of the poling degree of the piezoelectric composite in an external electric field. They determine how the material can be used in applications. Sensor failure strain, hardness, and an effective working temperature range are also important factors in applying the piezoelectric composite sensor to the aircraft structure. Failure strain characterizes the maximum strain test range of the piezoelectric composite, while hardness characterizes its resistance to external impact. Temperature adaptability represents the adaptability of the piezoelectric composite to the working condition temperature range. In this study, the piezoelectric constant, dielectric constant, elastic modulus, failure strain, hardness, and material temperature adaptability were investigated to explore the potential for applying the piezoelectric composite as a UGW sensor.
The piezoelectric strain constant
where
The elastic modulus and failure strain were measured by tensile tests of the PZT/silicone resin composite. Generally, the lower the elastic modulus and the greater the failure strain, the better will be the flexibility of the composite material. The tests were conducted according to ISO 37:2005. The experimental equipment used is the WDW-10 universal test machine, and the specimen size is dumbbell type 3, as shown in Figure 5. A total of five specimens were measured in each set of experiments at a stretching rate of 2 mm/min. The elastic modulus and failure strain were calculated based on the load force and elongation of the specimen. The material hardness was obtained by a Shore hardness-tester.
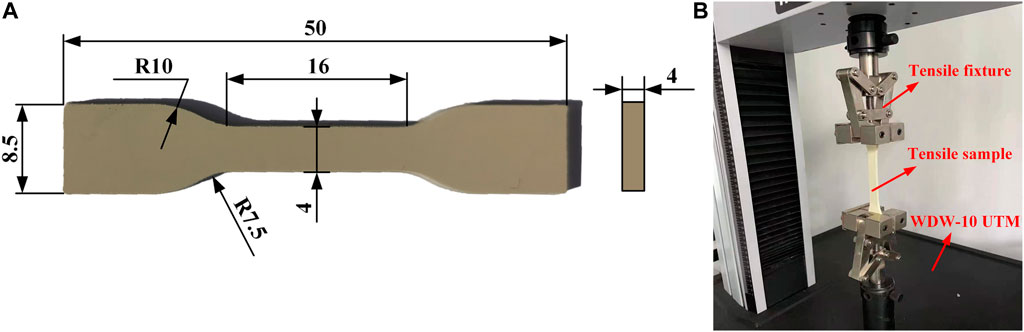
FIGURE 5. Tensile test. (A) Tensile specimen size. (B) Universal testing machine.
The dynamic strain calibration experiment for the piezoelectric composite sensor was constructed to investigate the sensing sensitivity, as shown in Figure 6. A strain gauge and piezoelectric composite sensor were attached with epoxy resin at the same position on the uniform strength beam’s upper and lower surfaces. After the release of the free end of the uniform strength beam at random initial displacement x0, the response signals of the piezoelectric composite sensor and strain gauge were collected by an NI USB-6366 data acquisition card and dynamic strain indicator. The signals were denoised by a continuous wavelet method, and then the maximum strain signal amplitude
where n is the number of experiment tests. To ensure the accuracy of the data of the experiment, n is not less than 30.
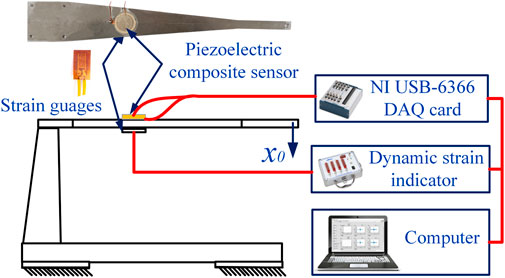
FIGURE 6. Random dynamic strain calibration experiment for the piezoelectric composite sensor.
The influence of ambient temperatures on the sensing sensitivity of the composite was explored by constructing a sensor ambient temperature adaptability experiment. The schematic diagram is shown in Figure 7. An aluminum plate was used as the guide wave medium, and a piezoelectric wafer was used as the actuator. The excitation signal is a sinusoidal five-period signal modulated by the Hanning window. The fabricated piezoelectric composite sensor was used to receive the UGW in the aluminum plate, and the signal was measured by an NI 6366 data acquisition card through the PXPA3 preamplifier. The sampling frequency was 2 MHz. The experiments were conducted from 0–75°C at 5°C intervals. The voltage signals were collected 100 times and then averaged to obtain the guide wave response.
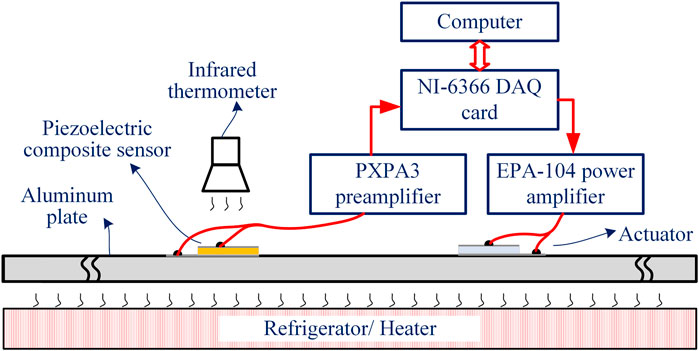
FIGURE 7. Temperature adaptability experiment schematic diagram for the piezoelectric composite sensor.
The thermomechanical properties of the piezoelectric composite were measured by the TAQ800 dynamic mechanical analyzer (DMA). The piezoelectric composite’s energy storage modulus and damping loss factor were measured in the −55–75°C temperature range at a heating rate of 5°C/min.
In this study, the effects of poling conditions (poling electric field, poling time, and poling temperature), PZT volume fraction, and PZT powder size on the properties of the 0–3 PZT/silicone resin piezoelectric composite were systematically discussed, especially their effects on the piezoelectric constant, dielectric constant, elastic modulus, failure strain, and hardness of the piezoelectric composite. The aim is to determine the preparation process of the 0–3 PZT/silicone resin piezoelectric composite for optimal sensing sensitivity under sensor engineering application conditions. The following sub-sections present and discuss these results.
The poling of the piezoelectric composite was a process of electric domain reorientation and arrangement under the action of the external electric field. The influences of poling time, poling electric field, and poling temperature are discussed to check the effects of poling conditions on the piezoelectric constant
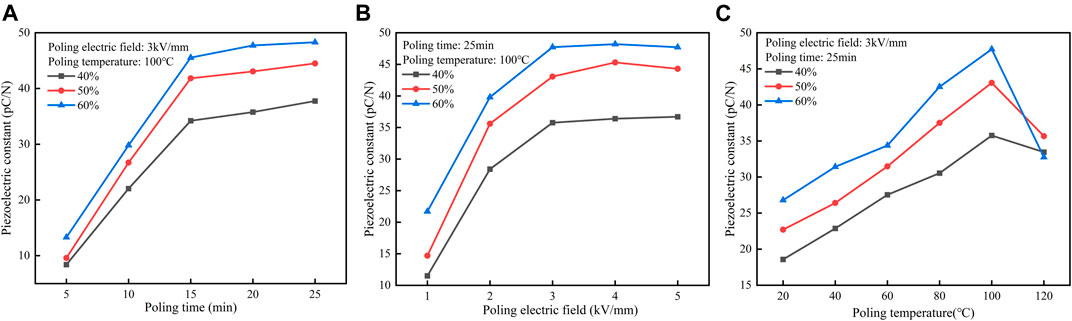
FIGURE 8. Dependence of the composite piezoelectric constant on poling conditions. (A) Dependence on poling time. (B) Dependence on the poling electric field. (C) Dependence on the poling temperature.
The poling electric field was controlled at 1, 2, 3, 4, and 5 kV/mm to explore its effect on
For the results shown in Figure 8C, the poling electric field and poling time were fixed at 3 kV/mm and 25 min, respectively, and the poling temperature was controlled at 20, 40, 60, 80, 100, and 120°C. When the poling temperature was below 100°C,
From the results of the aforementioned three experiments, it is found that there is a particular optimal condition for poling, but this optimal condition is not precisely known. Therefore, we adopted the ANOVA (analysis of variance) statistical method to investigate the effects of the three different poling condition variables (poling time, poling electric field, and poling temperature).
The ANOVA results are summarized in Table 1, where DF is the degrees of freedom in the independent variables, SS is the sum of squares among the groups, and MS is the mean squares. The F-value is the variance of the group means divided by the mean of the within-group variances, and the p-value is a function of the observed sample results used to test a statistical hypothesis. The significance of independent variables can be decided when the p-value is below 0.05. The p-values of the poling time and poling electric field are below 0.05 in this study, indicating that they are significant.
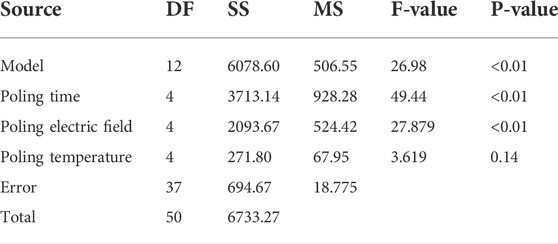
TABLE 1. ANOVA result of the piezoelectric constant.
Figure 9 shows the main effect on the piezoelectric constant. It can be concluded that the poling time is the most important factor among poling conditions on the piezoelectric constant, the second is the poling electric field, and the poling temperature is the least important factor. As a result, the optimal poling conditions of the 0–3 PZT/silicone resin piezoelectric composite are 25 min poling time, 4 kV/mm poling electric field, and 100°C poling temperature.
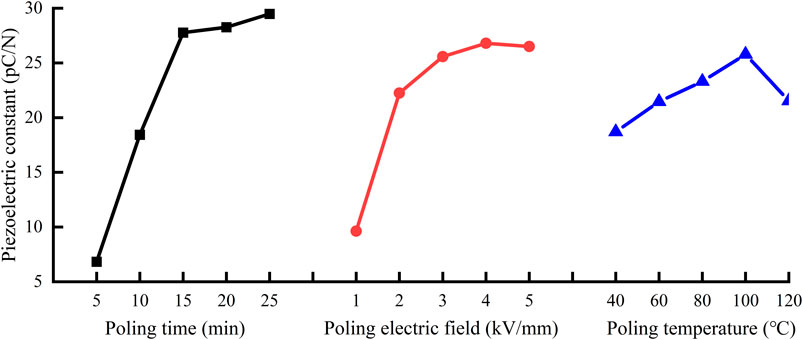
FIGURE 9. Main effect on the mean of
According to the densest packing model of spherical particles (Yu et al., 2006), when the PZT volume fraction was close to 64%, many piezoelectric particles are in contact with each other, which forms a “1–3″ or “3–3″connectivity pattern, the composite was difficult to cure. Therefore, the PZT volume fractions of the 0–3 piezoelectric composites were 35, 40, 45, 50, 55, and 60%. The PZT powder sizes were controlled to be 1∼15, 45∼80, 90∼113, 113∼170, 170∼212, 212∼315, and 315∼400 μm. Figure 10 shows the
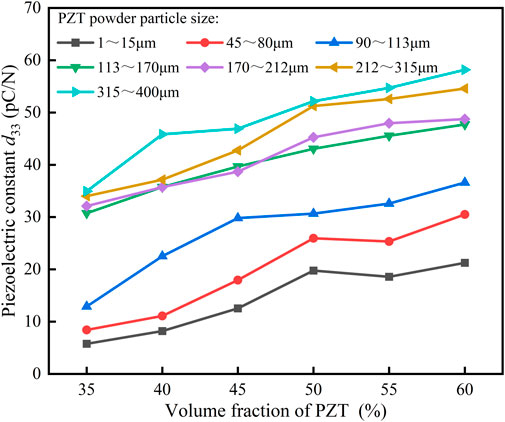
FIGURE 10. Variation of composite
The
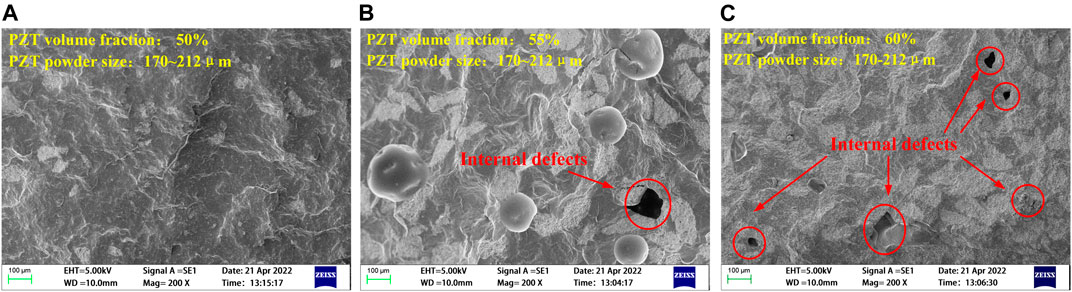
FIGURE 11. SEM of PZT/silicone resin composites. (A) PZT volume fraction 50%. (B) PZT volume fraction 55%. (C) PZT volume fraction 60%.
The effects of the PZT volume fraction and PZT powder size on the dielectric properties of 0–3 PZT/silicone resin composites were investigated. The capacitance of piezoelectric composite samples was measured at room temperature and 1 kHz, and the relative dielectric constant
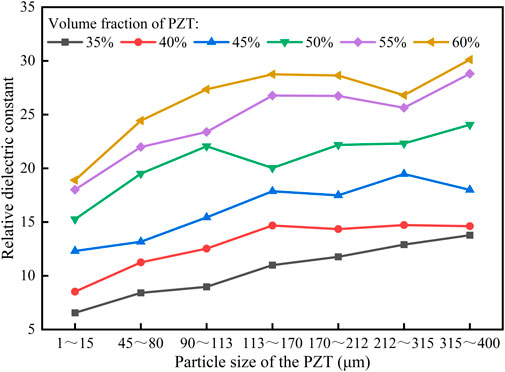
FIGURE 12. Variation of the composite relative dielectric constant with PZT volume fraction and powder size.
The
The elastic modulus, failure stress, and hardness are essential material mechanical properties. The elastic modulus is usually expressed by Young’s modulus, and the values for the samples were calculated from the initial slope of the tensile stress–strain curves. The stress–strain curves for piezoelectric composites with different PZT volume fractions are plotted in Figure 13A. The stress–strain curves for piezoelectric composites with different PZT powder sizes at 50% PZT volume fraction are plotted in Figure 13B.
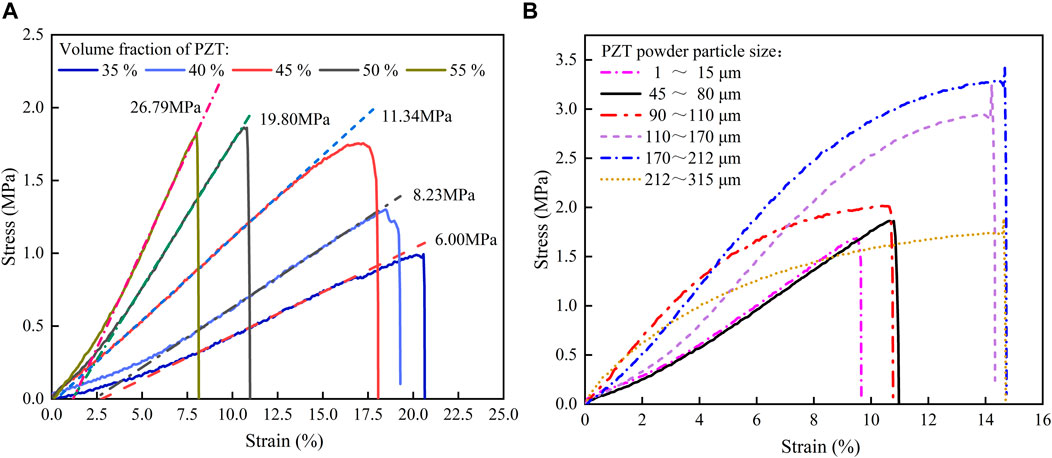
FIGURE 13. Tensile stress–strain curves of PZT/silicone resin composites. (A) Different PZT volume fractions. (B) Different PZT particle sizes.
These figures show that Young’s modulus values increase as the PZT volume fraction increases, consistent with the Yamada theory. Young’s modulus values also increase as the PZT powder size increases. When the PZT powder size is above 110 μm, its effect on Young’s modulus is gradually weakened because PZT with small particle sizes is more likely to accumulate in groups, resulting in defects such as uneven composite distribution. PZT with large particle sizes is evenly distributed in the silicone resin, which can effectively distribute the tensile stress, resist deformation, and improve the elastic modulus.
The effects of the PZT volume fraction and powder size on the failure strain of the composite are shown in Figure 14. The failure strain of the composite decreases with increasing PZT volume fraction. When the PZT volume fraction is 60%, the composite has many internal defects, resulting in very low failure strain. Primarily because the matrix material used for bonding is reduced with increased PZT content, the binding ability of the material decreases, the tensile limit strain of the material is reduced, and the failure strain decreases.
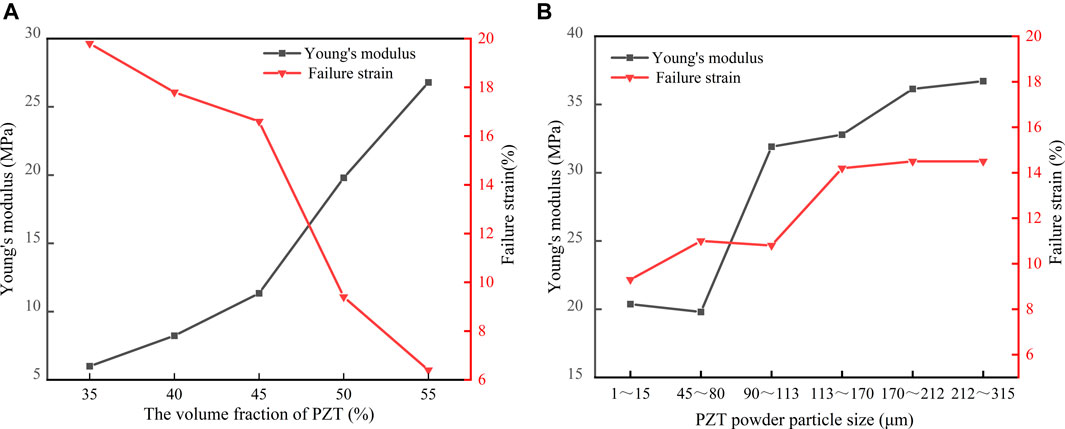
FIGURE 14. Young’s modulus and failure strain values of PZT/silicone resin composites. (A) Different PZT volume fractions. (B) Different PZT powder sizes.
The failure strain decreases as PZT powder size decreases. For the same PZT volume fraction, smaller PZT powder sizes result in a larger number of PZT particles, so the weak binding interface area between the particles and the matrix increases accordingly. Therefore, for increasing PZT volume fraction or decreasing PZT particle size, the weak binding interface and defects between the PZT particles and the silicone resin matrix become the main reasons for the reduction of Young’s modulus and failure stress values.
The variation in hardness with the PZT volume fraction and powder size is shown in Figure 15. It can be seen that the hardness of the composite increases as the PZT volume fraction increases. The hardness of the composite for PZT volume fractions below 50% shows a slowly increasing trend, while the hardness for 50% PZT volume fractions and above does not change significantly. An increase in the powder size can only increase the hardness of lower PZT volume fraction composites to a certain extent. With respect to satisfying the application conditions, when external objects directly impact the sensor, a greater piezoelectric composite surface hardness means an increased ability of the sensor to resist external impact.
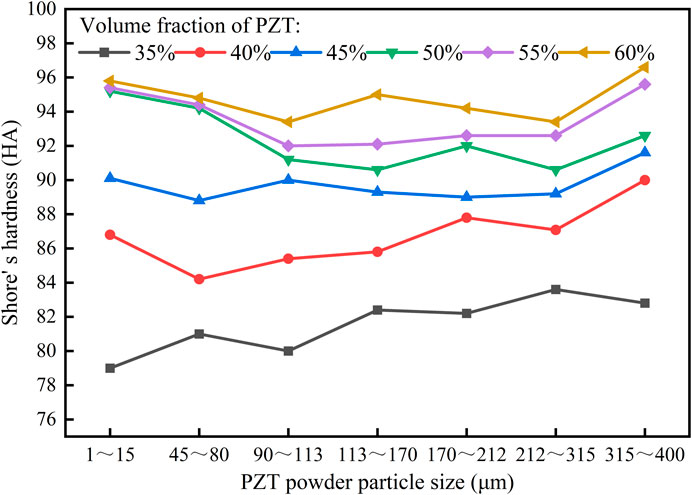
FIGURE 15. Variation of composite Shore hardness with PZT volume fraction and powder size.
The strain sensitivity can be measured with piezoelectric composite sensors in stochastic dynamic strain calibration experiments. Figure 16A shows the measured sensing sensitivity values for different PZT volume fractions for the 170∼212 μm powder size, while Figure 16B shows the sensing sensitivity for different powder sizes with a 50% volume fraction. The results show that the composite sensing sensitivity increases with increasing PZT volume fraction. It increases rapidly when the PZT volume fraction is below 50%. The composite has low failure strain and reduced sensitivity when the PZT volume fraction is 60%, which is difficult to be applied to structures with large strain and strong vibration. The sensing sensitivity is highest when the volume fraction is 50∼55%. The sensing sensitivity of the composite tends to increase first and then decrease slowly with increasing PZT powder size, peaking at 170∼315 μm. This is because of the change in piezoelectric and elastic modulus ratios to the dielectric constant caused by changes in the PZT volume fraction and powder size.
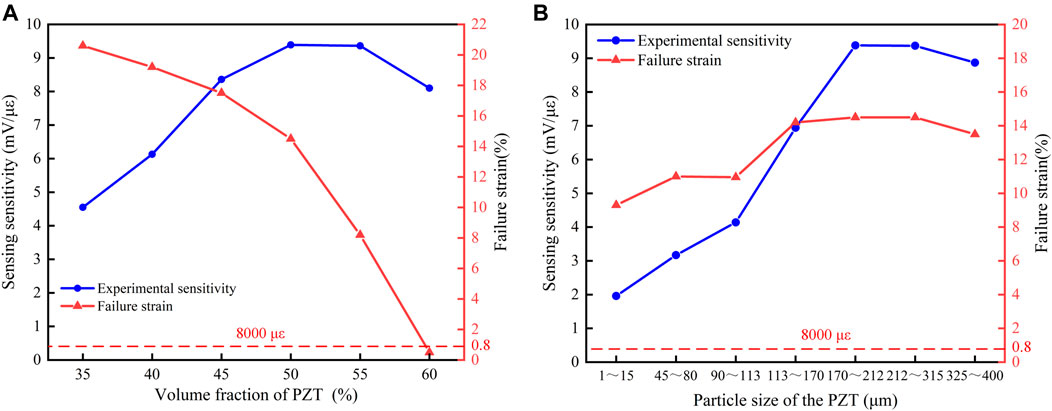
FIGURE 16. (A) Relationship between sensitivity and PZT volume fraction for the 170∼212 μm powder size. (B) Relationship between sensitivity and PZT powder size for a 50% volume fraction.
Based on the aforementioned conclusions, selecting the right composite preparation process can guarantee optimal sensing sensitivity while ensuring that the sensor does not exceed the failure strain. For example, for a sensor required for large curved surface structures such as aircraft wings with an 8,000 με test range, a material with a PZT volume fraction of 50% and a powder size of 170∼212 μm should be preferred to obtain optimal sensing sensitivity.
When the PZT volume fraction is 50% and the powder size is 170∼212 μm within the temperature range from −55–75°C, the energy storage modulus and loss factor curves of the piezoelectric composite are shown in Figure 17. The results show that the storage modulus of the piezoelectric composite decreases in steps with increasing temperature, and the storage modulus is the largest between −55°C and −15°C, indicating that the PZT/silicone resin piezoelectric composite possesses better sensing performance in the low-temperature range.
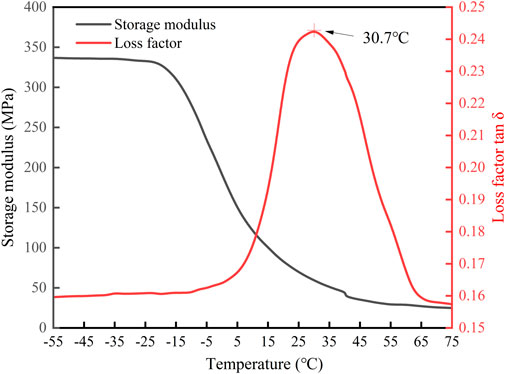
FIGURE 17. Composite storage modulus and loss factor at different temperatures.
The loss factor increases first and then decreases with temperature. The piezoelectric composite is in the glass transition region between 15 and 55°C, and the loss factor peaks at 30.7°C. This shows that as the temperature increases, the composite enters the glass transition temperature zone, the motion of the silicone resin molecular segments accelerates, and the storage modulus decreases significantly. The structure of piezoelectric composites changes in the glass transition temperature region and gradually transforms from a linear elastomer to exhibiting viscoelasticity and viscoplasticity.
The ambient temperature adaptability experiment for the piezoelectric composite sensor has verified the guide wave response signal and amplitude when the PZT volume fraction is 50% and the powder size ranges from 170–212 μm within the 0∼75°C temperature range, as shown in Figure 18. The sensor can effectively detect Lamb waves within the temperature range from 0–75°C, but the amplitude decreases as the temperature increases. In addition, when the temperature is below 30°C, the sensing response amplitude of the piezoelectric composite shows a strong linear relationship with temperature. However, when the temperature is above 30°C, the relationship is nonlinear because the composite transitions from linear elasticity to viscoelasticity when the composite enters the glass transition zone, and the change in sensitivity is caused by the change in the composite mechanical properties. In summary, the PZT/silicone resin piezoelectric composite can be applied to the structural health monitoring of the aircraft at service temperatures, but its sensitivity should be calibrated according to the environmental temperature.
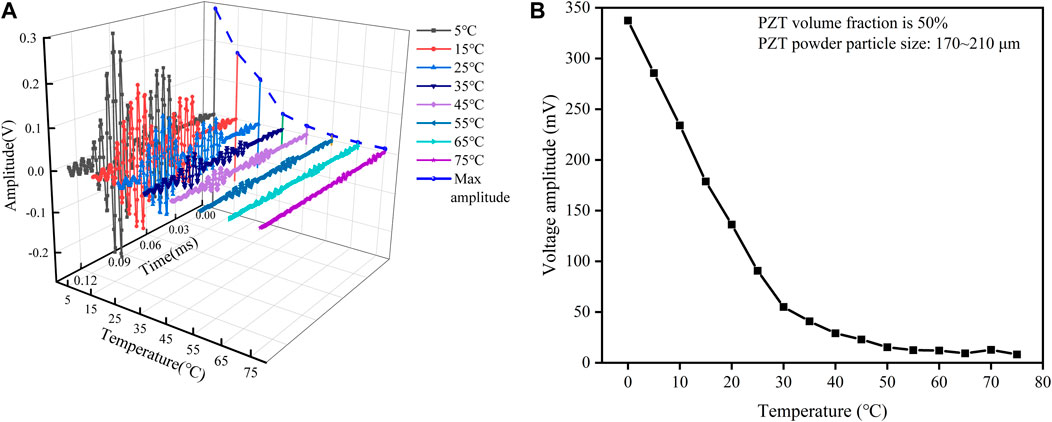
FIGURE 18. (A) Sensor response signal waveforms at different temperatures. (B) Sensor response voltage amplitude relationship variation with ambient temperatures.
In this study, a novel 0–3 PZT/silicone resin piezoelectric composite was fabricated, and the preparation of the piezoelectric composite and sensors was explained. Considering the application requirements of sensors for aircrafts, the piezoelectric constant, dielectric constant, elastic modulus, failure strain, hardness, sensing sensitivity, and material temperature applicability were proposed to demonstrate the application potential of the 0–3 PZT/silicone resin piezoelectric composite in sensors. The influences of poling conditions, PZT volume fraction, and PZT powder size on characterizations were studied. The sensing response model and experimental studies determined the composite fabrication process for optimal sensing sensitivity over the range required for aircraft structural health monitoring, and the verification experiment of the composite sensor’s temperature applicability was conducted.
The results showed that the optimal poling condition of the 0–3 PZT/silicone resin piezoelectric composite is when the poling time is 25 min, the poling electric field is 4 kV/mm, and the poling temperature is 100°C. When the sensor is required to meet a test range of 8,000 με, the composite should be fabricated with a PZT volume fraction of 50% and a powder size of 170∼212 μm to obtain optimal sensing sensitivity. The sensor can effectively detect guide waves within the ambient temperature range from -55–75°C, and the sensing sensitivity is highest in the low-temperature range. The research results are expected to provide a new flexible piezoelectric sensing technology for aircraft curved structural damage detection.
The raw data supporting the conclusion of this article will be made available by the authors, without undue reservation.
SJ contributed to the methodology, experimental test, and writing—original. YS supervised this research and helped in data analysis and modification. SW analyzed the experimental data. YZ performed the experiments. BH reviewed and edited the original manuscript. All authors participated in the revision of the draft and approved the final version of the manuscript.
This research was funded by the National Natural Science Foundation of China (No. 52175091), the Hunan Innovative Province Construction Special Foundation (No. 2020RC3049), the Hunan Provincial Natural Science Foundation (Nos. 2020JJ6029, 2021JJ60007, and 2022JJ30260), and the Foundation of Hunan Educational Committee (No. 21A0310).
The authors declare that the research was conducted in the absence of any commercial or financial relationships that could be construed as a potential conflict of interest.
All claims expressed in this article are solely those of the authors and do not necessarily represent those of their affiliated organizations, or those of the publisher, the editors, and the reviewers. Any product that may be evaluated in this article, or claim that may be made by its manufacturer, is not guaranteed or endorsed by the publisher.
Arul, K. T., and Rao, M. S. R. (2020). Ferroelectric properties of flexible PZT composite films. J. Phys. Chem. Solids 146, 109371. doi:10.1016/j.jpcs.2020.109371
Di rito, G., Chiarelli, M. R., and Luciano, B. (2020). Dynamic modelling and experimental characterization of a self-powered structural health-monitoring system with MFC piezoelectric patches. Sensors 20, 950. doi:10.3390/s20040950
Eltouby, P., Shyha, I., Li, C., and Jibran, K. H. A. L. I. Q. (2021). Factors affecting the piezoelectric performance of ceramic-polymer composites: A comprehensive review. Ceram. Int. 47, 17813–17825. doi:10.1016/j.ceramint.2021.03.126
Giurgiutiu, V. (2015). Published. SHM of aerospace composites—challenges and opportunities. Proc. Compos. Adv. Mater. Expo 2015, 1–15. Dallas, TX: CAMX.
Han, D.-H., and Kang, L.-H. (2018). Piezoelectric characteristics of PNN-PZT/Epoxy paint sensor according to the poling conditions. Sensors Actuators A Phys. 269, 419–426. doi:10.1016/j.sna.2017.12.005
Han, D.-H., and Kang, L.-H. (2020). Piezoelectric properties of paint sensor according to piezoelectric materials. Funct. Compos. Struct. 2, 025002. doi:10.1088/2631-6331/ab90e1
Jia, H., Li, H., Lin, B., Hu, Y., Peng, L., Xu, D., et al. (2021). Fine scale 2-2 connectivity PZT/epoxy piezoelectric fiber composite for high frequency ultrasonic application. Sensors Actuators A Phys. 324, 112672. doi:10.1016/j.sna.2021.112672
Jiang, S., Shen, Y., Wang, S., Peng, Y., and Liu, Y. (2021). The effect of piezoelectric fiber rosette configurations on lamb wave direction detection for damage localization. J. Sensors 2021, 1–10. doi:10.1155/2021/9918049
Jin, L., Ma, S., Deng, W., Yan, C., Yanga, T., Chua, X., et al. (2018). Polarization-free high-crystallization β-PVDF piezoelectric nanogenerator toward self-powered 3D acceleration sensor. Nano Energy 50, 632–638. doi:10.1016/j.nanoen.2018.05.068
Kang, G.-D., and Cao, Y.-M. (2014). Application and modification of poly (vinylidene fluoride)(PVDF) membranes–a review. J. Membr. Sci. 463, 145–165. doi:10.1016/j.memsci.2014.03.055
Kang, L.-H., and Lee, J.-R. (2014). Piezoelectric paint sensor for impact and vibration monitoring. 7th European workshop on structural health monitoring. La cité, nantes, France: More info at open access database. Chonbuk: Korea.
Kang, S.-H., and Kang, L.-H. (2017). Development of wireless bird collision monitoring system using 0-3 piezoelectric composite sensor on wind turbine blades. J. Intelligent Material Syst. Struct. 29, 3426–3435. 1045389X17730925. doi:10.1177/1045389x17730925
Pramanik, R., and Arockiarajan, A. (2019). Effective properties and nonlinearities in 1-3 piezocomposites: A comprehensive review. Smart Mat. Struct. 28, 103001. doi:10.1088/1361-665X/ab350a
Praveenkumar, B., Kumar, H. H., and Kharat, D. K. (2006). Study on microstructure, piezoelectric and dielectric properties of 3-3 porous PZT composites. J. Mat. Sci. Mat. Electron. 17, 515–518. doi:10.1007/s10854-006-8228-y
Ricci, F., Monaco, E., Boffa, N., Maio, L., and Memmolo, V. (2022). Guided waves for structural health monitoring in composites: A review and implementation strategies. Prog. Aerosp. Sci. 129, 100790. doi:10.1016/j.paerosci.2021.100790
Rocha, H., Semprimoschnig, C., and Nunes, J. P. (2021). Sensors for process and structural health monitoring of aerospace composites: A review. Eng. Struct. 237, 112231. doi:10.1016/j.engstruct.2021.112231
Royon, M., Jamon, D., Blanchet, T., Royer, F., Vocanson, F., Marin, E., et al. (2021). Sol–gel waveguide-based sensor for structural health monitoring on large surfaces in aerospace domain. Aerosp. (Basel). 8, 109. doi:10.3390/aerospace8040109
Salamone, S., Bartoli, I., Scalea, F. L. D., and Coccia, S. (2009). Guided-wave health monitoring of aircraft composite panels under changing temperature. J. Intell. Mat. Syst. Struct. 20, 1079–1090. doi:10.1177/1045389X08101634
Sappati, K. K., and Bhadra, S. (2020). Flexible piezoelectric 0–3 PZT-PDMS thin film for tactile sensing. IEEE Sens. J. 20, 4610–4617. doi:10.1109/JSEN.2020.2965083
Scarponi, C. (2015). Hemp fiber composites for the design of a Naca cowling for ultra-light aviation. Compos. Part B Eng. 81, 53–63. doi:10.1016/j.compositesb.2015.06.001
Sofi, A., Jane Regita, J., Rane, B., and Lau, H. H. (2022). Structural health monitoring using wireless smart sensor network – an overview. Mech. Syst. Signal Process. 163, 108113. doi:10.1016/j.ymssp.2021.108113
Stepinski, T., Mańka, M., and Martowicz, A. (2017). Interdigital lamb wave transducers for applications in structural health monitoring. NDT E Int. 86, 199–210. doi:10.1016/j.ndteint.2016.10.007
Wang, X., Lu, H., Wang, H., and Feng, S. (2010). Synthesis and photophysical properties of rare earth-containing luminescent silicone resin from cooperative molecular design and assembly. J. Non-Crystalline Solids 356, 1581–1586. doi:10.1016/j.jnoncrysol.2010.05.059
Wang, Y., Hu, S., Xiong, T., Huang, Y., and Qiu, L. (2021). Recent progress in aircraft smart skin for structural health monitoring. Struct. Health Monit. 14759217211056831, 147592172110568. doi:10.1177/14759217211056831
Yang, C. (2017). Distributed piezoelectric transducers and their applications in structural health monitoring. Dissertation/Doctor’s degree. Siegen: University of Siegen.
Yang, C., and Fritzen, C. P. (2012). Piezoelectric paint: Characterization for further applications. Smart Mat. Struct. 21, 045017. doi:10.1088/0964-1726/21/4/045017
Yu, A. B., An, X. Z., Zou, R. P., Yang, R. Y., and Kendall, K. (2006). Self-Assembly of particles for densest packing by mechanical vibration. Phys. Rev. Lett. 97, 265501. doi:10.1103/PhysRevLett.97.265501
Keywords: piezoelectric composite, flexible sensor, performance characterization, sensing sensitivity, ultrasonic guided wave, curved surface structure
Citation: Jiang S, Shen Y, Wang S, Zhi Y and Han B (2022) Properties of novel 0–3 PZT/silicone resin flexible piezoelectric composites for ultrasonic guided wave sensor applications. Front. Mater. 9:958775. doi: 10.3389/fmats.2022.958775
Received: 01 June 2022; Accepted: 01 August 2022;
Published: 02 September 2022.
Edited by:
Jian Zhou, Hunan University, ChinaReviewed by:
Mengying Xie, Tianjin University, ChinaCopyright © 2022 Jiang, Shen, Wang, Zhi and Han. This is an open-access article distributed under the terms of the Creative Commons Attribution License (CC BY). The use, distribution or reproduction in other forums is permitted, provided the original author(s) and the copyright owner(s) are credited and that the original publication in this journal is cited, in accordance with accepted academic practice. No use, distribution or reproduction is permitted which does not comply with these terms.
*Correspondence: Yiping Shen, eXBzaEBobnVzdC5lZHUuY24=
Disclaimer: All claims expressed in this article are solely those of the authors and do not necessarily represent those of their affiliated organizations, or those of the publisher, the editors and the reviewers. Any product that may be evaluated in this article or claim that may be made by its manufacturer is not guaranteed or endorsed by the publisher.
Research integrity at Frontiers
Learn more about the work of our research integrity team to safeguard the quality of each article we publish.