 Nuo Chen
 Decai Li
 Jinyu Xue
 Yuan Yin1
 Yanwen Li
95% of researchers rate our articles as excellent or good
Learn more about the work of our research integrity team to safeguard the quality of each article we publish.
Find out more
ORIGINAL RESEARCH article
Front. Mater. , 05 August 2022
Sec. Smart Materials
Volume 9 - 2022 | https://doi.org/10.3389/fmats.2022.957446
This article is part of the Research Topic Characterization and Application of Magneto-sensitive Soft Materials View all 20 articles
The aim of the study was to analyze acoustic emission (AE) signals generated in different magnetic fluid sealing processes to estimate the status of the seal. Based on a magnetic fluid rotary sealing experimental setup, the AE sensor is respectively attached to the shell at the corresponding position of the seal, and the external pressure is applied to the magnetic fluid seal by a gas supply system. As the pressure gradually increases, the magnetic fluid sealing rings under different pole teeth are gradually broken, and processes such as pressure transfer between the seal stages occur. These processes generate different AE signals, which are collected by the sensors. The results show that the root-mean-square values of AE signals generated at the moment of sealing failure are different from those generated before and after. At the same time, by analyzing the characteristic values of AE signals generated in the whole process, we can infer the time when the rupture begins under different pole pieces and further estimate the status of the magnetic fluid seal. For the first time, this research demonstrates the experimental and data analysis procedures of AE technology for magnetic fluid seals.
As a new type of functional material, magnetic fluid has unique properties with both magnetism and fluidity (Odenbach, 2003; Kadau et al., 2016). Therefore, it has been widely used in various fields like tilt measurement sensors (Medvegy et al., 2017) and rotary seals (Huang and Rui, 2011; Wang et al., 2017; Parmar et al., 2018; Li et al., 2021). Compared with traditional sealing, the biggest advantage of magnetic fluid seals is the zero-leakage characteristics, so it plays a very important and irreplaceable role in many fields.
To improve the pressure resistance and durability of the magnetic fluid seal, the sealing gap should be very small, which is generally about 0.1–0.3 mm. Once injected into the structure, it is difficult to estimate the working status of the magnetic fluid in the gap and then predict the failure. This hinders the further application of magnetic fluid seals. Therefore, it is imperative to find a non-destructive testing method to estimate the sealing status of the magnetic fluid seal.
For now, there are few related studies. In 1999, Odenbach S used magnetic small angle neutron scattering (MSANS) to detect the flow pattern of the concentrated magnetic fluids (Odenbach et al., 1999). In 2010, A García-Arribas described a microfluidic device for the determination of the concentration of magnetic micro and nanoparticles, under a continuous flow of the carrier fluid, by means of the Giant Magneto-Impedance effect (Garcia- Arribas et al., 2010). These methods can be used to estimate the status of the magnetic fluid but cannot be applied to the sealing fields. In 2014, Weiming Gao used X-rays and CT to detect the distribution of the magnetic fluid in the sealing gap, but the results were not good enough (Gao, 2014).
AE method is a non-destructive monitoring method that can provide real-time information about changes in the internal structure of materials. This method can not only detect the deformation and fracture of materials but also collect information regarding the second type of acoustic emission sources as well, such as friction and collision (Fan et al., 2020). Thus, it has been well used in the field of mechanical seals (Li et al., 2016; Yin et al., 2018; Yin et al., 2020). It is proved that as long as sliding occurred between two rings, it becomes the major contributor of AE signals (within particular frequency bands) from a tribo-pair. So the RMS of AE signals can represent the instant severity of friction.
Studies have been carried out to prove that such processes such as bubble leakage, magnetic fluid barriers rupture, airflow, and pressure transfer during the sealing failure (Pinkus, 1982; Szczech, 2018; Szczech, 2019; Zhou et al., 2021; Guan and Yang, 2022; Sun et al., 2022). We believe these processes will theoretically generate different AE signals compared to the fully-sealed periods, which can be collected and analyzed. So, we did this research, applied the AE technology to magnetic fluid seals for the first time, and achieved some good results accordingly.
The magnetic fluid in the seal is in the magnetization saturation in most cases. In addition, if the influence of the gravitational field and the surface tension forces are ignored, the critical pressure for one stage can be determined by:
Here,
However, the critical pressure is limited when the seal has only one stage, so most of the seal applications use a multi-stage structure. The total sealing capability of the magnetic fluid seal can be approximately expressed as follows:
Furthermore, Marcin Szczech had performed a series of tests on a transparent model of a multistage magnetic fluid seal (Szczech, 2018). He thought a leak in the magnetic fluid would occur when applied pressure
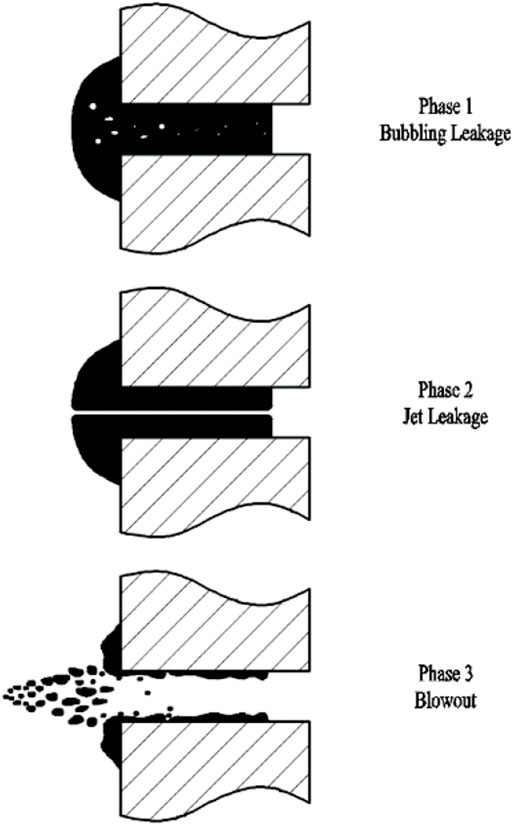
FIGURE 1. Phases in magnetic fluid sealing failure.
Phase 1: When the
Phase 2: When
Phase 3: When
A multi-stage seal is used in this work. As shown in Figure 2, the magnetic fluid seal consists of a rotary shaft, two pole pieces, a permanent magnet, a shell, and some other parts. The material of the permanent magnet is Nd-Fe-B with an N35 grade. The shell was made of 304 stainless steel, of which permeability is approximately equal to vacuum permeability. The magnetic fluid was synthesized by our laboratory. The materials of the pole pieces and the rotary shaft are 2Cr13 stainless steel with high magnetic permeability. There are 30 pole teeth evenly distributed on the rotating shaft at the corresponding position of each pole piece, which means there are 60 pole teeth at all. The diameter of the shaft is 50 mm. The gap height is 0.1 mm. The distance from the gap to the outer surface of the shell is approximately 25 mm where we put our AE sensor.
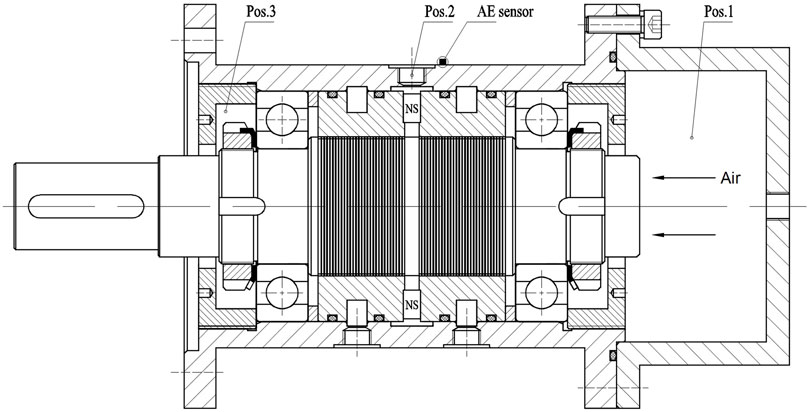
FIGURE 2. Structure of the multi-stage seal used in the research.
As shown in Figure 3, the experimental setup had the following parts: gas (air) supply system, pressure signal collection system, AE signal collection system, the magnetic fluid seal, and the computer.
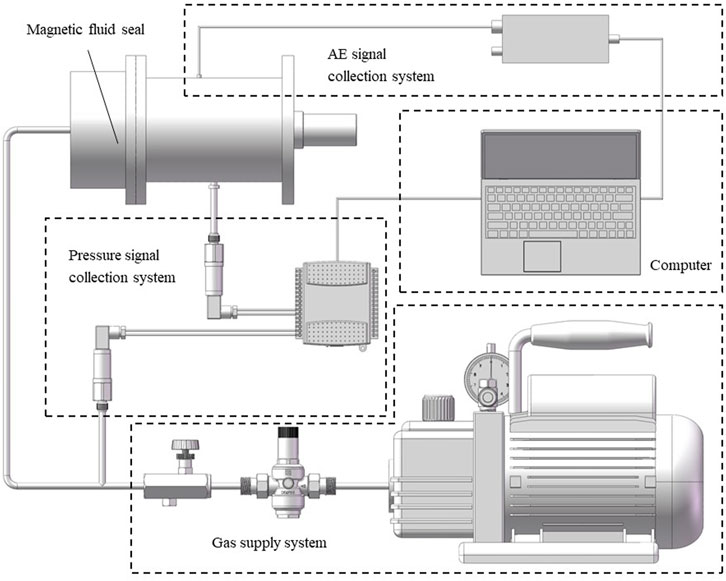
FIGURE 3. Schematic diagram of the experimental setup.
During the test, compressed air is delivered from a high-pressure air cylinder. A pressure-reducing valve is installed at the pressure inlet to create a stable high-pressure environment. Then, the airflow rate is regulated by a throttle valve. The sealing region is divided into 3 chambers by two pole pieces. The right chamber (Pos.1) is connected to the pressure inlet, and the left chamber (Pos.3) is connected to the atmosphere. Two sensors are equipped to measure the air pressure. The sensor labeled as P1 measures the air pressure in the right chamber (Pos.1). The P2 sensor measures the pressure between seal stages 1 and 2 (Pos.2). The diameter of the pressure measuring hole is 1.5 mm and simulations show that the hole has little influence on the magnetic field distribution. The measurement range is from 0 to 100 kPa, and the measurement accuracy is 0.5%. The pressure signal is sent to the acquisition card (National Instruments), which communicates with the computer using LabVIEW software.
A miniature sensor, PICO, produced by Physical Acoustics Corporation, was employed in the AE measuring system. The sensor was mounted to the shell at the corresponding position of the seal, allowing the clear monitoring of AE signals from the gap and concealing AE signals from other parts of the seal. The signals were acquired by AE win software provided by the same company. An AE wave was recorded every 1.3 ms for further processing. Each AE wave contained 1,024 sampling points at a sampling rate of 2000 kHz. In this experiment, the obtained acoustic emission signal was continuous. Therefore, we used the root mean square (RMS) to represent the energy of the AE signal. The calculation formula is expressed as follows:
During the research presented in this article, the rotational speed of the seal keeps zero. Tests under dynamic situations will be conducted in future work.
In the earlier stages of the magnetic fluid seal, the air pressure kept increasing. After the failure occurred the air pressure began to decrease. The pressure curves obtained throughout the whole period are shown in Figure 4A, which includes the first-stage-sealed period, second-stage-sealed period, and full-failure period. The AE RMS curves are shown in Figure 4B. To smooth out short-term fluctuations, a moving average method was implemented for AE signals.
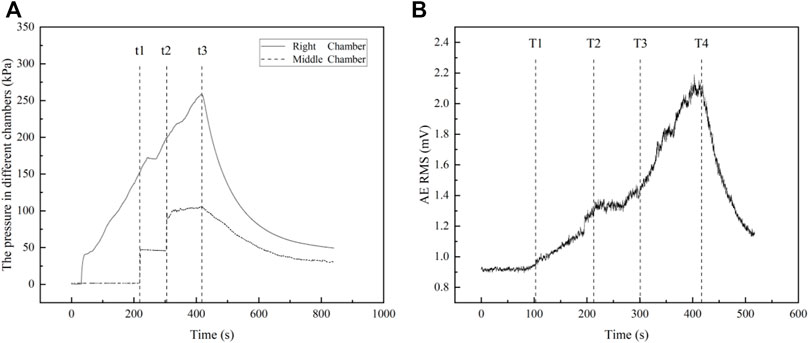
FIGURE 4. (A) Pressure curves; (B) AE RMS curves.
It can be seen from Figure 4A, that before time t1, the air pressure in the right chamber increased with time. The pressure difference between the two sides of the fluid ring-free surface under the first tooth also increased. When the pressure reached the critical value, the magnetic fluid barrier ruptured, which led to the flow of compressed air through the first tooth and brought some pressure to the second tooth. Then, some of the blew-out magnetic fluid moved back to the gap under the first tooth because of the magnetic force. The magnetic fluid barrier recovered in a short time. But soon it ruptured again. With the right chamber’s air pressure keeping increase, the same processes like rupture and recovery under other teeth continuously happened. Until time t1, all the 30 barriers under the first pole piece ruptured and the compressed air flowed from the right chamber into the middle chamber, which led to a rapid increase in pressure in the middle chamber. It meant the seal turned to the second-stage-sealed period from the first-stage-sealed period. After the big rupture, the pressure difference between the two chambers decreased because the pressure in the middle chamber increased with the air inflow. Because of the self-recovering property of the magnetic fluid, the first pole piece regained the ability to hold some pressure. At time t2, another big rupture was observed. Meanwhile, the air pressure in the right chamber continuously increased. During the period from t2 to t3, all magnetic fluid barriers under the first pole piece ruptured and recovered several times, and the pressure increased slowly in the middle chamber. After time t3, the inlet pressure reached the critical value of the seal, all fluid barriers ruptured entirely. The leakage channels in the magnetic fluid barriers connectingthe low-pressure side and high-pressure side. At the same time, the pressures in different chambers decreased rapidly.
It can be seen from Figure 4B, that throughout the whole period of the magnetic fluid seal, the energy of the AE signals continually increased before the rupture occurred and then decreased. In our case, AE signals came from three parts: the magnetic fluid seal, the gas supply system, and the environment. After we set down the outlet pressure of the air pump and the gas flow rate controlled by the throttle valve, the gas supply system remained in a stable state without any change during the whole process. At the same time, we chose to complete the experiment in a noiseless environment, and there were no sudden AE signals caused by human factors. Therefore, the reason for the change of the AE signals could only come from the process that occurred inside the magnetic fluid seal. When the air pressure gradually increased and exceeded the critical pressure, the magnetic fluid barrier under the pole piece would rupture and the air would flow, which would lead to the increase of the AE signals. For further research, we analyzed the frequency spectrums of a few AE waves from different periods, which were illustrated in Figure 5.
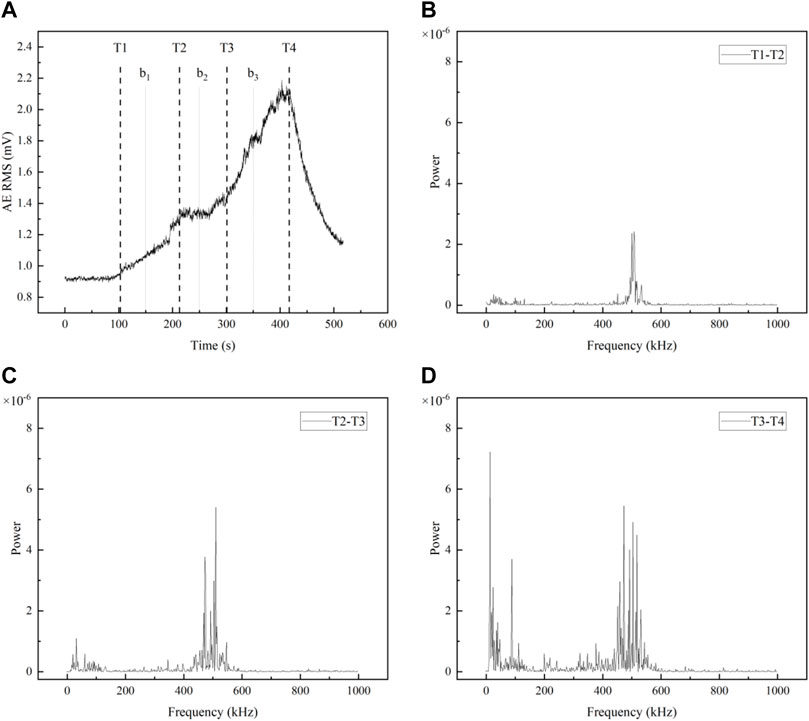
FIGURE 5. (A) AE RMS curves; (B–D) Frequency distributions of AE RMS in different periods.
They imply that the AE power is concentrated on several fixed bands. The frequency distribution of the AE waves at different times had different modes. It can be seen from Figure 5B, that the AE power tended to concentrate in the proximity of 510 and 30 kHz. Then, the time series of RMS before filtering and after filtering (with a band-pass filter of
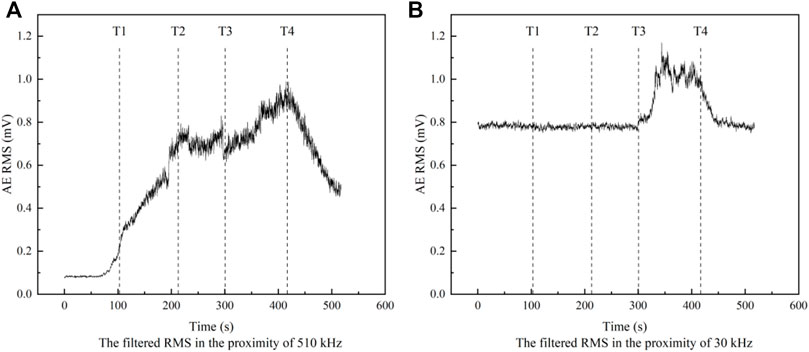
FIGURE 6. Filtered RMS in the proximity of (A) 510 and (B) 30 kHz.
Before time T1, the air pressure was not high enough to blow the magnetic fluid out from the pole tooth. The seal was kept full and no rupture occurred. The filtered RMS in the proximity of 510 kHz kept stable at a low value. The filtered RMS in the proximity of 30 kHz stayed at a relatively high value, which was obviously caused by the ambient noise.
During the period between time T1 and T2, because of the increasing air pressure, some of the magnetic fluid barriers ruptured and led to the flow of compressed air through the teeth, as described before. So, the RMS began to increase along with the increasing rupture level. The filtered RMS in the proximity of 510 kHz had the same trend. While the filtered RMS in the proximity of 30 kHz remained unchanged. Therefore, we believed the AE signals in the proximity of 510 kHz reflected the rupture under the first pole piece.
Before time T3, the first pole piece regained the ability to hold some pressure. The pressure difference between the middle and left chambers wasn’t big enough to cause a failure so the seal in the second stage remained full. The filtered RMS kept stable in a relatively high value in the proximity of 510 kHz due to the ruptures under the first stage and remained unchanged in the proximity of 30 kHz.
At time T3, the first-stage seal failed again and a lot of air flew into the middle chamber, which caused the ruptures under the second stage. The filtered RMS in the proximity of both 510 and 30 kHz began to increase. Considering this, we believed the AE signals in the proximity of 30 kHz contained the information of the rupture under the second pole piece in addition to the ambient noise.
After time T4, all fluid barriers ruptured entirely. The pressures in different chambers decreased and the filtered RMS in the proximity of both 510 and 30 kHz decreased as well.
Comparing the sealing status obtained by the analysis of the pressure and AE signals, the processes are barely the same and the latter is even more detailed. In our case, the increase of the filtered RMS in high frequency can indicate when the first-stage seal begins to fail, and the increase in the filtered RMS in low frequency can indicate when the second-stage seal begins to fail. Therefore, the way we estimate magnetic fluid sealing status based on acoustic emission monitoring works.
In this article, the method using acoustic emission monitoring to estimate the magnetic fluid sealing status has been studied by experiments. The conclusions and recommendations are as followed:
1). The power of AE signals is concentrated in several fixed frequency bands with different modes at an acoustic timescale. Therefore, we can obtain the different information carried by corresponding frequency bands by performing spectrum analysis on the RMS of AE signals. And the different information can reflect the different statuses of the magnetic fluid seal.
2). In this case, the increase of the filtered RMS in high frequency which is in the proximity of 510 kHz can indicate when the first-stage seal begins to fail. The increase of the filtered RMS in low-frequency proximity of 30 kHz can indicate when the second-stage seal begins to fail.
3). In further research, the effect of rotational speed, shaft diameter, temperature, the structure of the seal, and other factors on AE signals will be studied.
The raw data supporting the conclusion of this article will be made available by the authors, without undue reservation.
NC, DL, and JX contributed to the conception and design of the research. NC designed the experiment. NC and JX performed the statistical analysis. NC wrote the first draft of the manuscript. DL, YY, and YL contributed to manuscript revision, read, and approved the submitted version.
The work was supported by the National Key R&D Program of China (grant no. 2020YFB2006900) and the National Natural Science Foundation of China (grant nos. 51927810, U1837206, and 51735006).
The authors declare that the research was conducted in the absence of any commercial or financial relationships that could be construed as a potential conflict of interest.
All claims expressed in this article are solely those of the authors and do not necessarily represent those of their affiliated organizations, or those of the publisher, the editors, and the reviewers. Any product that may be evaluated in this article, or claim that may be made by its manufacturer, is not guaranteed or endorsed by the publisher.
Fan, W. J., Huang, W. F., Liu, Y., Yin, Y., Liu, X. F., Wang, Y. M., et al. (2020). State evolution of dry gas seal during repeated start-stop operation using acoustic emission method. Tribol. Trans. 63 (1), 173–181. doi:10.1080/10402004.2019.1674984
Gao, W. (2014). Research on the seal design and properties of magnetic fluid in the space environment [M.S]. Beijing: Beijing Jiaotong University.
Garcia-Arribas, A., Martinez, F., Fernandez, E., Ozaeta, I., Kurlyandskaya, G., Svalov, A., et al. (2010). GMI magnetic-particle concentration detection in continuous flow. Procedia Eng. 5, 1324–1327. doi:10.1016/j.proeng.2010.09.358
Guan, Y., and Yang, X. (2022). Experimental study on the pressure transfer mechanism of embedded magnetic fluid seals. Tribol. Trans. 2022, 1–10. doi:10.1080/10402004.2022.2066039
Huang, J. F., and Rui, Y. N. (2011). Design of magnetic fluid sealed structure for the high-speed non-woven loom needle spindle. Appl. Mech. Mater 43, 519–524. doi:10.4028/www.scientific.net/amm.43.519
Kadau, H., Schmitt, M., Wenzel, M., Wink, C., Maier, T., Ferrier-Barbut, I., et al. (2016). Observing the Rosensweig instability of a quantum ferrofluid. Nature 530 (7589), 194–197. doi:10.1038/nature16485
Li, X. H., Fu, P., Chen, K., Lin, Z. B., and Zhang, E. Q. (2016). The contact state monitoring for seal end faces based on acoustic emission detection. Shock Vib. 2016, 1–8. doi:10.1155/2016/8726781
Li, X. R., Li, Z. G., Zhu, B. S., Cheng, J., Li, W. X., and Yuan, J. Y. (2021). Optimal design of large gap magnetic fluid sealing device in a liquid environment. J. Magn. Magn. Mater 540, 168472. doi:10.1016/j.jmmm.2021.168472
Medvegy, T., Molnar, A., Molnar, G., and Gugolya, Z. (2017). Analysis of a ferrofluid core differential transformer tilt measurement sensor. J. Magn. Magn. Mat. 428, 189–193. doi:10.1016/j.jmmm.2016.12.026
Odenbach, S. (2003). Ferrofluids - Magnetically controlled suspensions. Colloids Surfaces A Physicochem. Eng. Aspects 217 (1-3), 171–178. doi:10.1016/s0927-7757(02)00573-3
Odenbach, S., Gilly, H., and Lindner, P. (1999). The use of magnetic small angle neutron scattering for the detection of flow profiles in magnetic fluids. J. Magn. Magn. Mat. 201, 353–356. doi:10.1016/s0304-8853(99)00032-3
Parmar, S., Ramani, V., Upadhyay, R. V., and Parekh, K. (2018). Design and development of large radial clearance static and dynamic magnetic fluid seal. Vacuum 156, 325–333. doi:10.1016/j.vacuum.2018.07.055
Pinkus, O. (1982). Model testing of magnetic-fluid seals. A S L E Trans. 25 (1), 79–87. doi:10.1080/05698198208983068
Sun, R., Li, D. C., and Jin, L. C. (2022). Experimental and theoretical investigation on magnetic fluid seal in capillary tube. J. Magn. Magn. Mat. 546, 168869. doi:10.1016/j.jmmm.2021.168869
Szczech, M. (2018). Experimental study on the pressure distribution mechanism among stages of the magnetic fluid seal. IEEE Trans. Magn. 54 (6), 1–7. doi:10.1109/tmag.2018.2816567
Szczech, M. (2019). The loss of continuity in a liquid ring formed by a magnetic fluid. IEEE Trans. Magn. 55 (9), 1–8. doi:10.1109/tmag.2019.2916322
Wang, Z. Z., Li, D. C., and Zhou, J. (2017). Non-uniform distribution of magnetic fluid in multistage magnetic fluid seals. J. Magn. 22 (2), 299–305. doi:10.4283/jmag.2017.22.2.299
Yin, Y., Huang, W. F., Liu, X. F., Liu, Y., Wang, Z. X., Fan, W. J., et al. (2018). Analysis of the dynamic friction of a gas face seal based on acoustic emissions. Tribol. Lett. 66 (3), 85. doi:10.1007/s11249-018-1037-7
Yin, Y., Liu, X. F., Huang, W. F., Liu, Y., and Hu, S. T. (2020). Gas face seal status estimation based on acoustic emission monitoring and support vector machine regression. Adv. Mech. Eng. 12 (5), 168781402092132. doi:10.1177/1687814020921323
Keywords: magnetic fluid, seal, acoustic emission, sealing failure, pressure transfer
Citation: Chen N, Li D, Xue J, Yin Y and Li Y (2022) Magnetic fluid sealing status estimation based on acoustic emission monitoring. Front. Mater. 9:957446. doi: 10.3389/fmats.2022.957446
Received: 31 May 2022; Accepted: 27 June 2022;
Published: 05 August 2022.
Edited by:
Yancheng Li, Nanjing Tech University, ChinaReviewed by:
Wenling Zhang, Nanjing University of Science and Technology, ChinaCopyright © 2022 Chen, Li, Xue, Yin and Li. This is an open-access article distributed under the terms of the Creative Commons Attribution License (CC BY). The use, distribution or reproduction in other forums is permitted, provided the original author(s) and the copyright owner(s) are credited and that the original publication in this journal is cited, in accordance with accepted academic practice. No use, distribution or reproduction is permitted which does not comply with these terms.
*Correspondence: Decai Li, bGlkZWNhaUBtYWlsLnRzaW5naHVhLmVkdS5jbg==
Disclaimer: All claims expressed in this article are solely those of the authors and do not necessarily represent those of their affiliated organizations, or those of the publisher, the editors and the reviewers. Any product that may be evaluated in this article or claim that may be made by its manufacturer is not guaranteed or endorsed by the publisher.
Research integrity at Frontiers
Learn more about the work of our research integrity team to safeguard the quality of each article we publish.