
95% of researchers rate our articles as excellent or good
Learn more about the work of our research integrity team to safeguard the quality of each article we publish.
Find out more
ORIGINAL RESEARCH article
Front. Mater. , 02 September 2022
Sec. Ceramics and Glass
Volume 9 - 2022 | https://doi.org/10.3389/fmats.2022.954110
This article is part of the Research Topic Innovators in Ceramics and Glass View all 7 articles
 Yusuke Kubo1
 Naoki Ishimatsu1*
 Naoto Kitamura2Naomi Kawamura3Sho Kakizawa3Masaichiro Mizumaki3Ryuichi Nomura4Tetsuo Irifune5Hitoshi Sumiya6
Reverse Monte Carlo (RMC) calculation was performed to visualize the atomic arrangement in a disordered Fe55Ni45 alloy, which is classified as an intermediate structure between the non-crystalline glass and crystalline structures. The optimized structure of the ferromagnetic phase at low pressures revealed that Fe and Ni atoms were displaced from a perfect fcc lattice to elongate the nearest neighboring Fe-Fe atomic pairs, therefore, Fe-Fe atomic pairs have longer bond length than Fe-Ni and Ni-Ni atomic pairs. Because the elongation becomes negligible during the pressure-induced destabilization of the ferromagnetic state, the elongation of Fe-Fe pairs is the atomic scale origin of the volume expansion due to a large magnetovolume effect. Compared with the atomic arrangement in the Fe65Ni35 Invar alloy, a relationship between Fe-Fe atomic pairs, the Invar effect and elastic anomalies in the compression curve is elucidated.
The atomic arrangement in disordered alloys is classified as an intermediate structure between the non-crystalline glass and crystalline structures, because different metal atoms randomly occupy the lattice accompanied by small displacements from the periodic positions. Therefore, it has been difficult to investigate the atomic arrangement of disordered alloy. However, reverse Monte Carlo (RMC) calculation with complementary data sets of extended X-ray absorption fine structure (EXAFS) and X-ray diffraction (XRD) is a useful method to visualize the atomic arrangement in disordered alloys.
Ferromagnetic Fe-Ni disordered alloy is a suitable material to investigate the distortion of atomic arrangements by the magnetovolume effect (Yokoyama and Eguchi, 2011; Kousa et al., 2020; Yokoyama, 2021). The large magnetovolume effect of Fe-Ni alloys compresses the lattice with increasing temperature, which offsets normal thermal expansion and leads to the zero thermal expansion. This is known as the Invar effect. Disordered Fe65Ni35 is a well-known Invar alloy that exhibits zero thermal expansion in a wide temperature range up to the Curie temperature, TC ≈ 505 K, at ambient pressure (Guillaume and Seances, 1897). We have previously examined the compressibility of Fe-Fe, Fe-Ni, and Ni-Ni atomic pairs in the Invar alloy using RMC calculations, revealing elongation of Fe-Fe atomic pairs compared with the other two atomic pairs (Ishimatsu et al., 2021). Because the elongation disappears with the pressure-induced transition to the paramagnetic phase, we concluded that the magnetovolume effect is due to the elongation of Fe-Fe atomic pairs.
To systematically discuss the relationship between Fe-Fe atomic pairs and the Invar effect, herein we performed a similar analysis on a Ni-rich alloy of Fe55Ni45, known as a pressure-induced Invar alloy, and compared the results with those of the Fe65Ni35 Invar alloy. Fe-Ni alloys recover normal thermal expansion with a slight increase in the Ni content from 35 at.%, but the pressure-induced Invar effect occurs at a characteristic pressure. According to a report by Dubrovinsky et al. (Dubrovinsky et al., 2001), Fe55Ni45 undergoes the pressure-induced Invar effect at
Polycrystalline Fe55Ni45 non-Invar alloys were grained from ingots and pelletized for the EXAFS and XRD measurements. The pressure dependences of EXAFS and XRD were independently measured on beamline 39XU at SPring-8 (Kawamura et al., 2009) using a fresh (uncompressed) pellet. We utilized diamond anvil cells to apply pressure to the sample. The applied pressure was monitored using the conventional ruby fluorescence method. Nano-polycrystalline diamond anvils were utilized for the EXAFS measurement to prevent Bragg diffraction from the anvil crystals superimposed on the absorption profile (Irifune et al., 2003; Ishimatsu et al., 2012, 2016). A Fluorinert 70 + 77 solution was used as a pressure transmitting medium. All the measurements were performed at room temperature.
The software RMCProfile was used to carry out the RMC calculations (Krayzman et al., 2008). A cluster structure, which reproduces the experimental results of both EXAFS and XRD, was found by RMC calculation. By using conventional EXAFS analysis, element-dependent differences in the local structure have been reported (Yokoyama and Eguchi, 2011; Kousa et al., 2020; Yokoyama, 2021). However, it is typically difficult to distinguish the neighboring atoms to the X-ray absorbing atoms by conventional EXAFS analysis, because metal elements with close atomic numbers, such as Fe and Ni, give comparable scattering amplitudes of the photoelectrons. In contrast, the RMC calculation constructs and optimizes the best model of the atomic cluster that matches the experimental EXAFS profiles at multiple absorption edges via trial-and-error iterations. RMCProfile is suitable for this purpose, because it allows for the input of a dataset of EXAFS spectra at the Fe and Ni K-edges together with XRD patterns. A cluster of randomly distributed 2201 Fe and 1799 Ni atoms to a 10 × 10 × 10 fcc unit cell was used as the starting structure. In our calculation, atom swapping was not allowed. Therefore, long-range disorder was unchanged during the calculation. The minimum atomic separation was set to 1.8 Å. Each RMC calculation was performed for 720 min. Although the calculation time depends on the computer power, we judged that this time was sufficient to achieve convergence by monitoring the residual of the fitting. All single scattering paths calculated by the FEFF85L code were used in the EXAFS part of the RMC optimization. Furthermore, chainlike multiple scattering paths, which give significant intensities comparable to those of the single scattering paths, were also included in our model. The RMC calculation was performed three times, and the averaged result was used for the discussion.
The calculated profiles are in good agreement with both EXAFS and XRD experimental data, as shown in Figure 1. The good reproducibility allows us to investigate how the distorted local structure coexists with the long-range periodicity in the calculated atomic cluster. The absolute values of Fourier transformed (FT) profiles (|FT [k2χ(k)]|) increase with increasing pressure at both the Fe and Ni K-edges, indicating that Debye-Waller factor decreases with the volume compression (Figures 1A, B). The prominent peak at radial distance R = 2.1–2.2 Å, which corresponds to the first nearest neighboring (1NN) 12 Fe/Ni atoms of the X-ray absorbing atom, shows significant enhancement of the peak intensity with increasing pressure. This trend was well reproduced by the RMC calculation in a wide range of R (up to 6 Å).
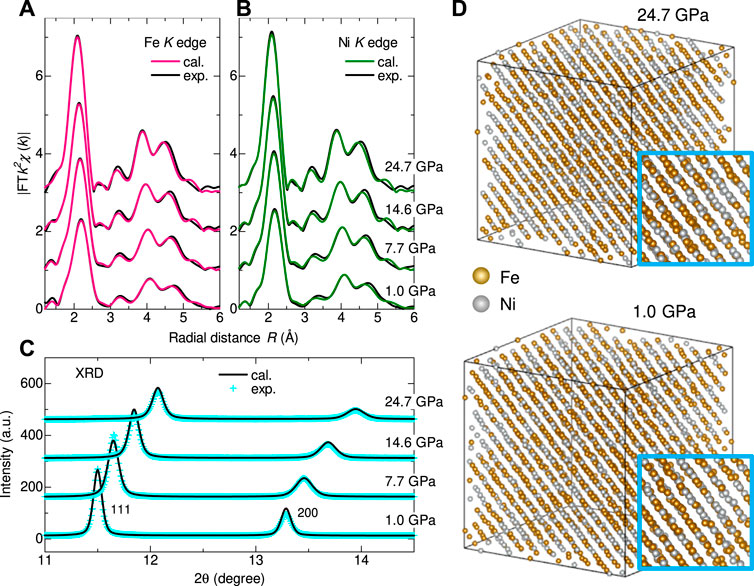
FIGURE 1. Comparison of the experimental profiles with fits by the RMC calculations. Absolute values of the |FT [k2χ(k)]| profiles of Fe55Ni45 non-Invar at (A) Fe K-edge and (B) Ni K-edges. (C) X-ray diffraction patterns at selected pressures. (D) Atomic arrangements of the Fe55Ni45 alloy obtained by the RMC calculation viewed from the
Experimental XRD patterns at selected pressures are compared with the calculated profiles in Figure 1C. The pressure dependence of the 111 and 200 Bragg peaks were chosen for our XRD measurements using a flat panel with a limited window size of 50 × 50 mm2. The RMC calculations successfully reproduced the appearance of 111 and 200 Bragg peaks. As shown in Figure 1D, the calculated atomic cluster conserves the sequential stacking of the atomic planes, although the atoms are displaced from the ideal positions of the fcc lattice. Therefore, the RMC calculations found a structure, in which the local structure was largely distorted; however, the disordered atomic cluster maintained the long-range periodicity to satisfy the Bragg law owing to pseudo fcc symmetry.
Figure 2A shows the partial pair distribution functions gij(R), where i, j = Fe or Ni, in the range of R = 1.8 Å to 6 Å corresponding to the histogram of the first to fifth nearest neighboring (1NN–5NN) Fe-Fe, Fe-Ni and Ni-Ni atomic pairs at selected pressures. The gij(R) function is normalized to approach unity with increasing R (Keen, 2001). In Figure 2A, the cross marks represent the lengths of atomic pairs expected from the lattice constant of a cluster with fcc symmetry, revealing small deviations. Moreover, the broad gij(R) profile around the expected peak positions indicates the displacements of Fe/Ni atoms from the fcc lattice positions.
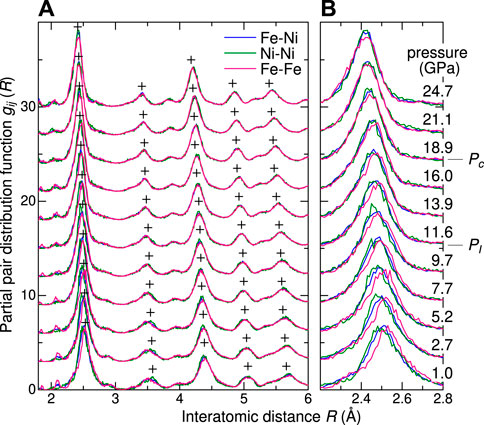
FIGURE 2. (A) Partial pair distribution functions gij(R), where i, j = Fe or Ni, for the Fe55Ni45 alloy at selected pressures. The cross marks indicate the lengths expected from the lattice constant of fcc structure. (B) Enlarged plot of gij(R) around the first nearest neighboring Fe-Fe and Fe-Ni and Ni-Ni atomic pairs.
A noted result of gij(R) is the elongation of 1NN Fe-Fe pairs in comparison with 1NN Fe-Ni and Ni-Ni pairs. To highlight the elongation, an enlarged plot of gij(R) profiles around the 1NN peak is shown in Figure 2B. Compared to the profiles of gFe-Ni(R) and gNi-Ni(R) at 1.0 GPa, the peak and whole profile of gFe-Fe(R) around the 1NN Fe-Fe pairs shift to the longer R direction. As the pressure increases, the shift of the gFe-Fe(R) gradually decreases, and the gij(R) profiles of Fe-Fe, Fe-Ni and Ni-Ni pairs are located at the same positions at pressures above 18.9 GPa. The elongation and pressure-induced shrinkage of the Fe-Fe pairs have also been observed in the gij(R) profiles of Invar alloys (Ishimatsu et al., 2021).
To investigate the elongation of the Fe-Fe atomic pairs quantitatively, average lengths of the 1NN atomic pairs, RFe-Fe, RFe-Ni, and RNi-Ni were evaluated. Gaussian fitting was performed within a range of 2.2 Å
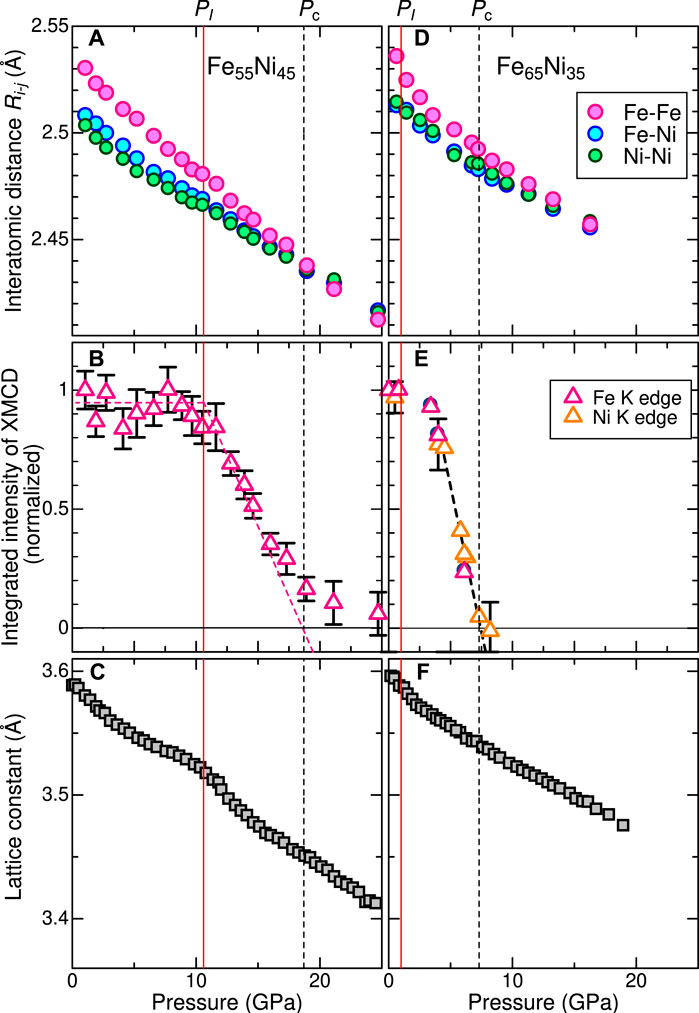
FIGURE 3. Comparison of the results between Fe55Ni45 non-Invar alloy and Fe65Ni35 Invar alloy as a function of pressure: (A, D) Average lengths of Rij fitted within a range of 0.6 Å centered on the 1NN peaks of Fe-Fe, Fe-Ni, and Ni-Ni pairs. (B, E) Integrated intensity of X-ray magnetic circular dichroism (XMCD). (C, F) Compression curves determined by XRD. The vertical solid and dashed lines represent characteristic pressures PI and Pc.
Figure 3A shows that RFe-Fe is longer than RFe-Ni and RNi-Ni in the low-pressure region. The evaluated bond lengths are 2.536, 2.513, and 2.515 Å for Fe-Fe, Fe-Ni, and Ni-Ni pairs, respectively, at 1.0 GPa. The magnitude of the elongation for the RFe-Fe is estimated to be approximately 0.021–0.023 Å, which is comparable to that of Invar alloy (
The integrated XMCD at the K-edge corresponds to the 4p orbital moment (Igarashi and Hirai, 1994; Torchio et al., 2011). Because the 4p orbital moment is induced by the net magnetization, the integrated XMCD allows for the investigation of the pressure dependence of the magnetization. As shown in Figures 3B, E, both alloys undergo a phase transition from the ferromagnetic to the paramagnetic phase with increasing pressure. The vertical lines indicate the characteristic pressures labeled PI and Pc, where the magnetization starts to decrease and becomes nearly zero, respectively. At pressures above Pc, the magnetic structure enters a paramagnetic phase. Fe55Ni45 alloy exhibits higher pressures (PI ≈ 10.6 GPa and Pc ≈ 18.7 GPa) than the Fe65Ni35 alloy (PI ≈ 1 GPa and Pc ≈ 7 GPa), indicating that the ferromagnetic order in Fe55Ni45 is more stable under pressure. This trend is consistent with the
In Invar alloys, the destabilized ferromagnetic structure leads to a rapid shrinkage of RFe-Fe due to the pressure-induced loss of the magnetovolume effect above PI ≈ 1 GPa. Similar elastic anomalies of softening and shrinkage of RFe-Fe have also been observed for Fe55Ni45. Fe55Ni45 is characterized by the wide pressure range of the pressure-independent ferromagnetic state below PI. The broader pressure range of the stable ferromagnetic state enables us to understand the correlation between the magnetic instability, elongation of Fe-Fe atomic pairs and the softening behavior.
Interestingly, the elongation rate of RFe-Fe remains unchanged in the wide pressure region below PI, and then a rapid contraction of the RFe-Fe occurs accompanied by the destabilization of the ferromagnetic state in a pressure range of PI ≤ P ≤ Pc. As mentioned above, the maximum elongation of RFe-Fe is comparable to that exhibited by the Invar alloy. Thus, a large magnetovolume effect commonly works in the ferromagnetic phase of Fe-Ni alloys below PI, and a similar interpretation of the elongation of RFe-Fe can be given to this alloy as well as Fe65Ni35 Invar alloy. Therefore, although we did not measure temperature dependences, we expect that Fe55Ni45 alloy exhibits a pressure-induced Invar effect at pressures near PI, where a rapid contraction of RFe-Fe occurs. It is noted that the softening behavior of Fe55Ni45 is observed at a pressure that is
Finally, to confirm the validity of the element-dependent elongation, the expected value, ⟨Rij⟩, was evaluated by using the equation:
where parameters R1 and R2 define the lower and upper limits of integration, respectively, and ρj is the number of j atoms in a unit volume. An advantage of the expected value is to minimize the effects from the asymmetric real space function. We used a wide integration range from R1 = 1.8 Å to R2 ≈ 3.1 Å ensuring inclusion of all 12 Fe/Ni atoms in the first shell of the fcc lattice. This range is wide enough to avoid ambiguities due to the integration range. The obtained pressure dependence of ⟨Rij⟩ is plotted in Figure 4. Although the elongation of the Fe-Fe bond is reproduced, it is a factor of one quarter smaller than the result of the Gaussian fit (Figure 3A). This is because the integration range includes not only main 1NN peak but also small humps and a moderate slope at both sides of the peak. However, we note that a similar trend is observed in the pressure dependence of the elongation: the elongation starts to decrease at pressures above PI, and the lengths of three bond become comparable above Pc.
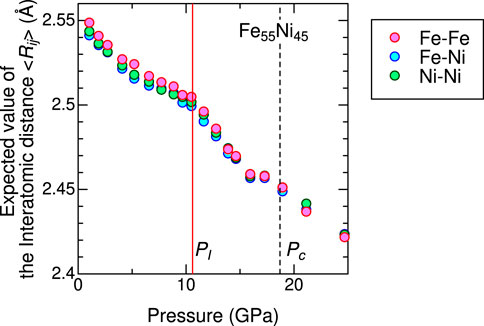
FIGURE 4. Pressure dependence of the expected values ⟨Rij⟩ as the average length of 1NN bonds integrated within the entire first shell. Details are described in the text.
We successfully visualized the atomic arrangement of the disordered Fe55Ni45 alloy using the RMC calculation with the datasets of EXAFS and XRD measurements. The gij(R) profile was evaluated from the visualized atomic cluster, which showed that Fe and Ni atoms were displaced from a perfect fcc lattice, while the element-dependent distribution of the atomic bond length revealed an elongation of Fe-Fe pairs in the ferromagnetic phase at low pressures. Similar to the interpretation proposed for the Fe65Ni35 Invar alloy, the elongation of Fe-Fe pairs is the atomic scale origin of the volume expansion due to a large magnetovolume effect. The elongation becomes negligible upon the pressure-induced destabilization of the ferromagnetic state and softening behavior in the compression curve. Therefore, a strong correlation between the elongation of Fe-Fe atomic pairs, magnetization, and elastic anomalies has been clearly demonstrated. We note that the visualization procedure using RMC calculations can be employed to solve various problems of alloys such as the composition dependence of elastic anomalies, magnetism, and hydrogen embrittlement.
All data supporting this study within the article are available from the corresponding author upon reasonable request.
NI, YK, and NKi designed the research and performed the RMC calculations; NI, NKa, MM. SK, and RN performed EXAFS and XRD measurements. TI and HS manufactured nano-diamond anvils; NI and YK wrote the paper. All other authors helped in writing the paper.
The studies presented herein were partially supported by a Grant-in-Aid for Scientific Research on Innovative Areas (Grant Number 15H05829), Grant-in-Aid for Transformative Research Areas (A) “Hyper-Ordered Structures Science” (Grant Numbers 20H05880 and 21H05567), and KAKENHI (Grant Numbers 17K05518 and 21H01043).
The X-ray absorption measurements were performed at SPring-8 with the approval of PRC-JASRI (Nos. 2017B1304, 2017B1974, 2018B1355, 2019A1530, and 2021A1434).
The authors declare that the research was conducted in the absence of any commercial or financial relationships that could be construed as a potential conflict of interest.
All claims expressed in this article are solely those of the authors and do not necessarily represent those of their affiliated organizations, or those of the publisher, the editors and the reviewers. Any product that may be evaluated in this article, or claim that may be made by its manufacturer, is not guaranteed or endorsed by the publisher.
Dubrovinsky, L., Dubrovinskaia, N., Abrikosov, I. A., Vennström, M., Westman, F., Carlson, S., et al. (2001). Pressure-induced invar effect in fe-ni alloys. Phys. Rev. Lett. 86, 4851–4854. doi:10.1103/PhysRevLett.86.4851
Hayase, M., Shiga, M., and Nakamura, Y. (1973). Spontaneous volume magnetostriction and lattice constant of face-centered cubic fe-ni and ni-cu alloys. J. Phys. Soc. Jpn. 34, 925–933. doi:10.1143/JPSJ.34.925
Igarashi, J.-i., and Hirai, K. (1994). Magnetic circular dichroism at the k edge of nickel and iron. Phys. Rev. B 50, 17820–17829. doi:10.1103/PhysRevB.50.17820
Irifune, T., Kurio, A., Sakamoto, S., Inoue, T., and Sumiya, H. (2003). Materials: Ultrahard polycrystalline diamond from graphite. Nature 421, 599–600. doi:10.1038/421599b
Ishimatsu, N., Iwasaki, S., Kousa, M., Kato, S., Nakajima, N., Kitamura, N., et al. (2021). Elongation of fe-fe atomic pairs in the invar alloy fe65ni35. Phys. Rev. B 103, L220102. doi:10.1103/PhysRevB.103.L220102
Ishimatsu, N., Kawamura, N., Mizumaki, M., Maruyama, H., Sumiya, H., Irifune, T., et al. (2016). Applications of nano-polycrystalline diamond anvils to x-ray absorption spectroscopy under high pressure. High. Press. Res. 36, 381–390. doi:10.1080/08957959.2016.1205048
Ishimatsu, N., Matsumoto, K., Maruyama, H., Kawamura, N., Mizumaki, M., Sumiya, H., et al. (2012). Glitch-free X-ray absorption spectrum under high pressure obtained using nano-polycrystalline diamond anvils. J. Synchrotron Radiat. 19, 768–772. doi:10.1107/S0909049512026088
Kawamura, N., Ishimatsu, N., and Maruyama, H. (2009). X-Ray magnetic spectroscopy at high pressure: Performance of SPring-8 BL39XU. J. Synchrotron Radiat. 16, 730–736. doi:10.1107/S0909049509034700
Keen, D. A. (2001). A comparison of various commonly used correlation functions for describing total scattering. J. Appl. Crystallogr. 34, 172–177. doi:10.1107/S0021889800019993
Kousa, M., Iwasaki, S., Ishimatsu, N., Kawamura, N., Nomura, R., Kakizawa, S., et al. (2020). Element-selective elastic properties of fe65ni35 invar alloy and fe72pt28 alloy studied by extended x-ray absorption fine structure. High. Press. Res. 40, 130–139. doi:10.1080/08957959.2019.1702175
Krayzman, V., Levin, I., and Tucker, M. G. (2008). Simultaneous reverse Monte Carlo refinements of local structures in perovskite solid solutions using EXAFS and the total scattering pair-distribution function. J. Appl. Crystallogr. 41, 705–714. doi:10.1107/S0021889808013277
Torchio, R., Kvashnin, Y. O., Pascarelli, S., Mathon, O., Marini, C., Genovese, L., et al. (2011). X-ray magnetic circular dichroism measurements in ni up to 200 gpa: Resistant ferromagnetism. Phys. Rev. Lett. 107, 237202. doi:10.1103/PhysRevLett.107.237202
van Schilfgaarde, M., Abrikosov, I., and Johansson, B. (1999). Origin of the invar effect in iron–nickel alloys. Nature 400, 46–49. doi:10.1038/21848
Yokoyama, T., and Eguchi, K. (2011). Anharmonicity and quantum effects in thermal expansion of an invar alloy. Phys. Rev. Lett. 107, 065901. doi:10.1103/PhysRevLett.107.065901
Keywords: reverse Monte Carlo (RMC) calculation, EXAFS, Fe-Ni alloy, Invar effect, mangetovolume effect
Citation: Kubo Y, Ishimatsu N, Kitamura N, Kawamura N, Kakizawa S, Mizumaki M, Nomura R, Irifune T and Sumiya H (2022) Visualization of the disordered structure of Fe-Ni Invar alloys by reverse monte carlo calculations. Front. Mater. 9:954110. doi: 10.3389/fmats.2022.954110
Received: 27 May 2022; Accepted: 01 July 2022;
Published: 02 September 2022.
Edited by:
Shinji Kohara, National Institute for Materials Science, JapanReviewed by:
Haofei Zhou, Zhejiang University, ChinaCopyright © 2022 Kubo, Ishimatsu, Kitamura, Kawamura, Kakizawa, Mizumaki, Nomura, Irifune and Sumiya. This is an open-access article distributed under the terms of the Creative Commons Attribution License (CC BY). The use, distribution or reproduction in other forums is permitted, provided the original author(s) and the copyright owner(s) are credited and that the original publication in this journal is cited, in accordance with accepted academic practice. No use, distribution or reproduction is permitted which does not comply with these terms.
*Correspondence: Naoki Ishimatsu, aXNoaW1hdHN1bmFva2lAaGlyb3NoaW1hLXUuYWMuanA=
Disclaimer: All claims expressed in this article are solely those of the authors and do not necessarily represent those of their affiliated organizations, or those of the publisher, the editors and the reviewers. Any product that may be evaluated in this article or claim that may be made by its manufacturer is not guaranteed or endorsed by the publisher.
Research integrity at Frontiers
Learn more about the work of our research integrity team to safeguard the quality of each article we publish.