 Stefan Karlsson1*
 Renny Mathew2
 Sharafat Ali3Mart Paemurru4Johan Anton4
 Baltzar Stevensson2
 Mattias Edén2*
- 1Glass Unit, Department of Building and Real Estate, Division of Built Environment, RISE Research Institutes of Sweden, Växjö, Sweden
- 2Department of Materials and Environmental Chemistry, Stockholm University, Stockholm, Sweden
- 3Department of Built Environment and Energy Technology, Linnaeus University, Växjö, Sweden
- 4GlasStress Ltd., Tallinn, Estonia
For a series of conventional soda-lime-silicate glasses with increasing Al2O3 content, we investigated the thermal, mechanical, and structural properties before and after K+-for-Na+ ion-exchange strengthening by exposure to molten KNO3. The Al-for-Si replacement resulted in increased glass network polymerization and lowered compactness. The glass transition temperature (Tg), hardness (H) and reduced elastic modulus (Er), of the pristine glasses enhanced monotonically for increasing Al2O3 content. H and Er increased linearly up to a glass composition with roughly equal stoichiometric amounts of Na2O and Al2O3 where a nonlinear dependence on Al2O3 was observed, whereas H and Er of the chemically strengthened (CS) glasses revealed a strictly linear dependence. Tg, on the other hand, showed linear increase with Al-for-Si for pristine glasses while for the CS glasses a linear to nonlinear trend was observed. Solid-state 27Al nuclear magnetic resonance (NMR) revealed the sole presence of AlO4 groups in both the pristine and CS glasses. 23Na NMR and wet-chemical analysis manifested that all Al-bearing glasses had a lower and near-constant K+-for-Na+ ion exchange ratio than the soda-lime-silicate glass. Differential thermal analysis of CS glasses revealed a “blurred” glass transition temperature (Tg) and an exothermic step below Tg; the latter stems from the relaxation of residual compressive stresses. The nanoindentation-derived hardness at low loads and <5 mol% Al2O3 showed evidence of stress relaxation for prolonged ion exchange treatment. The crack resistance is maximized for molar ratios n(M(2)O)/n(Al2O3)
1 Introduction
The readily tuned properties of glasses render them immensely useful for numerous applications (Shelby, 2005; Axinte, 2011; Zanotto and Mauro, 2017). However, a high brittleness is one disadvantage with glass (Hand and Tadjiev, 2010; Wondraczek et al., 2011), which is typically mitigated by increasing the glass thickness in many applications. Besides improved recycling procedures (Carr and Kim, 2017), a more sustainable utilization of thinner but stronger glasses reduces the amount of raw materials as well as the transportation costs of both precursors and products. There are several options for improvements, such as strengthening the glass and increasing its crack resistance (Wondraczek et al., 2011; Januchta et al., 2017; Karlsson and Wondraczek, 2021). For instance, the glass strength can be improved either by protective coatings or by introducing residual compressive stress (RCS) at the surface (Musil et al., 2002; Karlsson et al., 2010; Wondraczek et al., 2011; Varshneya et al., 2022). RCS may be implemented either by a conventional thermal tempering or by chemical strengthening (Wondraczek et al., 2011; Gross, 2019; Karlsson and Wondraczek, 2021).
Chemical strengthening is often referred to as ion-exchange strengthening because it typically involves replacing small (alkali metal) cation species by larger ones introduced from a molten salt (Wondraczek et al., 2011; Gross, 2019; Karlsson and Wondraczek, 2021), such as Li+ or Na+ substitutions by K+. The cation size-mismatch induces compressive stresses in the glass structure, which are subsequently relieved by a rapid relaxation process followed by a slower viscosity-dependent one (Varshneya, 2016; Macrelli et al., 2019). Therefore, the ion-exchange strengthening process is performed at a temperature around or below the strain point (a glass viscosity fixpoint, log10 η = 14.5 dPa s). Some chemical strengthening procedures involve multiple consecutive ion-exchange processes, which are beneficial for producing an engineered stress profile (ESP) with a controlled RCS profile in the surface (Green et al., 1999). Chemically strengthened (CS) glasses are nowadays widely used for flat-screen covers in handheld electronic devices (Varshneya and Bihuniak, 2018), pharmaceutical cartridges (Morandotti and Zuccato, 2018), and for impact-resistant front windows in high-speed trains, aircrafts, and high-security windows (Sheikh et al., 2020); their utilization is expected to expand to various architectural (Zaccaria et al., 2021), automotive (Jacoby, 2018), solar (Allsopp et al., 2020), and flexible photonics (Macrelli et al., 2020) purposes.
Current CS glasses conform to the aluminosilicate (AS) or aluminoborosilicate glass systems (Gross, 2019; Karlsson and Wondraczek, 2021). Such “high-performance” CS glasses often incorporate large amounts of Al, which increase both the melting temperature and the melt viscosity (Silverman, 1939; Cheng et al., 2013; Karlsson, 2021), and thereby making the glasses comparatively costly to produce. The melt viscosity is maximized around a unity molar ratio of the metal oxide to alumina (Toplis et al., 1997; Webb et al., 2007), n(M(2)O)/n(Al2 O 3) = 1 [henceforth referred to as “M(2)O/Al2O3”]. Conventional soda-lime-silicate (SLS) glasses are in general unsuitable for chemical strengthening because they suffer from higher stress relaxation than high performance AS glasses (Varshneya and Kreski, 2012; Erdem et al., 2017; Güzel et al., 2019; Macrelli et al., 2019; Sun and Dugnani, 2020). Nonetheless, given that SLS glasses dominate the industrial market (Hand and Tadjiev, 2010; Deng et al., 2020), their minor doping with Al is a promising route towards an optimal balance between high chemical strengthening performance and lower production costs, and thereby more sustainable glasses (Wallenberger and Bingham, 2010; LaCourse, 2018).
To reach these goals, the structure of the glass and its properties must be contrasted before and after the chemical strengthening process. To explore and improve the understanding of the complex chemical strengthening mechanisms (Varshneya, 2010a; Macrelli et al., 2019; Karlsson and Wondraczek, 2021), we report herein on effects from K+-for-Na+ cation exchange on physical properties and local structures of the industrially relevant compositions 16Na2O–12CaO–xAl2O3–(72–x)SiO2 for increasing Al contents (x mol%). For both the pristine and ion-exchanged glasses, we discuss the trends of the glass transition temperature (Tg), the density (ρ) and its related molar volume (Vm) and atom packing density (compactness; Cg), crack resistance (CR) along with the nanoindentation-derived values of the hardness (H) and reduced elastic modulus (Er). The degrees of K+-for-Na+ ion exchange was estimated by 23Na magic-angle spinning (MAS) nuclear magnetic resonance (NMR) experiments. The Al speciation was probed by 27Al MAS NMR, which revealed that all structures comprised essentially only [AlO4]− groups, regardless of the application of chemical strengthening.
2 Materials and methods
2.1 Glass preparation and composition analysis
Six glass samples were prepared with nominal compositions 16Na2O–12CaO–xAl2O3–(72–x)SiO2 with x = {0, 4, 8, 12, 16, 20} mol%; see Table 1. The glasses were melted in 200 g glass batches in Pt-Rh crucibles at 1500°C for x = {0, 4, 8} and 1600°C for x = {12, 16, 20} using Na2SO4 as a fining agent. The melts were quenched on a steel plate before being annealed at their respective calculated glass transition temperature. Full details of the glass sample preparation are given in ref. (Karlsson, 2021).
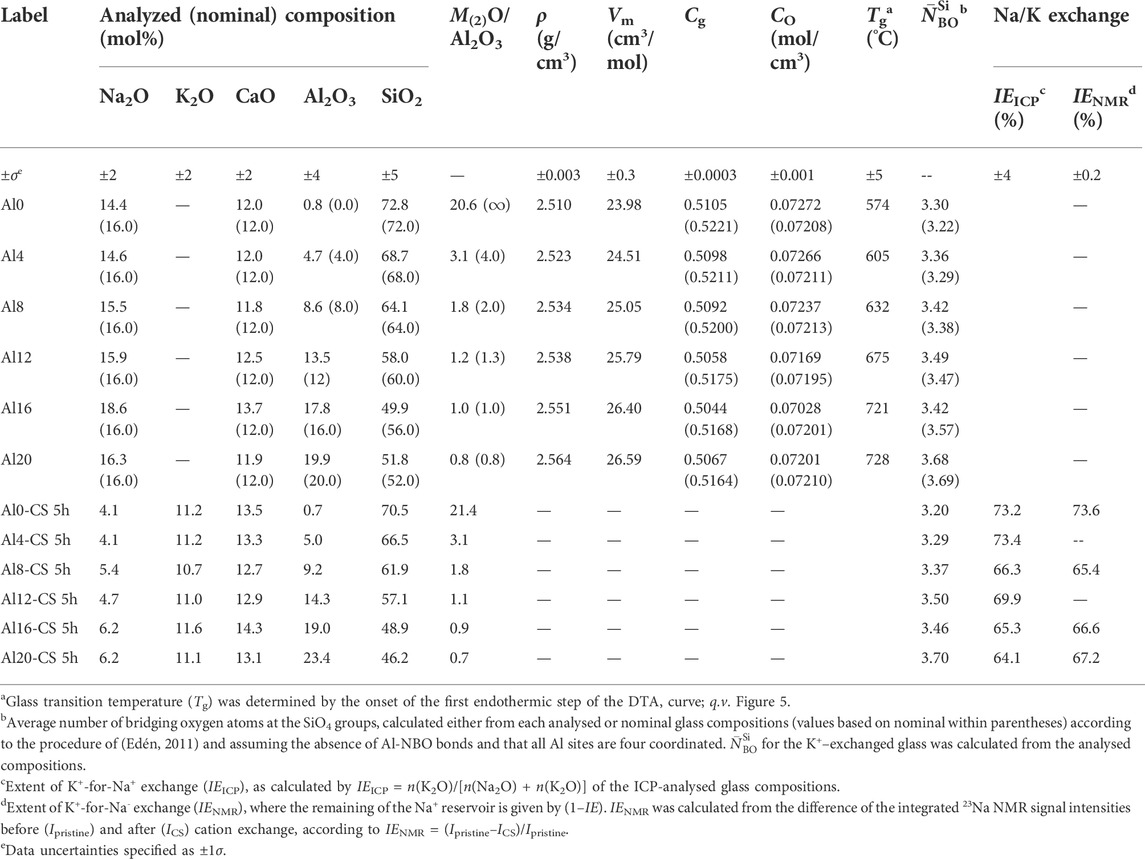
TABLE 1. Analyzed and nominal glass compositions (in brackets), density (ρ), molar volume (Vm), compactness (Cg), oxygen packing density (CO), glass transition temperature (Tg), average network connectivity (
Parts of the prepared glass were crushed on a steel plate using a steel hammer and then powdered using a mill from Retsch (model RM200) equipped with an agate mortar and pestle. The powdered glasses were sieved into two fractions, <45 µm and <90 μm, using steel sieves and a Retsch interval shaking table (model RV).
The glass compositions were determined by inductively coupled plasma optical emission spectroscopy (ICP OES) with an Aviro 200 instrument (Perkin Elmer). For each glass sample, 0.5 g of powdered material was dissolved in 15 ml 48% HF, 1 ml H2SO4 (95%–97%) and 0.5 ml HNO3 (65%) altogether diluted to 50 ml using deionized water. The solution was evaporated, and the residual oxides were dissolved in 10 and 30 ml HCl and deionized H2O respectively under mild heating on a hot plate for 60 min (occasionally deionized H2O was added to replace evaporated H2O). The solution was next transferred to a 250 ml beaker and 150 ml of deionized H2O was added, whereupon the solution was evaporated to a volume of
2.2 Chemical strengthening
2.2.1 Glass powders
About 35 g of reagent grade KNO3 salt (ACROS Organics; 99% purity) and 5 g of the <45 µm sieved glass powder, q.v., Section 2.1, were heated to 450°C in separate fused quartz crucibles in a Nabertherm muffle furnace (model N2OH). The glass powder was then put into the molten KNO3 and was stirred. One more stirring was performed after 2.5 h. After 5 h, the crucibles were taken out from the furnace and left to cool to ambient temperature on a refractory brick. Deionized water was added under magnetic stirring to dissolve the KNO3, whereafter, the glass powder was separated from the aqueous solution using a Munktell 3-grade filter paper and a Büchner funnel.
2.2.2 Glass monoliths
For each prepared glass sample, two glass monoliths of approximate size 2 × 2 × 2 cm were cut out by a diamond saw. The glasses were polished in the Struers LaboForce100 equipment using the pertinent sample holder fixated by the UniForce equipment. SiC #320 sheets (MD Gekko) were used for rough polishing before fine polishing by the sheets MD Plan, MD Dac and MD Nap (in that order) with their corresponding polishing solutions. The samples were cleaned using Struers Lavamin equipment between the polishing steps.
The polished glass pieces were then subjected to ion-exchange strengthening in a Hybe muffle furnace (model KUT180) at 450°C. The glass pieces were heated in a wire net basket separately to a stainless-steel container with the salt. The salt bath consisted of 99% purity KNO3 from ACROS Organics. The salt bath was first melted at 450°C before the basket with the glass pieces was put inside for 5 and 16 h. The basket was then taken out and the furnace was turned off with the door left a little open so that the cooling rate was ca. 3–5°C/min. The salt bath temperature was controlled to be within ±5°C to the target using a thermocouple of type K using a P655 logger from Dustmann Electronic GmbH. The treatment temperature, 450°C, was chosen specifically to give some stress relaxation (Svenson et al., 2016). The glass series from these treatments are called Al-CS 5 h and Al-CS 16 h.
2.3 Glass characterization
2.3.1 Solid state nuclear magnetic resonance experiments and data analysis
All 2³Na (spin 3/2) and 2⁷Al (spin 5/2) solid-state NMR experiments were performed with a Bruker Avance-III spectrometer at a magnetic field of 14.1 T, which provided the Larmor frequency of −158.7 MHz for 2³Na and −156.4 MHz for 2⁷Al. A fine powder (<10 µm particles) of each glass specimen was filled in a 3.2 mm zirconia rotor that underwent magic-angle spinning (MAS) at 24.00 kHz. To obtain NMR spectra that quantitative reflect the site populations (Edén, 2020), short radio-frequency (rf) pulses were employed: 0.40 μs (12° flip angle; 83 kHz nutation frequency) for 2³Na, and 0.32 μs (10° flip angle; 87 kHz nutation frequency) for 2⁷Al. The relaxation delays were 5 s (2³Na) and 2 s (2⁷Al), with 2024–10240 and 4048–8192 signal transients accumulated per 2³Na and 2⁷Al NMR acquisition, respectively, with the precise number depending on the Na and Al content of the glass. 2³Na and 2⁷Al shifts are quoted relative to 0.1 M NaCl(aq) and 1.0 M Al(NO₃)₃(aq), respectively.
Iterative numerical fitting of the MAS NMR spectra were used for determining the average values of the isotropic chemical shift,
where
The numerically exact simulations accounted for both first- and second-order quadrupolar interactions. The carousel-averaging COMPUTE algorithm (Levitt and Edén, 1998) was employed to efficiently exploit the time periodicity and for analytical averaging over the “γ” Euler angle, which together with a ROSELEBhemi18817 set of {α, β} orientations (Stevensson and Edén, 2006) ensured a fully converged powder average. The smallest time-integration step in the solution of the Schrödinger equation was 81 ns. The initial density and detection operators were ρ(t = 0) = Ix and I+, respectively.
2.3.2 Scattered light polariscope experiments
The surface RCS of the CS glass monoliths, σs, were determined using SCALP-05, a scattered light polariscope equipment from GlasStress Ltd. It is a well-described method to determine RCS in glass, see (Hödemann et al., 2016; Sun et al., 2019; Hödemann et al., 2020). The measurement depth was 0.75 mm, the stress optic coefficient (ΔC) was assumed to be constant, ΔC = 2.72 TPa−1, and the refractive index (RI) was assumed to be 1.52 for x = {0, 4, 8, 12} and 1.53 for x = {16, 20} where x is the Al2O3 content; q.v., Section 2.1, and Table 1. The glass monoliths were cleaned with conventional window cleaning solution and dried clean with a wipe. A thin layer of Cargille immersion oil (liquid code 5040, RI = 1.5200 at 632.8 nm) was sprayed onto the sample. Three repeated measurements were performed for each sample and the average value was used. The stress was calculated from the gradient of the fitted optical retardation curve which starts from two to three pixels into the sample, i.e., ca. 10 µm, hence the errors of the determined stresses are estimated to be ±30%. In fact, σs is rarely overestimated with SCALP-05 (only for ultra-high σs) but for simplicity the error is displayed as both under- and overestimation.
2.3.3 Simultaneous thermal analysis experiments
The <45 µm glass powder (q.v., Section 2.1) and the CS glass powder (q.v., Section 2.2.1) were run in a simultaneous thermal analysis (STA), NETSZCH STA 409 PC/PG. Both the differential thermal analysis (DTA) and thermal gravimetric analysis (TGA) signals were recorded. Al2O3 crucibles were used for the measurements that were run under N2-gas flow. The heating rate was 10 K/min up to 1200°C. An empty crucible was used for baseline correction. The glass transition temperature (Tg) was determined by using the Proteus software provided by NETSZCH using standard procedure where each Tg value was determined from the onset of the first endothermic step of the DTA curve (Zheng et al., 2019). The TGA analyses of the glass powders, available in the dataset; q.v., Karlsson et al. (2022), revealed no significant mass losses during the measurements.
2.3.4 Density, molar volume and compactness
Densities were measured using Archimedes method in deionized water (ρw = 0.998 g/cm3). The water temperature was kept within 21.5°C ± 0.5°C for the density measurements. Density values of the glass samples (ρ) were calculated using
where md is the weight of the dry glass sample, mw the weight of the sample immersed in deionized water and ρw being the density for water. Sample weights varied between 6 and 10 g and the densities were estimated to be reproducible to ±0.003 g/cm3.
The molar volume of the glass sample was calculated using
where xi is the molar fraction, Mi the molar mass of element i and ρ the density of the glass. The compactness (atom packing density) was calculated according to
where Vi is the volume contribution from oxide i (i = MxOy) calculated from the ion radii,
The oxygen packing density (CO), which is the molar amount of oxygen per unit volume of the glass (Ray, 1974; Grammes et al., 2020), was calculated according to
where
2.3.5 Nanoindentation experiments
Hardness (H) and the reduced elastic modulus (Er) were determined by nanoindentation on polished glass samples before and after ion-exchange treatment using the Oliver-Pharr method (Oliver and Pharr, 1992). H is defined by the maximum applied load (Fm) divided by the projected contact area (Ap);
Nanoindentation was performed using a NHT2 instrument from Anton Paar with indentation loads 1, 5, 10, 15, 25, 50 and 75 mN. The number of indents was 40 for 1 mN load and 20 for the other load levels. The indentations had the following settings: acquisition rate 10 Hz, loading and unloading rate two times the max load per min (i.e., 2 mN/min for the max load of 1 mN etc.), holding time at max load 10 s, approach speed 4 μm/s and the stiffness threshold 500 μN/μm. The Poisson’s ratio (ν), that is affecting the determination of EIT by
2.3.6 Microindentation experiments
The crack resistance (CR) was measured on polished glass monoliths before and after ion-exchange treatment using a Micro-Combi Tester (MCT) from CSM Instruments. The Vickers microindentations were used to produce radial crack statistics in the glass samples The CR method is described in (Sundberg et al., 2019), which follows the original procedure of (Kato et al., 2010). 15 indents were made for each load using a Vickers indenter. The least square method was used for fitting to the Weibull cumulative function,
where PCI is the probability of crack initiation, xp is the load in N, xc is the characteristic value in N and m the Weibull modulus. The CR is then defined as the load when the PCI is 50%. However, the Weibull cumulative function, xc, can likewise be used as a relative measure of the CR, cf. previous paper (Karlsson, 2022). The Vickers indentations were made with an acquisition rate of 10 Hz using a linear loading with an (un)loading rate of two times the max load per min (i.e., 2N/min for the max load 1N etc.). The holding time at load was 15 s. The approach speed was 8 μm/min and the retract speed 16.6 μm/min. The contact force was 30 mN and the contact stiffness threshold 25,000 μN/μm. The indentations were made in the load range up to 30N and in the displacement range up to 1000 µm. All indentations, both nano and micro were performed at 23°C ± 2°C and relative humidity of 40% ± 10%. We estimated the error of the CR and xc to be ±20% except for the samples with m > 10 where the error is lower (cf., Supplementary Table S2).
3 Results
3.1 Solid state nuclear magnetic resonance
3.1.1 27Al magic-angle spinning nuclear magnetic resonance
Owing to the low/moderate cation field strength of the Na+ and Ca2+ ions of the Na2O–CaO–Al2O3–SiO2 glasses, a traditional network model is expected to hold well for their structures, meaning that the AS glass network only involves [AlO4/2]− groups, surrounded by SiO4/2 tetrahedra that accommodates all non-bridging oxygen (NBO) ions (Engelhardt and Michel, 1987; Edén, 2020). The sole presence of tetrahedrally coordinated Al species is verified by the 27Al MAS NMR spectra presented in Figures 1A–C, which were recorded from the Al8, Al16, and Al20 glasses. The observed 27Al shifts at the peak maxima, δmax, remain in the 57–59 ppm range, and are consistent with AlO4 groups (Engelhardt and Michel, 1987; Edén, 2020). The slight “tailing” of the 27Al NMR peak shapes towards lower 27Al shifts stems from distributions of 27Al quadrupolar products,
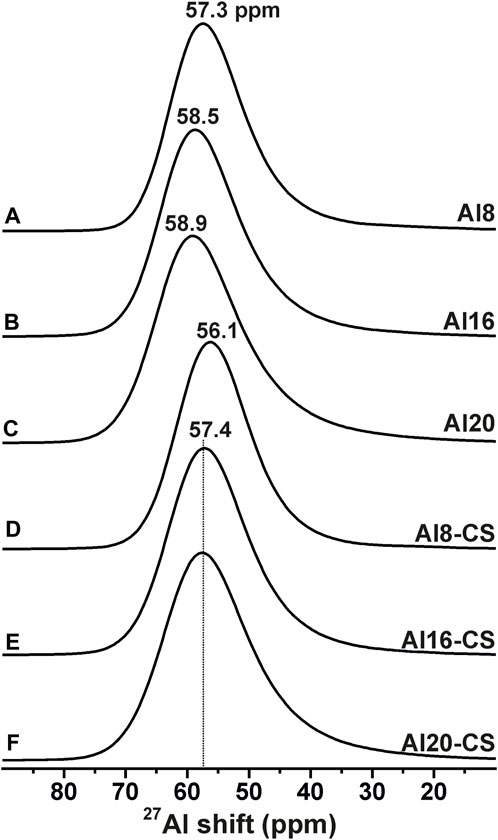
FIGURE 1. 27Al NMR spectra recorded at 14.1 T and 24.00 kHz MAS from the Na2O–CaO–(Al2O3)–SiO2 glasses before (A–C) and after (D–F) exchange with K+ ions. The peak maximum (in ppm) is indicated at the top of each NMR spectrum.
For increasing Al2O3 content, the NMR-peak maxima in Figure 1 displace concurrently towards higher shifts. From the best-fit 27Al NMR parameters listed in Table 2 follows that the observed peak displacements originate from a concomitantly increased (average) isotropic 27Al chemical shift (
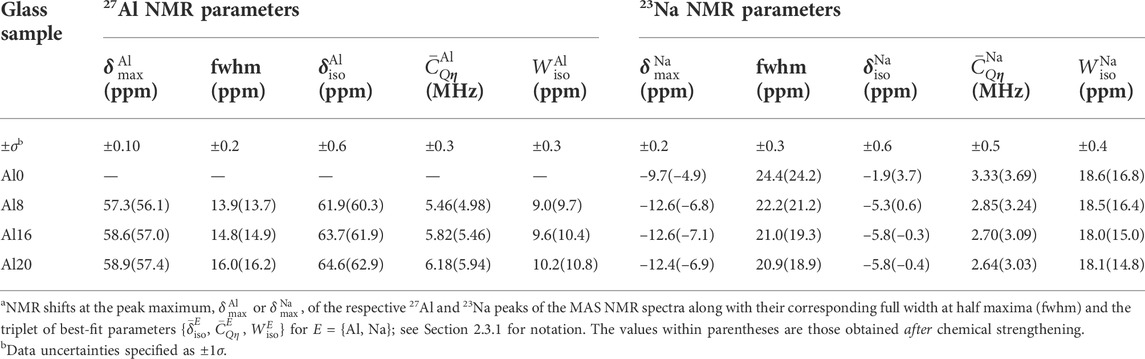
TABLE 2. 27Al and23Na NMR parameters before and after chemical strengthening.a
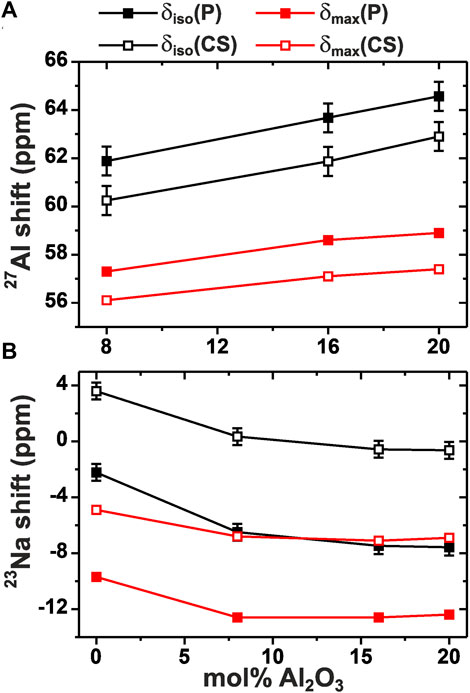
FIGURE 2. Average isotropic chemical shift (δiso) and the shift at the NMR-peak maximum (δmax) plotted against the mol% of Al2O3 in the glass for (A) 27Al and (B) 23Na. “P” refers to results from the pristine glasses and “CS” to those obtained after chemical strengthening; see Table 2.
The negatively charged [AlO4]− moieties are expected to be charge-compensated primarily by the Na+ cations, whereas the remaining Na+ reservoir, along with that of Ca2+, mainly act as glass network modifiers that introduce—and charge balance—NBO anions at the SiO4 groups (Mysen et al., 1981; Lee and Sung, 2008; Gambuzzi et al., 2014a). Consequently, the progressive Al2O3-for-SiO2 substitutions (at constant Na2O and CaO contents) are accompanied by a concurrently increased polymerization of the AS glass network. This feature is reflected by an increase of the average number of bridging oxygen (BO) atoms per SiO4 group (
Upon the K+-for-Na+ exchange, the 27Al MAS NMR spectra (Figures 1D–F) reveal only minor alterations, which underlie the following NMR-parameter trends (Table 2): (i) Although the linear correlation between the isotropic chemical shift and n(Al2O3) remains intact after chemical strengthening, the ion-exchanged glass exhibits a 1–2 ppm lower
3.1.2 23Na magic-angle spinning nuclear magnetic resonance
We next consider the 23Na MAS NMR results, where Figure 3A depicts the NMR spectrum from the SLS glass. As anticipated from the spin-3/2 nature of 23Na, its resonance is broad and slightly tailed towards lower shifts (vide supra). On the introduction of Al in the glass network, the 23Na NMR peak maximum shifts from −9.7 ppm (Figure 3A) to around −12.5 ppm in the spectra from the Al-bearing glasses Al8, Al16, and Al20; see Figures 3B–D and Table 2. This trend stems from an isotropic chemical shift decrease from
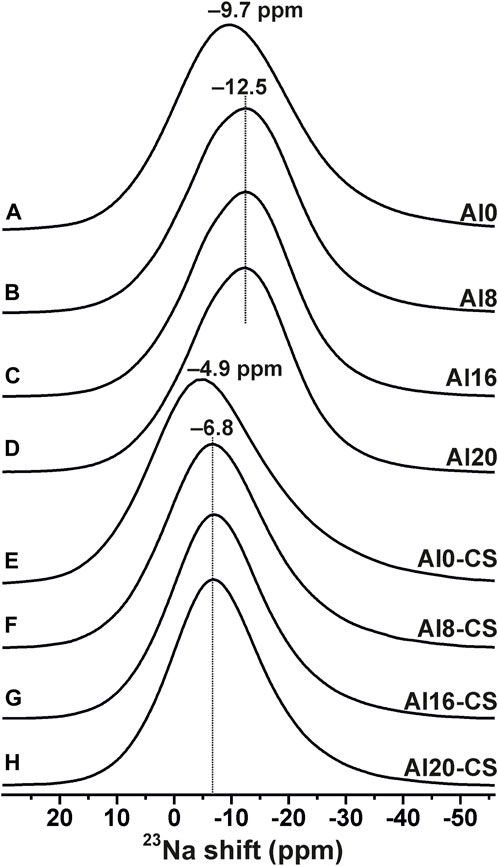
FIGURE 3. 23Na NMR spectra recorded at 14.1 T and 24.00 kHz MAS from the as-indicated glasses before (A–D) and after (E–H) exchange with K+ ions. Note that all NMR spectra are normalized to the same maximum peak height, and that the integrated signal intensity of each spectrum in (E–H) is only 25%–35% of that observed in the respective pristine glass shown in (A–D).
Relative to the pristine glasses, drastical 23Na shift-changes are observed in the NMR spectra obtained from the series of K+-for-Na+ exchanged glasses displayed in Figures 3E–H, where the shift at the peak maximum is increased by 5–6 ppm (Table 2). As for 27Al, this deshielding trend mirrors that of the isotropic 23Na chemical shift (Figure 2B), which is increased by ∼6 ppm upon chemical strengthening. The same 23Na deshielding trend has been reported for Na−Ca−Si−O glasses upon chemical strengthening by K+ incorporation (Ragoen et al., 2017a), and accords also with elevated-pressure induced effects observed in 23Na MAS NMR from AS glasses (Lee, 2010).
The dependence of the isotropic 23Na chemical shift on structural parameters is complicated but is known to increase for a decrease in either the Na coordination number (Na[p]) or the average Na–O distance (Xue and Stebbins, 1993; George and Stebbins, 1995; Charpentier et al., 2004; Gambuzzi et al., 2014b; Yu et al., 2020), where we note that these structural parameters are usually correlated. Hence, the observed 23Na shift increase upon the K+-for-Na+ exchange may stem from one or both of the following: (i) a shift in the distribution of Na[p] average coordination towards lower p, where the larger K+ cation outcompetes Na+ for the highest coordination sites in the glass structure, or (ii) a net reduction in the average Na–O distances (with unaltered coordination numbers), as concluded by (Ragoen et al., 2018) or tacitly assumed (Ragoen et al., 2017a) from cation-exchanged Na/Ca-based silicate glasses. Moreover, unlike the scenario of Al, the partial replacement of Na+ cations by K+ leads to a minor increase in the 23Na quadrupolar product by ∼0.4 MHz, the elevation of which remains constant, regardless of the presence/absence of Al in the glass (or the precise Al content); see Table 2.
From the integrated 23Na NMR signal intensities of the pristine and ion-exchanged glasses in Figure 3 and the assumption of an equimolar K+-for-Na+ exchange, we estimated that a majority of the Na+ cations (74%) was exchanged in the Al-free SLS glass (Al0), whereas a somewhat reduced exchange efficiency (∼65%) resulted for the Al-bearing counterparts. Incidentally, the exchange-degree trend of an initial large drop at no/low Al2O3 contents, followed by near-constant values for increasing x ≥ 8 mol%, which match that of
3.2 Residual compressive stress (RCS)
Figure 4 shows the RCS as a function of the Al2O3 content and the recorded σs values are given in Supplementary Table S1. The 5 and 16 h treatment do not follow the same trend; the 5 h follows a positive second degree polynomial function while the 16 h follows a negative second degree polynomial function. The RCS results will be further discussed in relation to other properties in the forthcoming sections.
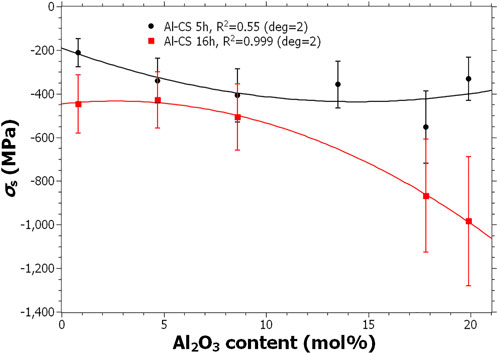
FIGURE 4. Residual compressive stress (RCS) at surface, σs, as a function of Al2O3 content. The lines are polynomial fits of the second degree.
3.3 Glass transition temperature (Tg) and sub-Tg relaxation
Figure 5 displays the DTA data obtained from both the pristine and CS glass powders. All pristine samples exhibit a well-defined glass transition, with the Tg values increasing concurrently with the Al2O3 content, in good agreement with literature findings (Cheng et al., 2013; Takahashi et al., 2015; Ragoen et al., 2017b). The determined Tg for the investigated glasses are given in Table 1. The second endothermic peak, which we are not investigating in this paper, we anticipate being the onset of the crystallization range of the glasses.
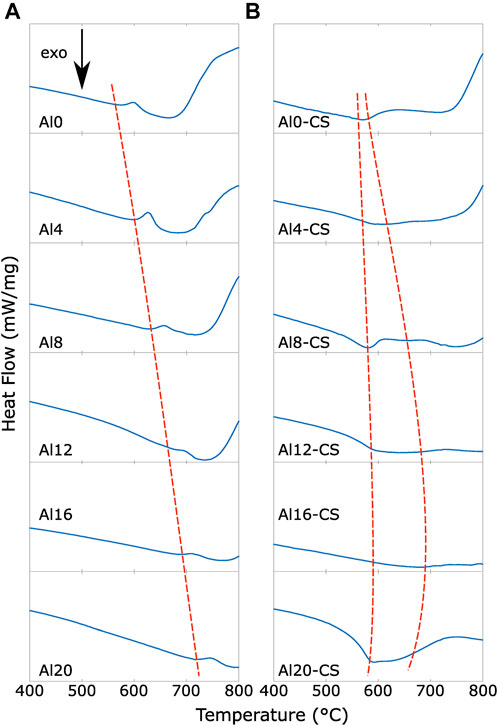
FIGURE 5. DTA graphs for (A) Al0–20 glass powder and (B) CS Al0–20 glass powder. The red dashed lines are guides for the eye showing the trends.
The Tgs of the CS glasses are diffuse and not reported due to their large uncertainties. In contrast to the pristine glasses, the first step of the DTA curve is characterized by an exothermic step (hereinafter referred to as a sub-Tg step). We anticipate the observed sub-Tg step to stem from relaxation processes of the chemical-strengthening-induced RCS, analogous to the sub-Tg step observed from mechanically induced excess enthalpy studied by (Martin et al., 2005). The sub-Tg step coincides well to the point where stresses start to relax, i.e., slightly above the strain point. The Al8-CS glass manifests 2 Tg peaks, which is attributed to the presence of two separate segments/phases of each glass particle they presumably differ primarily in their glass modifier composition, constituting ion-exchange-induced K+-bearing outer segment and a core/bulk of the pristine Al8 glass (similar to a liquid-liquid phase separation (Zheng et al., 2020)). Such inhomogeneities rationalize the ill-defined Tg values of the CS glasses. Moreover, for the Al12-CS, Al16-CS and Al20-CS glasses, the endothermic steps are particularly diffuse, which is attributed to slower relaxation stemming from an increased viscosity due to the high Al content of these glasses (Karlsson, 2021). Al16-CS also exhibit a diffuse sub-Tg step. Apparently, the Al16-CS glass exhibits the highest temperatures for the sub-Tg step and Tg peak, as is shown by the dashed guiding lines in Figure 5.
The trends of Figure 5 correspond well to the recorded σs data shown in Figure 4 and given in Supplementary Table S1. Furthermore, the results of Figure 5 suggest that the relaxation of RCS might be investigated by differential scanning calorimetry (DSC) measurement on ion-exchanged glass powder or discs in analogy with the method of (Yue et al., 2002) for fictive-temperature estimates. However, more work is required to verify this concept.
3.4 Density, molar volume and compactness
The results of Table 1 reveal a concomitant increase in the glass density and molar volume when silica is replaced by alumina, in good agreement with previous findings (Cormier and Neuville, 2004; Ragoen et al., 2017b). These results may be understood from the free-volume expansion that accompanies the increased average Na–O bond length upon the Na–NBO–Si
Along with an increase in the free volume, the Cg is decreased for increasing alumina content. The decrease of the Cg has also been observed in the ternary Na2O–Al2O3–SiO2 system (Bechgaard et al., 2016). Cg is linearly decreased for Al2O3 < 10 mol% and then shifting to a nonlinear trend for Al2O3 > 10 mol% which to some extent is caused by the deviation from the nominal composition, see Table 1. The Cg can affect other properties (Giri et al., 2004; Rouxel, 2007) and thus the structural moieties influencing the Cg may be a key for understanding the network dilation coefficient besides glass network connectivity (Tandia et al., 2012; Wang et al., 2017). For instance, the change of packing between Na and K (in alkali silicates) is the highest change for all the alkali ions as shown from the study of (Giri et al., 2004) and is a reason to why Na and K is most suitable for chemical strengthening compared to other alkali-pairs. The CO remains approximately invariant when SiO2 is replaced by Al2O3.
3.5 Hardness and reduced elastic modulus
Figure 6 shows H and Er as a function of Al2O3 content for 75 mN load. For the pristine glasses, H and Er increase with the Al2O3 content, at first linearly, but for M(2)O/Al2O3 ≈ 1 nonlinearly. The results follow similar trends as reported previously (Yoshida et al., 2004). For the CS series, the trends are linear for both H and Er. For Al2O3 < 5 mol% in the CS 16 h series have lower and approximately the same Er as for the untreated series.
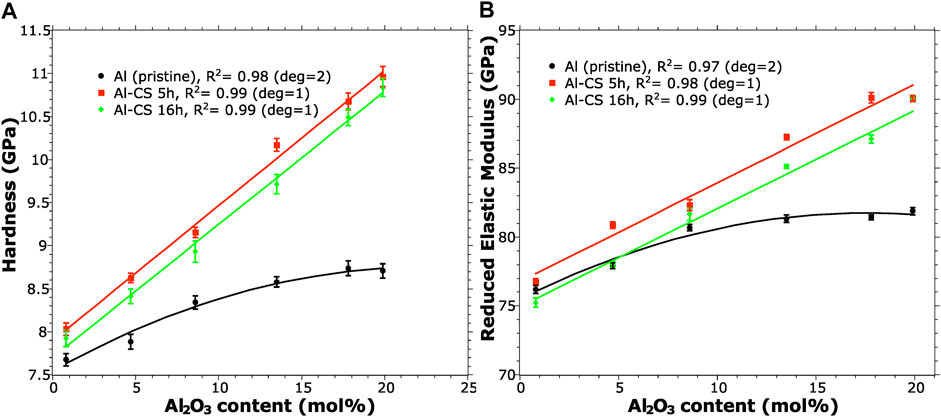
FIGURE 6. (A) Hardness (H) and (B) Reduced Elastic Modulus (Er) for 75 mN nanoindentation as a function of Al2O3 content in mol%. The solid lines are polynomial fittings with the R2 and polynomial degree given in the legend.
Figure 7 plots the hardness (H) against the indentation load for each glass before and after chemical strengthening. Generally, regardless of the precise load and treatment time, the chemical strengthening give an increase in H. However, the 16 h CS glasses typically give lower hardness values than the 5 h CS glasses in all cases except for M(2)O/Al2O3 ≈ 1 (Table 1) where the 16 h give higher hardness than 5 h for the 5 and 15 mN loads. N.b., that at 1 mN loads and Al2O3 contents <10 mol%, H is lower for the 16 h CS glasses than for the pristine glasses (see further discussion in Section 4.1). In Supplementary Figure S1, the ΔHCS as a function of load and compositions are shown, where ΔHCS is given by HCS–Hpristine (Karlsson, 2022). In general, the trends are linearly increasing with the Al2O3 content, the linear fitting R2 for the 5–75 mN loads of the 5 and 16h CS glasses gives 0.87–0.97 and 0.85–0.94 respectively. For 1 mN load, the trend for ΔHCS is entirely different; as a function of Al2O3 content, it initially shows a decrease and a clear minimum for Al8 before increasing linearly. The results will be further discussed in Section 4.1.
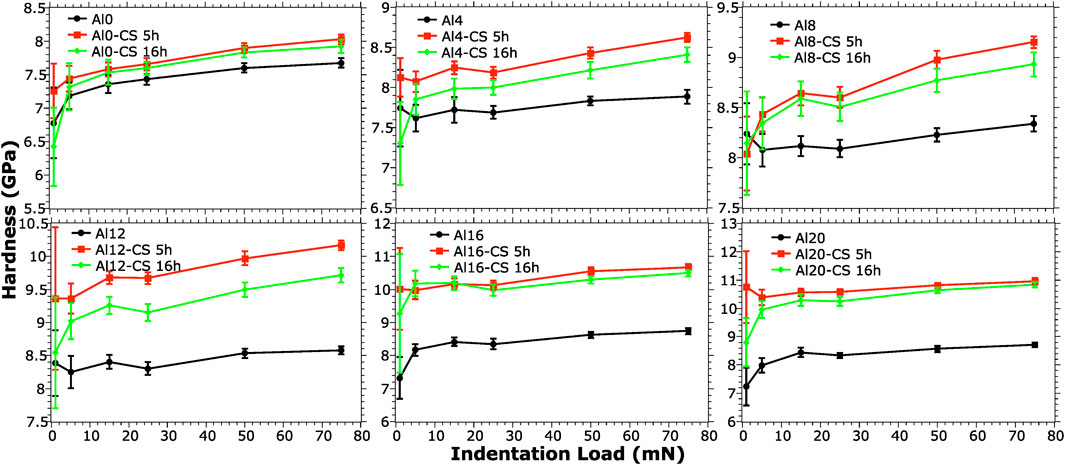
FIGURE 7. Hardness (H) as a function of indentation load for each sample, pristine and CS-glasses for 5 and 16h respectively. The solid lines are guides for the eye.
3.6 Crack resistance
Figure 8 shows the dependence of CR on the Al2O3 content. The pristine series show a marginal decrease with increasing Al2O3 concentration, as previously observed for Na2O–Al2O3–SiO2 glasses (Yoshida et al., 2004). For the 5 h CS glasses, there is a clear increase from Al2O3 > 8 mol% to a maximum for M(2)O/Al2O3 ≈ 1; see Table 1. The 16h CS glasses also show a maximum for M(2)O/Al2O3 ≈ 1. Both 5 and 16 h CS glasses show a decrease for Al20. The results for Al0 are lower than reported for a conventional SLS float glass (Sundberg et al., 2019), which could be explained by higher surface quality of float glass (Güzel et al., 2020) or sharpness of tip (Gross, 2012). CR for the Al-bearing glasses are similar to what has been reported by (Morozumi et al., 2015). The CR including the Weibull fitting results are given in Supplementary Table S2. The results and its explanation will be discussed in Section 4.2.
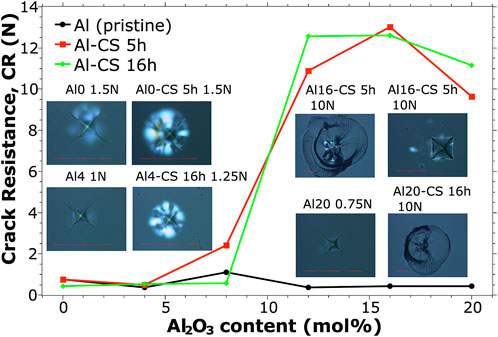
FIGURE 8. Crack resistance (CR) as a function of Al2O3 content. The insets show some selected characteristic microscope light images of indents. The solid lines are guides for the eye.
4 Discussion
In general, AS glasses frequently exhibit a turning point for properties M(2)O/Al2O3 ≈ 1. Especially transport properties, such as melt viscosity, exhibit clear maxima in both the ternary and the quaternary Na2O–(CaO)–Al2O3–SiO2 systems (Toplis et al., 1997; Webb et al., 2007; Karlsson, 2021). However, other properties conventionally also give a trend-shift at M(2)O/Al2O3 ≈ 1 (Smedskjaer et al., 2013; Cormier, 2021). This originates from the preference for the alkali ions to act as charge compensators of the negatively charged AlO4 groups; q.v., Section 3.1.1. This has now also been shown to account for effects for CS glasses as shown in Section 3.2, Section 3.3, Section 3.5, and Section 3.6. Furthermore, trends in physical properties as a function of the
4.1 Hardness, reduced elastic modulus and residual compressive stress
For a progressing K+-for-Na+ ion exchange, the glass densifies while compressive stresses accumulate at the surface (Luo et al., 2016a); q.v. Figure 4. Along with hot compression, H is often increased by that kind of densification (Svenson et al., 2017). Therefore, it is reasonable that the hardness increases upon chemical strengthening treatment which thus is linked to the RCS (Jang, 2009), as has previously been indicated by (Svenson et al., 2016) and supported by the correlation between σs (c.f., Supplementary Table S1) and ΔHCS in Figure 9A. The σs data of 5h is likely less accurate than 16h due to the lower depth-of-layer and it is reflected in the fit. σs as a function of ΔEr,CS give a slightly better fit, R2 0.37 and 0.98 for 5 and 16h respectively. N.b., that RCS is not of the same nature as for thermally strengthened glass (Kese et al., 2004). Free volume and thus also Cg (q.v., Section 3.4) is linked to ν (Rouxel, 2007) which is a governing property for the ability to densify; lower Cg gives higher densification-ability; see Figure 4 in (Rouxel et al., 2008), and related text for detailed reasoning. The support for this is manifested by Figure 9B, where σs as a function of Cg and even CO give a fair correlation. The lack of perfect correlation is wrecked by a combination of the σs error and the complexity of the compressive stress buildup and relaxation, which is a function of other properties as well (Dugnani, 2020), thus more studies on this are needed.
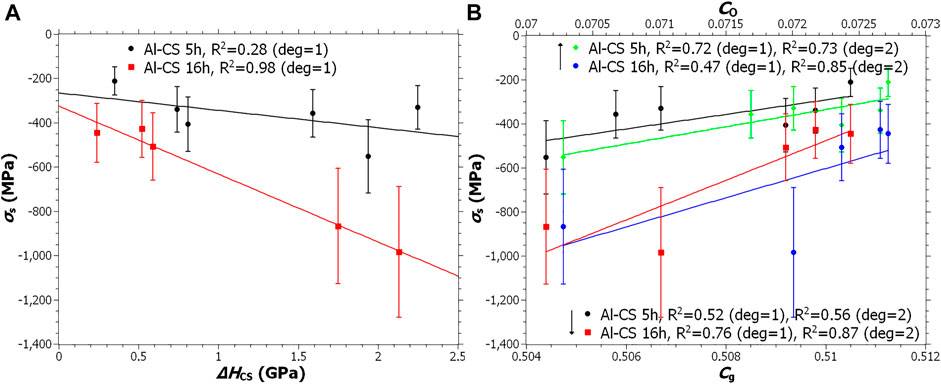
FIGURE 9. Residual compressive stress (RCS) at surface, σs, as a function of (A) ΔHCS and (B) Cg as well as CO.
Figure 10A plots ΔHCS and ΔEr,CS against Cg. The trend is quite linear until it turns after M(2)O)/Al2O3 ≈ 1 (Table 1). In contrast to a recent report on the Na2O–CaO–TiO2–SiO2 system (Karlsson, 2022), the present Na2O–CaO–Al2O3–SiO2 glasses reveal nearly linear correlations between Vm and the ratio Er/H, cf. Supplementary Figure S2. Er/H is essentially a measure of the elastic volume recovery which will be discussed more in Section 4.2 (Rouxel, 2015). Similar correlation as for Figure 9A can be found for σs as a function of Er/H as well.
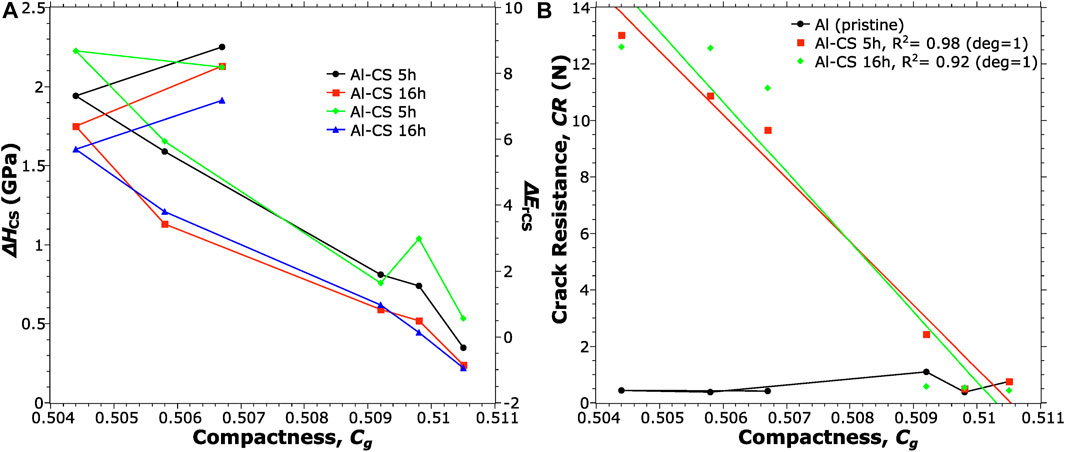
FIGURE 10. (A) ΔHCS, ΔEr,CS and (B) Crack Resistance (CR) as a function of the compactness (Cg). The solid lines are guides for the eye except for Al-CS 5 h and Al-CS 16 h in (B) which are linear fittings.
The mixed alkali effect (MAE) is well-known to primarily affect cation-transport-related properties, but has also been shown to influence mechanical properties (Kjeldsen et al., 2014; Aakermann et al., 2015; Grund Bäck et al., 2019); for n(K2O)/[n(Na2O)+ n(K2O)]≈1, both H and E is lower than for ratios n(K2O)/[n(Na2O)+ n(K2O)] close to 0 (Kjeldsen et al., 2014; Weigel et al., 2016). This applies also to isostatically compressed glasses (Aakermann et al., 2015). For CS glasses, the MAE is not manifested in the same way as for as-melted glass (Varshneya, 2010a).
For our CS glasses the origin of ΔHCS cannot be caused by the MAE, instead it must be caused by RCS and its accompanied densification. However, at 1 mN loads (q.v., Figure 6 and cf. Supplementary Figure S1) notable trend-breakers can be observed where ΔHCS are negative for Al0, Al4 and Al8. We hypothesize this, and the fact that 16h CS glasses generally show lower ΔHCS, to be caused by viscosity driven stress relaxation. Thus, H then resembles the K2O-rich end of the MAE of H (i.e., giving a lower value than for pristine glass (Kjeldsen et al., 2014; Aakermann et al., 2015). Thus, for relaxed CS glasses we believe MAE plays a role. We hope to confirm this reasoning in a future study.
4.2 Crack resistance
Upon application of an indenter on a glass surface, the energy is dissipated by elastic and plastic deformation (Yoshida, 2019; Rouxel et al., 2021; Varshneya et al., 2022). These processes differ in that when the load is removed, the elastic deformation is completely reversed, whereas the plastic deformation leaves a permanent imprint. The energy dissipation by plastic deformation can be categorized into two processes: densification, and shear flow (Yoshida, 2019; Rouxel et al., 2021; Varshneya et al., 2022). At sufficiently high indenter force the ability of the glass to deform elastically and plastically is not sufficient, instead the energy is dissipated as cracks. These cracks can either form during loading or during unloading (Yoshida, 2019; Rouxel et al., 2021; Varshneya et al., 2022). The crack type depends on the glass composition, but brittle materials exhibit most frequently radial and half-penny cracking (Yoshida, 2019; Rouxel et al., 2021), i.e., cracks originating from the corners of the Vickers indenter.
In CS glasses, (Morris et al., 2004), showed that the radial crack initiation is inhibited by RCS, but suggested that lateral cracking, i.e., sub-surface cracks parallel to the surface; see Figure 11, is enhanced by the RCS. However, Morris et al. stated that lateral cracks are not as critical for the glass-strength degradation as the radial counterparts, at least not until they reach the surface. Lateral and Median cracking are sub-surface cracking (Cook and Pharr, 1990), and are not recorded in the CR test. This suggests that RCS, along with the accompanied densification gradient, enhances the CR by obstructing sub-surface cracking to reach the surface. Chipping, defined as sub-surface cracking reaching the surface and is manifested by giving a crater; see Figure 11, then occurs at sufficiently high load, q.v., Figure 8 insets for 10N of Al16-CS and Al20-CS. Chipping is then taken to imply PCI = 100% if it affects all sides of the indent. Chipping was clearly observed for Al2O3 contents >10 mol%. This reasoning is confirmed by a recent study by (Kang et al., 2020) where they observed median crack initiation upon indentation, likely beneath the RCS zone. However, their Al2O3 content is not mentioned in the paper. Xiaoyu et al. concluded that radial cracks are more easily initiated in CS AS glass with about 5 wt% Al2O3 (Xiaoyu et al., 2018), which is in the range of 3–4 mol%; see Table 1, and thus agrees with our results.
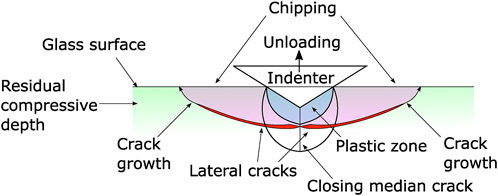
FIGURE 11. Schematics of the chipping process during unloading of the indenter, where the sub-surface lateral cracks grow and reach the surface.
As already stated, chipping was for Al2O3 > 10 mol% frequently observed to occur during unloading. In thin glass central tensile stresses from the balancing RCS could potentially induce such behavior, however, our monoliths are quite thick (ca. 2–2.5 cm), so we expect the central tension to be marginal. Instead, the clear difference in CR is governed by the Al2O3 content. Al2O3 > 10 mol% reduces the “fast” network relaxation by having a favorable structure, i.e., low alkali-induced NBO structure, a high reduced elastic modulus and lower Cg (see Figure 10B). We already implied in Section 4.1, that lower Cg is linked to a higher ability for densification (Rouxel et al., 2008; Varshneya et al., 2015) and thus a higher ability for RCS buildup which also increases the CR; q.v., σs data in Supplementary Table S1. In Figures 10A,B linear relation between CR and Cg is shown, R2 is 0.98 and 0.92 for 5 and 16h respectively. In addition, viscous relaxation of the RCS is also inhibited by the higher viscosity that the Al2O3 content gives (Karlsson, 2021).
Varshneya previously described ion-exchange strengthening to be analogous to indentation (Varshneya, 2010b; a), having both elastic and plastic processes that governs the buildup of RCS. It was predicted that the compositions that exhibit less indentation depth and thus those having higher elastic modulus should perform better as CS glass. For our CS glasses the indentation depth at max load, hm, as a function of the Al2O3 content is decreased; q.v., Figure 12, which supports the prediction of Varshneya. The indentation depth, hm, follows linear but opposite trends as H as a function of Al2O3 content. In a previous paper, a rough correlation between the ratio Er/H and CR was found (Karlsson, 2022). It is more frequently used in its inverted form, H/Er, where materials having H/Er >0.1 exhibit excellent tribological properties (Musil et al., 2002; Calahoo et al., 2016; Varshneya et al., 2022). H/Er can be directly linked to the elastic recovery energy (UE/UT) in the indentation process by a proportionality factor, κ, which can be approximated to 5.17 in the range 0.08–0.12 for H/Er (Yetna N'Jock et al., 2016). UE/UT upon indentation is given by
and the calculated values for UE/UT are given in Supplementary Table S1 together with H3/Er2, which instead is a measure of the resistance to plastic deformation (Calahoo et al., 2016). N.b., that we assume the same κ also for those samples having H/Er > 0.12. Both UE/UT and H3/Er2 show similar trends as H and hm as a function of Al2O3 content, cf. Supplementary Figure S3. Thus, UE/UT and H3/Er2 also show similar trends as a function of CR; see Supplementary Figure S3. Thus, H and Er are keys for understanding CR through the previously described relations. Indentation induced cracking is governed by mismatching stresses upon loading or unloading and a better balance between elastic and plastic dissipation should give higher CR. For the studied glasses it occurs when UE/UT >57%. An analysis of the indentation stress fields, and its effect of RCS in CS glasses would be useful to elucidate more on this.
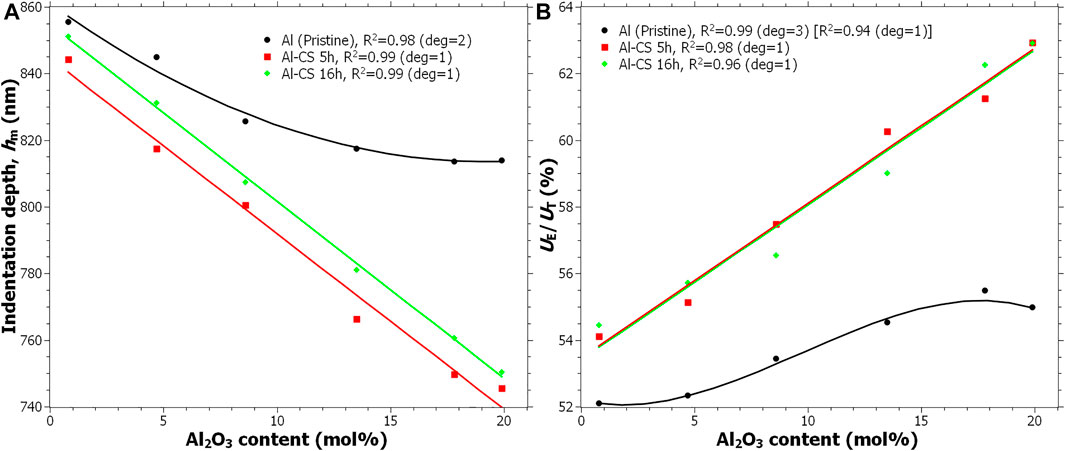
FIGURE 12. (A) Indentation depth and (B) UE/UT as a function of Al2O3 content. The data originates from nanoindentations of 75 mN load; see Supplementary Table S1.
The crack initiation mode, radial or median, can be dependent on the composition apart from the RCS. For Al2O3 < 10 mol% there is sub-surface cracking but also much easier radial cracking. However, the CR test only considers the radial crack statistics and is thus unfavorable for the CS glasses with Al2O3 < 10 mol%, as radial cracks are still easily formed (like isostatically compressed glasses (Zhang et al., 1995; Svenson et al., 2014)). The radial crack lengths for the CS glasses are clearly shorter, q.v. Figure 8, consistent with observations in borosilicate CS glasses (Talimian and Sglavo, 2017). However, this measure was not considered in the present study.
5 Summary and conclusion
Our study on Al-doped soda-lime-silicate glasses upon K+-for-Na+ exchange manifested a complex property-dependence on their relative Si and Al contents. Tg, H and Er of the pristine glasses were enhanced monotonically for increasing Al2O3 content. H and Er showed for M(2)O/Al2O3 ≈ 1 nonlinear trends, whereas the CS counterparts were found to be strictly linearly increasing with the Al-for-Si replacement. Tg and σs on the other hand, was linear for the pristine glasses and linear to nonlinear for the CS glasses as a function of Al2O3 content. Several physical properties, along with the silicate network connectivity, of both series of pristine and chemically strengthened glasses depended roughly linearly on their alumina content, except for clear deviations observed for glasses around the M(2)O/Al2O3 ≈ 1 composition.
27Al MAS NMR experiments revealed a dominance of [AlO4]− groups throughout all pristine and ion-exchanged glass structures, with the exchange manifested only by a minor 27Al deshielding upon the replacement of Na+ by the less electronegative K+ cations. Significant alterations were observed in the 23Na shifts observed by 23Na MAS NMR, which presumably reflects an overall lowering of the (average) Na coordination numbers because the larger K+ cations outcompete those of Na+ for the highest-coordination sites in the glass structure. The extent of cation exchange was also estimated by 23Na MAS NMR, revealing a markedly higher degree of exchange (≈74%) of the Al-free SLS glass relative to the Al-bearing glasses, all of which revealed an essentially identical exchange level (∼65%) of the Na+ cations; this observation is attributed to the more polymerized networks of the Al-bearing glasses and the preference for the monovalent Na+ cation to balance the [AlO4]− groups, which naturally impedes its mobility and thereby exchange by K+.
Differential thermal analysis data revealed that the ion-exchanged glasses exhibit an exothermic step just below a blurred Tg. We propose that these characteristics stem from a combination of stress relaxation of the residual compressive stresses induced by the K+-for-Na+ ion exchange.
The chemical strengthening consistently increased the hardness, except for glasses incorporating <10 mol% Al2O3 for the specific conditions of an 16 h exchange period and an applied load of 1 mN, which resulted in a lower hardness than that of the pristine glass. We attribute these observations to a combination of stress relaxation and the mixed alkali effect. Stress relaxation is also manifested by the fact that the 16 h treatment time consistently yielded lower H and Er values relative to glasses treated for 5 h. These effects were less obvious for the Al-richer glasses with n(M(2)O)/n(Al2O3) ≈ 1 and on the σs results regardless of composition.
The crack resistance of the pristine glasses becomes slightly lower with increasing Al2O3. The chemical strengthening has a pronounced enhancement on the crack resistance for glasses with n(M(2)O)/n(Al2O3) ≈ 1. The chemical strengthening increases the elastic energy of recovery and the resistance to plastic deformation. The observed linear correlation between the crack resistance and the compactness suggests that Cg is a key parameter for the buildup of compressive stresses in the vitreous structure. Thus, our results suggest that the crack resistance (CR) of a chemically strengthened glass is a property governed by both the composition and structure, as well as residual compressive stress, where the CR is favored by a polymerization increase and compactness decrease; the latter is also linked to the residual compressive stress increase.
Data availability statement
The raw data supporting the conclusion of this article will be made available by the authors, without undue reservation. The datasets generated for this study can be found in the Swedish Service Repository https://snd.gu.se/en. DOI: https://doi.org/10.5878/kp36-vd61.
Author contributions
SK: conceptualization, methodology, validity, formal analysis, investigation, resources, data curation, writing ‐ original draft, writing ‐ review and editing, visualization, project administration, funding acquisition. RM: investigation, data curation, writing ‐ review and editing. SA: investigation, data curation, writing ‐ review and editing. MP: methodology, formal analysis, investigation, data curation. JA: validity, resources, writing ‐ review and editing. BS: formal analysis. ME: methodology, validity, formal analysis, investigation, resources, writing ‐ original draft, writing ‐ review and editing, visualization.
Funding
SK acknowledges funding from FORMAS, the Swedish Research Council for Sustainable Development, Grant No. 2018-00707.
Acknowledgments
Ingemar Malmros at RISE Research Institutes of Sweden and Charlotte Parsland at Linnaeus University are greatly acknowledged for their help with dissolution of glass powder and ICP-OES measurements, respectively. We also acknowledge fruitful discussions with Prof. Yuanzheng Yue at Aalborg University, in relation to the DTA analysis.
Conflict of interest
Authors MP and JA were employed by GlasStress Ltd.
The remaining authors declare that the research was conducted in the absence of any commercial or financial relationships that could be construed as a potential conflict of interest.
Publisher’s note
All claims expressed in this article are solely those of the authors and do not necessarily represent those of their affiliated organizations, or those of the publisher, the editors and the reviewers. Any product that may be evaluated in this article, or claim that may be made by its manufacturer, is not guaranteed or endorsed by the publisher.
Supplementary material
The Supplementary Material for this article can be found online at: https://www.frontiersin.org/articles/10.3389/fmats.2022.953759/full#supplementary-material
References
Aakermann, K. G., Januchta, K., Pedersen, J. A. L., Svenson, M. N., Rzoska, S. J., Bockowski, M., et al. (2015). Indentation deformation mechanism of isostatically compressed mixed alkali aluminosilicate glasses. J. Non-Cryst. Solids 426, 175–183. doi:10.1016/j.jnoncrysol.2015.06.028
Allsopp, B. L., Orman, R., Johnson, S. R., Baistow, I., Sanderson, G., Sundberg, P., et al. (2020). Towards improved cover glasses for photovoltaic devices. Prog. Photovolt. Res. Appl. 28 (11), 1187–1206. doi:10.1002/pip.3334
Axinte, E. (2011). Glasses as engineering materials: A review. Mater. Des. 32 (4), 1717–1732. doi:10.1016/j.matdes.2010.11.057
Bechgaard, T. K., Goel, A., Youngman, R. E., Mauro, J. C., Rzoska, S. J., Bockowski, M., et al. (2016). Structure and mechanical properties of compressed sodium aluminosilicate glasses: Role of non-bridging oxygens. J. Non-Cryst. Solids 441, 49–57. doi:10.1016/j.jnoncrysol.2016.03.011
Calahoo, C., Zhang, X., and Zwanziger, J. W. (2016). Nanoindentation study of the surface of ion-exchanged lithium silicate glass. J. Phys. Chem. C 120 (10), 5585–5598. doi:10.1021/acs.jpcc.6b00733
Carr, A. S., and Kim, J. (2017). Closed loop supply chain for glass recycling: Current practices and challenges. Int. J. Integr. Supply Manag. 11 (4), 316–331. doi:10.1504/ijism.2017.089845
Charpentier, T., Ispas, S., Profeta, M., Mauri, F., and Pickard, C. J. (2004). First-Principles calculation of 17O, 29Si, and 23Na NMR spectra of sodium silicate crystals and glasses. J. Phys. Chem. B 108 (13), 4147–4161. doi:10.1021/jp0367225
Cheng, J., Xiao, Z., Yang, K., and Wu, H. (2013). Viscosity, fragility and structure of Na2O–CaO–Al2O3–SiO2 glasses of increasing Al/Si ratio. Ceram. Int. 39 (4), 4055–4062. doi:10.1016/j.ceramint.2012.10.258
Cook, R. F., and Pharr, G. M. (1990). Direct observation and analysis of indentation cracking in glasses and Ceramics. J. Am. Ceram. Soc. 73 (4), 787–817. doi:10.1111/j.1151-2916.1990.tb05119.x
Cormier, L. (2021). “Glasses: Aluminosilicates,” in Encyclopedia of materials: Technical Ceramics and glasses. Editor M. Pomeroy (Oxford: Elsevier), 496–518. doi:10.1016/B978-0-12-818542-1.00076-X
Cormier, L., and Neuville, D. R. (2004). Ca and Na environments in Na2O–CaO–Al2O3–SiO2 glasses: Influence of cation mixing and cation-network interactions. Chem. Geol. 213 (1), 103–113. doi:10.1016/j.chemgeo.2004.08.049
Czjzek, G., Fink, J., Götz, F., Schmidt, H., Coey, J. M. D., Rebouillat, J. P., et al. (1981). Atomic coordination and the distribution of electric field gradients in amorphous solids. Phys. Rev. B 23 (6), 2513–2530. doi:10.1103/PhysRevB.23.2513
Deng, W., Spathi, C., Coulbeck, T., Erhan, K., Backhouse, D., Marshall, M., et al. (2020). Exploratory research in alternative raw material sources and reformulation for industrial soda-lime-silica glass batches. Int. J. Appl. Glass Sci. 11 (2), 340–356. doi:10.1111/ijag.14775
Dugnani, R. (2020). Closed-form solution to the residual stresses in ion-exchanged silicate glass including concentration-dependent material properties. J. Non-Cryst. Solids 536, 120012. doi:10.1016/j.jnoncrysol.2020.120012
Edén, M. (2011). The split network analysis for exploring composition–structure correlations in multi-component glasses: I. Rationalizing bioactivity-composition trends of bioglasses. J. Non-Cryst. Solids 357 (6), 1595–1602. doi:10.1016/j.jnoncrysol.2010.11.098
Edén, M. (2020). Update on 27Al NMR studies of aluminosilicate glasses. Annu. Rep. NMR Spectrosc. 101, 285–410. doi:10.1016/bs.arnmr.2020.07.002
Engelhardt, G., and Michel, D. (1987). High-resolution solid-state NMR of silicates and zeolites. Chichester, New York: John Wiley & Sons.
Erdem, İ., Guldiren, D., and Aydin, S. (2017). Chemical tempering of soda lime silicate glasses by ion exchange process for the improvement of surface and bulk mechanical strength. J. Non-Cryst. Solids 473, 170–178. doi:10.1016/j.jnoncrysol.2017.08.010
Frischat, G. H. (1975). Ionic diffusion in oxide glasses. Aedermannsdorf, Switzerland: Trans Tech S.A.
Gambuzzi, E., Charpentier, T., Menziani, M. C., and Pedone, A. (2014a). Computational interpretation of 23Na mqmas NMR spectra: A comprehensive investigation of the Na environment in silicate glasses. Chem. Phys. Lett. 612, 56–61. doi:10.1016/j.cplett.2014.08.004
Gambuzzi, E., Pedone, A., Menziani, M. C., Angeli, F., Caurant, D., and Charpentier, T. (2014b). Probing silicon and aluminium chemical environments in silicate and aluminosilicate glasses by solid state NMR spectroscopy and accurate first-principles calculations. Geochim. Cosmochim. Acta 125, 170–185. doi:10.1016/j.gca.2013.10.025
George, A. M., and Stebbins, J. F. (1995). High-temperature 23Na MAS NMR data for albite: Comparison to chemical-shift models. Am. Mineralogist 80 (9-10), 878–884. doi:10.2138/am-1995-9-1002
Giri, S., Gaebler, C., Helmus, J., Affatigato, M., Feller, S., and Kodama, M. (2004). A general study of packing in oxide glass systems containing alkali. J. Non-Cryst. Solids 347 (1), 87–92. doi:10.1016/j.jnoncrysol.2004.08.103
Grammes, T., Limbach, R., Bruns, S., van Wüllen, L., de Ligny, D., Kamitsos, E. I., et al. (2020). Tailoring the mechanical properties of metaluminous aluminosilicate glasses by phosphate incorporation. Front. Mat. 7 (115). doi:10.3389/fmats.2020.00115
Green, D. J., Tandon, R., and Sglavo, V. M. (1999). Crack arrest and multiple cracking in glass through the use of designed residual stress profiles. Science 283 (5406), 1295–1297. doi:10.1126/science.283.5406.1295
Gross, T. M. (2019). “Chemical strengthening of glass,” in Springer handbook of glass. Editors J. D. Musgraves, J. Hu, and L. Calvez (Cham: Springer International Publishing), 273–296. doi:10.1007/978-3-319-93728-1_8
Gross, T. M. (2012). Deformation and cracking behavior of glasses indented with diamond tips of various sharpness. J. Non-Cryst. Solids 358 (24), 3445–3452. doi:10.1016/j.jnoncrysol.2012.01.052
Grund Bäck, L., Ali, S., Karlsson, S., Möncke, D., Kamitsos, E. I., and Jonson, B. (2019). Mixed alkali/alkaline earth-silicate glasses: Physical properties and structure by vibrational spectroscopy. Int. J. Appl. Glass Sci. 10 (3), 349–362. doi:10.1111/ijag.13101
Güzel, A. S., Sarıgüzel, M., Özdemir Yanık, M. C., Günay, E., Usta, M., and Öztürk, Y. (2019). Enhancing mechanical endurance of chemical-tempered thin soda-lime silicate float glass by ion exchange. J. Aust. Ceram. Soc. 56, 185–201. doi:10.1007/s41779-019-00375-x
Güzel, A. S., Sarıgüzel, M., Özdemir Yanık, M. C., Günay, E., Usta, M., and Öztürk, Y. (2020). Enhancing mechanical endurance of chemical-tempered thin soda-lime silicate float glass by ion exchange. J. Aust. Ceram. Soc. 56 (1), 185–201. doi:10.1007/s41779-019-00375-x
Hand, R. J., and Tadjiev, D. R. (2010). Mechanical properties of silicate glasses as a function of composition. J. Non-Cryst. Solids 356 (44-49), 2417–2423. doi:10.1016/j.jnoncrysol.2010.05.007
Hödemann, S., Valdmann, A., Anton, J., and Murata, T. (2016). Gradient scattered light method for non-destructive stress profile determination in chemically strengthened glass. J. Mat. Sci. 51, 5962–5978. doi:10.1007/s10853-016-9897-4
Hödemann, S., Valdmann, A., Paemurru, M., Anton, J., Kiisk, V., Tkaczyk, E., et al. (2020). Measurement of stress build-up of ion exchange strengthened lithium aluminosilicate glass. J. Am. Ceram. Soc. 103 (4), 2407–2420. doi:10.1111/jace.16913
Iftekhar, S., Pahari, B., Okhotnikov, K., Jaworski, A., Stevensson, B., Grins, J., et al. (2012). Properties and structures of RE2O3-Al2O3-SiO2 (RE = Y, Lu) glasses probed by molecular dynamics simulations and solid-state NMR: The roles of aluminum and rare-earth ions for dictating the microhardness. J. Phys. Chem. C 116 (34), 18394–18406. doi:10.1021/jp302672b
Jacoby, M. (2018). Chemically strengthened glass’s next act: Car windshields. C&EN Glob. Enterp. 96 (3), 16–17. doi:10.1021/cen-09603-scitech1
Jang, J.-i. (2009). Estimation of residual stress by instrumented indentation: A review. J. Ceram. Process. Res. 10 (3), 391–400. doi:10.36410/jcpr.2009.10.3.391
Januchta, K., Youngman, R. E., Goel, A., Bauchy, M., Logunov, S. L., Rzoska, S. J., et al. (2017). Discovery of ultra-crack-resistant oxide glasses with adaptive networks. Chem. Mat. 29 (14), 5865–5876. doi:10.1021/acs.chemmater.7b00921
Kang, M., Li, W., Leong, A. F. T., Guan, M., Fezzaa, K., Harris, J. T., et al. (2020). Crack nucleation and growth during dynamic indentation of chemically-strengthened glass. Extreme Mech. Lett. 38, 100754. doi:10.1016/j.eml.2020.100754
Karlsson, S., Jonson, B., and Stålhandske, C. (2010). The technology of chemical glass strengthening - a review. Glass Technol. - Eur. J. Glass Sci. Technol. Part A 51 (2), 41–54.
Karlsson, S. (2021). Viscosity of alumina doped soda lime silicate glasses – observation of anomaly in the linear increase as Al2O3 replaces SiO2. J. Non-Cryst. Solids 573, 121149. doi:10.1016/j.jnoncrysol.2021.121149
Karlsson, S. (2022). Compositional effects on indentation mechanical properties of chemically strengthened TiO2-doped soda lime silicate glasses. Materials 15 (2), 577. doi:10.3390/ma15020577
Karlsson, S., Mathew, R., Ali, S., Paemurru, M., Stevensson, B., Anton, J., et al. (2022). Dataset: Mechanical, thermal, and structural investigations of chemically strengthened Na2O–CaO–Al2O3–SiO2 glasses. doi:10.5878/w6c3-hk86
Karlsson, S., and Wondraczek, L. (2021). “Strengthening of oxide glasses,” in Encyclopedia for glass science, technology, history and culture. Editor P. Richet (Hoboken, NJ: John Wiley & Sons). doi:10.1002/9781118801017.ch3.12
Kato, Y., Yamazaki, H., Yoshida, S., and Matsuoka, J. (2010). Effect of densification on crack initiation under Vickers indentation test. J. Non-Cryst. Solids 356 (35-36), 1768–1773. doi:10.1016/j.jnoncrysol.2010.07.015
Kese, K., Li, Z., and Bergman, B. (2004). Influence of residual stress on elastic modulus and hardness of soda-lime glass measured by nanoindentation. J. Mat. Res. 19 (10), 3109–3119. doi:10.1557/JMR.2004.0404
Kjeldsen, J., Smedskjaer, M. M., Mauro, J. C., and Yue, Y. (2014). On the origin of the mixed alkali effect on indentation in silicate glasses. J. Non-Cryst. Solids 406 (0), 22–26. doi:10.1016/j.jnoncrysol.2014.09.036
LaCourse, W. C. (2018). “Design of SLS compositions for accelerated chemical strengthening,” in 78th conference on glass problems, 179–189. doi:10.1002/9781119519713.ch16
Le Losq, C., Neuville, D. R., Florian, P., Henderson, G. S., and Massiot, D. (2014). The role of Al3+ on rheology and structural changes in sodium silicate and aluminosilicate glasses and melts. Geochim. Cosmochim. Acta 126, 495–517. doi:10.1016/j.gca.2013.11.010
Lee, S. K. (2010). Effect of pressure on structure of oxide glasses at high pressure: Insights from solid-state NMR of quadrupolar nuclides. Solid State Nucl. Magn. Reson. 38 (2), 45–57. doi:10.1016/j.ssnmr.2010.10.002
Lee, S. K., and Sung, S. (2008). The effect of network-modifying cations on the structure and disorder in peralkaline Ca–Na aluminosilicate glasses: O-17 3QMAS NMR study. Chem. Geol. 256 (3–4), 326–333. doi:10.1016/j.chemgeo.2008.07.019
Levitt, M. H., and Edén, M. (1998). Numerical simulation of periodic nuclear magnetic resonance problems: Fast calculation of carousel averages. Mol. Phys. 95 (5), 879–890. doi:10.1080/002689798166503
Luo, J., Lezzi, P. J., Vargheese, K. D., Tandia, A., Harris, J. T., Gross, T. M., et al. (2016a). Competing indentation deformation mechanisms in glass using different strengthening methods. Front. Mat. 3 (52). doi:10.3389/fmats.2016.00052
Luo, J., Vargheese, K. D., Tandia, A., Harris, J. T., and Mauro, J. C. (2016b). Structural origin of intrinsic ductility in binary aluminosilicate glasses. J. Non-Cryst. Solids 452, 297–306. doi:10.1016/j.jnoncrysol.2016.09.010
Macrelli, G., Varshneya, A. K., and Mauro, J. C. (2019). Simulation of glass network evolution during chemical strengthening: Resolution of the subsurface compression maximum anomaly. J. Non-Cryst. Solids 522, 119457. doi:10.1016/j.jnoncrysol.2019.05.033
Macrelli, G., Varshneya, A. K., and Mauro, J. C. (2020). Ultra-thin glass as a substrate for flexible photonics. Opt. Mater. 106, 109994. doi:10.1016/j.optmat.2020.109994
Martin, B., Wondraczek, L., Deubener, J., and Yue, Y. (2005). Mechanically induced excess enthalpy in inorganic glasses. Appl. Phys. Lett. 86 (12), 121917. doi:10.1063/1.1895483
Morandotti, A., and Zuccato, D. (2018). How to improve mechanical resistance of glass Syringes and Cartridges. PDA J. GMP Validation Jpn. 20 (1), 5–10. doi:10.11347/pda.20.5
Morozumi, H., Nakano, H., Yoshida, S., and Matsuoka, J. (2015). Crack initiation tendency of chemically strengthened glasses. Int. J. Appl. Glass Sci. 6 (1), 64–71. doi:10.1111/ijag.12089
Morris, D. J., Myers, S. B., and Cook, R. F. (2004). Indentation crack initiation in ion-exchanged aluminosilicate glass. J. Mater. Sci. 39 (7), 2399–2410. doi:10.1023/b:jmsc.0000020002.06117.46
Musil, J., Kunc, F., Zeman, H., and Poláková, H. (2002). Relationships between hardness, Young's modulus and elastic recovery in hard nanocomposite coatings. Surf. Coatings Technol. 154 (2), 304–313. doi:10.1016/S0257-8972(01)01714-5
Mysen, B. O., Virgo, D., and Kushiro, I. (1981). The structural role of aluminum in silicate melts—A Raman spectroscopic study at 1 atmosphere. Am. Mineralogist 66 (7-8), 678–701.
Mysen, B. (2021). Structure of aluminosilicate melts. ISIJ Int. 61 (12), 2866–2881. doi:10.2355/isijinternational.ISIJINT-2021-100
Oliver, W. C., and Pharr, G. M. (1992). An improved technique for determining hardness and elastic modulus using load and displacement sensing indentation experiments. J. Mat. Res. 7 (06), 1564–1583. doi:10.1557/JMR.1992.1564
Pönitzsch, A., Nofz, M., Wondraczek, L., and Deubener, J. (2016). Bulk elastic properties, hardness and fatigue of calcium aluminosilicate glasses in the intermediate-silica range. J. Non-Cryst. Solids 434, 1–12. doi:10.1016/j.jnoncrysol.2015.12.002
Ragoen, C., Cormier, L., Bidegaray, A. I., Vives, S., Henneman, F., Trcera, N., et al. (2018). A XANES investigation of the network-modifier cations environment before and after the Na+/K+ ion-exchange in silicate glasses. J. Non-Cryst. Solids 479, 97–104. doi:10.1016/j.jnoncrysol.2017.10.021
Ragoen, C., Marple, M. A. T., Sen, S., Lambricht, T., and Godet, S. (2017a). Structural modifications induced by Na+/K+ ion exchange in silicate glasses: A multinuclear NMR spectroscopic study. J. Non-Cryst. Solids 474, 9–15. doi:10.1016/j.jnoncrysol.2017.08.006
Ragoen, C., Sen, S., Lambricht, T., and Godet, S. (2017b). Effect of Al2O3 content on the mechanical and interdiffusional properties of ion-exchanged Na-aluminosilicate glasses. J. Non-Cryst. Solids 458, 129–136. doi:10.1016/j.jnoncrysol.2016.12.019
Ray, N. H. (1974). Composition—Property relationships in inorganic oxide glasses. J. Non-Cryst. Solids 15 (3), 423–434. doi:10.1016/0022-3093(74)90148-3
Ren, M., Cheng, J. Y., Jaccani, S. P., Kapoor, S., Youngman, R. E., Huang, L., et al. (2019). Composition – structure – property relationships in alkali aluminosilicate glasses: A combined experimental – computational approach towards designing functional glasses. J. Non-Cryst. Solids 505, 144–153. doi:10.1016/j.jnoncrysol.2018.10.053
Rouxel, T. (2015). Driving force for indentation cracking in glass: Composition, pressure and temperature dependence. Phil. Trans. R. Soc. A 373, 20140140. (2038). doi:10.1098/rsta.2014.0140
Rouxel, T. (2007). Elastic properties and short-to medium-range order in glasses. J. Am. Ceram. Soc. 90 (10), 3019–3039. doi:10.1111/j.1551-2916.2007.01945.x
Rouxel, T., Jang, J.-i., and Ramamurty, U. (2021). Indentation of glasses. Prog. Mater. Sci. 121, 100834. doi:10.1016/j.pmatsci.2021.100834
Rouxel, T., Ji, H., Hammouda, T., and Moreac, A. (2008). Poisson's ratio and the densification of glass under high pressure. Phys. Rev. Lett. 100 (22), 225501–225504. doi:10.1103/Physrevlett.100.225501
Ryou, S.-Y., Lee, C.-S., Cho, I.-S., and Amanov, A. (2020). Measurement of dynamic elastic modulus and Poisson’s ratio of chemically strengthened glass. Materials 13 (24), 5644. doi:10.3390/ma13245644
Shannon, R. (1976). Revised effective ionic radii and systematic studies of interatomic distances in halides and chalcogenides. Acta Cryst. Sect. A 32 (5), 751–767. doi:10.1107/S0567739476001551
Sheikh, M. Z., Atif, M., Raza, M. A., Suo, T., Li, Y., Zhou, F., et al. (2020). Damage propagation and dynamic material properties of aluminosilicate glass. J. Non-Cryst. Solids 547, 120313. doi:10.1016/j.jnoncrysol.2020.120313
Shelby, J. E. (2005). Introduction to glass science and technology. Cambridge, United Kingdom: Royal Society of Chemistry. doi:10.1039/9781847551160
Silverman, W. (1939). Effect of alumina on devitrification of soda‐lime‐silica glasses. J. Am. Ceram. Soc. 22, 378–384. doi:10.1111/j.1151-2916.1939.tb19484.x
Smedskjaer, M. M., Mauro, J. C., Kjeldsen, J., and Yue, Y. (2013). Microscopic origins of compositional trends in aluminosilicate glass properties. J. Am. Ceram. Soc. 96 (5), 1436–1443. doi:10.1111/jace.12298
Stevensson, B., and Edén, M. (2006). Efficient orientational averaging by the extension of Lebedev grids via regularized octahedral symmetry expansion. J. Magnetic Reson. 181 (1), 162–176. doi:10.1016/j.jmr.2006.04.008
Sun, H., and Dugnani, R. (2020). A study on ion-exchanged, soda-lime glass’s residual stress relationship with K+/Na+ concentration. Int. J. Appl. Glass Sci. 11 (1), 134–146. doi:10.1111/ijag.14077
Sun, H., Hödemann, S., and Dugnani, R. (2019). Characterization of shallow stress-profiles in chemically strengthened soda-lime glass. J. Non-Cryst. Solids 510, 130–142. doi:10.1016/j.jnoncrysol.2019.01.023
Sundberg, P., Grund Bäck, L., Orman, R., Booth, J., and Karlsson, S. (2019). Simultaneous chemical vapor deposition and thermal strengthening of glass. Thin Solid Films 669, 487–493. doi:10.1016/j.tsf.2018.11.028
Svenson, M. N., Bechgaard, T. K., Fuglsang, S. D., Pedersen, R. H., Tjell, A. Ø., Østergaard, M. B., et al. (2014). Composition-structure-property relations of compressed borosilicate glasses. Phys. Rev. Appl. 2 (2), 024006. doi:10.1103/PhysRevApplied.2.024006
Svenson, M. N., Mauro, J. C., Rzoska, S. J., Bockowski, M., and Smedskjaer, M. M. (2017). Accessing forbidden glass regimes through high-pressure sub-tg annealing. Sci. Rep. 7, 46631. doi:10.1038/srep46631
Svenson, M. N., Thirion, L. M., Youngman, R. E., Mauro, J. C., Bauchy, M., Rzoska, S. J., et al. (2016). Effects of thermal and pressure histories on the chemical strengthening of sodium aluminosilicate glass. Front. Mat. 3, 14. doi:10.3389/fmats.2016.00014
Takahashi, S., Neuville, D. R., and Takebe, H. (2015). Thermal properties, density and structure of percalcic and peraluminus CaO–Al2O3–SiO2 glasses. J. Non-Cryst. Solids 411 (0), 5–12. doi:10.1016/j.jnoncrysol.2014.12.019
Talimian, A., and Sglavo, V. M. (2017). Ion-exchange strengthening of borosilicate glass: Influence of salt impurities and treatment temperature. J. Non-Cryst. Solids 456, 12–21. doi:10.1016/j.jnoncrysol.2016.10.032
Tandia, A., Vargheese, K. D., Mauro, J. C., and Varshneya, A. K. (2012). Atomistic understanding of the network dilation anomaly in ion-exchanged glass. J. Non-Cryst. Solids 358 (2), 316–320. doi:10.1016/j.jnoncrysol.2011.09.034
Toplis, M. J., Dingwell, D. B., and Lenci, T. (1997). Peraluminous viscosity maxima in Na2O-Al2O3-SiO2 liquids: The role of triclusters in tectosilicate melts. Geochim. Cosmochim. Acta 61 (13), 2605–2612. doi:10.1016/S0016-7037(97)00126-9
Varshneya, A. K., and Bihuniak, P. P. (2018). Cover screens for personal electronic devices: Strengthened glass or sapphire. Am. Ceram. Soc. Bull. 96, 21–25.
Varshneya, A. K., and Kreski, P. K. (2012). “The chemistry of chemical strengthening of glass,” in Processing, properties, and applications of glass and optical materials. Editors A. K. Varshneya, H. A. Schaeffer, K. A. Richardson, M. Wightman, and L. D. Pye (Hoboken, New Jersey: John Wiley & Sons), 107–114. doi:10.1002/9781118472590.ch12
Varshneya, A. K., Olson, G. A., Kreski, P. K., and Gupta, P. K. (2015). Buildup and relaxation of stress in chemically strengthened glass. J. Non-Cryst. Solids 427, 91–97. doi:10.1016/j.jnoncrysol.2015.07.037
Varshneya, A. K., Macrelli, G., Yoshida, S., Kim, S. H., Ogrinc, A. L., and Mauro, J. C. (2022). Indentation and abrasion in glass products: Lessons learned and yet to be learned. Int. J. Appl. Glass Sci. 13, 308–337. doi:10.1111/ijag.16549
Varshneya, A. K. (2010a). Chemical strengthening of glass: Lessons learned and yet to Be learned. Int. J. Appl. Glass Sci. 1 (2), 131–142. doi:10.1111/j.2041-1294.2010.00010.x
Varshneya, A. K. (2010b). The physics of chemical strengthening of glass: Room for a new view. J. Non-Cryst. Solids 356 (44-49), 2289–2294. doi:10.1016/j.jnoncrysol.2010.05.010
Varshneya, A. K. (2016). Mechanical model to simulate buildup and relaxation of stress during glass chemical strengthening. J. Non-Cryst. Solids 433, 28–30. doi:10.1016/j.jnoncrysol.2015.11.006
Wallenberger, F. T., and Bingham, P. A. (2010). Fiberglass and glass technology: Energy-friendly compositions. New York: Springer. doi:10.1007/978-1-4419-0736-3
Wang, M., Smedskjaer, M. M., Mauro, J. C., Sant, G., and Bauchy, M. (2017). Topological origin of the network dilation anomaly in ion-exchanged glasses. Phys. Rev. Appl. 8 (5), 054040. doi:10.1103/PhysRevApplied.8.054040
Webb, S. L., Banaszak, M., Köhler, U., Rausch, S., and Raschke, G. (2007). The viscosity of Na2O-CaO-Al2O3-SiO2 melts. Eur. J. Mineral. 19 (5), 681–692. doi:10.1127/0935-1221/2007/0019-1765
Weigel, C., Le Losq, C., Vialla, R., Dupas, C., Clément, S., Neuville, D. R., et al. (2016). Elastic moduli of XAlSiO4 aluminosilicate glasses: Effects of charge-balancing cations. J. Non-Cryst. Solids 447, 267–272. doi:10.1016/j.jnoncrysol.2016.06.023
Wondraczek, L., Mauro, J. C., Eckert, J., Kühn, U., Horbach, J., Deubener, J., et al. (2011). Towards ultrastrong glasses. Adv. Mat. 23 (39), 4578–4586. doi:10.1002/adma.201102795
Xiaoyu, L., Liangbao, J., Iman, M., John, P. D., Lei, L., and Yue, Y. (2018). New insights into nanoindentation crack initiation in ion‐exchanged sodium aluminosilicate glass. J. Am. Ceram. Soc. 101 (7), 2930–2940. doi:10.1111/jace.15465
Xue, X., and Stebbins, J. F. (1993). 23Na NMR chemical shifts and local Na coordination environments in silicate crystals, melts and glasses. Phys. Chem. Min. 20 (5), 297–307. doi:10.1007/BF00215100
Yetna N'Jock, M., Roudet, F., Idriss, M., Bartier, O., and Chicot, D. (2016). Work-of-indentation coupled to contact stiffness for calculating elastic modulus by instrumented indentation. Mech. Mater. 94, 170–179. doi:10.1016/j.mechmat.2015.12.003
Yoshida, S., Hidaka, A., and Matsuoka, J. (2004). Crack initiation behavior of sodium aluminosilicate glasses. J. Non-Cryst. Solids 344 (1-2), 37–43. doi:10.1016/J.Jnoncrysol.2004.07.019
Yoshida, S. (2019). Indentation deformation and cracking in oxide glass –toward understanding of crack nucleation. J. Non-Cryst. Solids X 1, 100009. doi:10.1016/j.nocx.2019.100009
Yu, Y., Stevensson, B., and Edén, M. (2020). A unified 23Na NMR chemical shift correlation with structural parameters in multicomponent silicate-based glasses. J. Am. Ceram. Soc. 103 (2), 762–767. doi:10.1111/jace.16852
Yue, Y. Z., Christiansen, J. d., and Jensen, S. L. (2002). Determination of the fictive temperature for a hyperquenched glass. Chem. Phys. Lett. 357 (1), 20–24. doi:10.1016/S0009-2614(02)00434-7
Zaccaria, M., Dubru, M., Lucca, N., and Šikyňová, A. (2021). Chemically strengthened glass for architectural applications. Ce. Pap. 4 (6), 135–144. doi:10.1002/cepa.1626
Zanotto, E. D., and Mauro, J. C. (2017). The glassy state of matter: Its definition and ultimate fate. J. Non-Cryst. Solids 471, 490–495. doi:10.1016/j.jnoncrysol.2017.05.019
Zhang, Z., Soga, N., and Hirao, K. (1995). Indentation deformation and fracture of densified silicate glass. J. Mater. Sci. 30 (24), 6359–6362. doi:10.1007/BF00369689
Zheng, Q., Zhang, Y., Montazerian, M., Gulbiten, O., Mauro, J. C., Zanotto, E. D., et al. (2019). Understanding glass through differential scanning calorimetry. Chem. Rev. 119 (13), 7848–7939. doi:10.1021/acs.chemrev.8b00510
Keywords: ion exchange, soda-lime-silicate glass, aluminosilicate glass, strengthening, nanoindentation, glass transition temperature, MAS NMR, network connectivity
Citation: Karlsson S, Mathew R, Ali S, Paemurru M, Anton J, Stevensson B and Edén M (2022) Mechanical, thermal, and structural investigations of chemically strengthened Na2O–CaO–Al2O3–SiO2 glasses. Front. Mater. 9:953759. doi: 10.3389/fmats.2022.953759
Received: 26 May 2022; Accepted: 02 September 2022;
Published: 06 October 2022.
Edited by:
Randall Youngman, Corning Inc., United StatesCopyright © 2022 Karlsson, Mathew, Ali, Paemurru, Anton, Stevensson and Edén. This is an open-access article distributed under the terms of the Creative Commons Attribution License (CC BY). The use, distribution or reproduction in other forums is permitted, provided the original author(s) and the copyright owner(s) are credited and that the original publication in this journal is cited, in accordance with accepted academic practice. No use, distribution or reproduction is permitted which does not comply with these terms.
*Correspondence: Stefan Karlsson, c3RlZmFuLmthcmxzc29uQHJpLnNl; Mattias Edén, bWF0dGlhcy5lZGVuQG1tay5zdS5zZQ==