 Guoping Qian1
 Xi Li
Xi Li- 1School of Traffic and Transportation Engineering, Changsha University of Science and Technology, Changsha, China
- 2Hunan Expressway Maintenance Engineering Co, Ltd., Changsha, China
- 3Sany Automobile Manufacturing Co, Ltd., Changsha, China
Phosphogypsum (PG), as a by-product of the production of phosphoric acid, faces the problems of large annual output and difficult treatment. There is a large demand for fillers in the process of road paving, which may be an effective method for the utilization of PG resources. In this study, three proportions of phosphogypsum–lime–fly ash (PLF) mixture were designed, first, according to orthogonal tests. The comprehensive performance of the PLF mixture was tested by the compression rebound modulus test, unconfined compressive strength test, flexural tensile strength test, dry shrinkage test, and temperature shrinkage test, respectively. The results show that adding crushed stone to the PLF mixture can effectively improve the compression rebound modulus, unconfined compressive strength, and flexural tensile strength. The high content of PG in the mixture can also improve the dry shrinkage and temperature shrinkage properties of the mixture. According to the road layer requirements, the optimum proportion of the PLF mixture is recommended, which may benefit the road construction and PG resources.
Introduction
Phosphogypsum (PG) is a by-product of phosphoric acid production. Its main component is calcium sulfate dihydrate (gypsum), and approximately 4.5 tons of PG is produced for every ton of phosphoric acid produced (Dvorkin et al., 2018). The global annual output of PG is about 200 million tons, and it is estimated that 85∼90% of the PG has not been used (Chernysh et al., 2021). In addition, lead, cadmium, copper, and other harmful substances contained in PG may penetrate the ground with rainwater when PG is piled up and exposed directly to the air (Saadaoui et al., 2017; Ben Chabchoubi et al., 2021). Therefore, rationally utilizing wasted PG has been an urgent problem to be solved, which will benefit the sustainable development of phosphoric acid enterprises and the ecological environment.
At present, the subgrade in road construction has a large demand for bonding materials such as cement and lime. PG may promote the formation of ettringite in cement materials and lime–fly ash soil and improve the early strength of fillers (Gu and Chen, 2020; Gu et al., 2020). The application of PG in road engineering is expected to realize the resource utilization of PG. Therefore, scholars carried out some research on how to apply PG to road construction and achieved important results.
Some scholars (Kumar and Dutta, 2014; Kumar et al., 2014; Kumar et al., 2015; Dutta and Kumar, 2016) found that modified bentonite with 8% PG can improve the unconfined compression strength (UCS) and recommended to use the fly ash–lime–phosphogypsum composite as the base course in road pavements. Al-Zaidyeen and Al-Qadi (2015); James and Pandian (2015); and de Rezende Lilian et al. (2017) found that adding PG to lime–fly ash soil can improve the strength of lime–fly ash soil and meet the strength requirements of the lime–fly ash stabilization subgrade of the expressway. Zhang et al. (2020) used PG as a modifier to improve the semi-rigid material of subgrade and found that PG could improve the strength and water stability of the original base material, which further confirmed the feasibility of PG as a roadbed filler. However, the reported content of PG is almost less than 22%, which is far from meeting the demand for large-scale utilization of PG.
Some scholars tried to increase the content of PG in the lime–fly ash mixture. Rashad (2017) and Zeng et al. (2021) pointed out that ettringite produced by PG can effectively improve the strength of materials, but the volume of ettringite produced is greater than that of PG. Combined with field investigation and laboratory tests, Ding et al.(2019) found that the amount of PG must be controlled within a reasonable range; otherwise, the PG-modified stabilized soil would swell. Li et al. (2014) found that adding PG as an anti-cracking agent to the inorganic binder base layer can effectively reduce shrinkage caused by changes in temperature and humidity. The content of PG in the anti-cracking agent was less than 7%. It can be found that excessive addition of PG may cause volume expansion and induce damage to the road structure, which will harm the long-term safety service of the road. To utilize more waste, it is necessary to avoid volume expansion on the pavement base at the same time (Colman et al., 2020). Therefore, there is a reasonable proportion of PG added in the PLF mixture.
A series of mechanical tests were carried out in this paper to analyze the compression rebound modulus, unconfined compressive strength, flexural tensile strength, drying shrinkage, and temperature shrinkage properties with three different proportions of PG in the PLF mixture. The optimum proportion of PG that satisfies the mechanical demand for road pavement and costs as less as possible is recommended.
Design of the Proportion of the PLF Mixture
Material Properties
PG
PG is obtained from the industrial waste of Kailin Group in Guizhou Province, China. It is a gray–white powdery solid with a specific surface area of 3,250 cm2/g and a specific gravity of 1.9. Firstly, the chemical composition analysis of PG was carried out, and the results are shown in Table 1.

TABLE 1. Main chemical composition of PG.
Lime and Fly Ash
The lime used in the test is grade III slaked lime obtained by the digestion of quicklime. The fly ash comes from a thermal power plant in Zhuzhou, and the chemical composition is shown in Table 2.
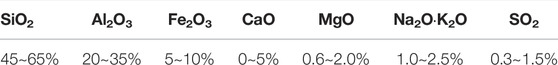
TABLE 2. Chemical composition of fly ash.
Crushed Stone
Granite is selected as the crushed stone, and the crushing value, density, and water absorption of the crushed stone are shown in Table 3.

TABLE 3. Crushed stone performance test.
It can be found from Table 3 that the properties of crushed stone meet the requirements of Pebble and Crushed Stone for Building (GB/T 14685-2001, 2001). The skeleton formed by the crushed stone has a key influence on the stability of the structural system (Cai et al., 2022). The screening test is carried out on the qualified crushed stone, and the aggregate gradation curve is obtained as shown in Figure 1.
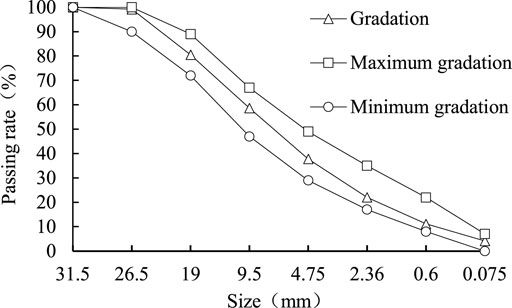
FIGURE 1. Aggregate gradation curve.
Mix Proportion Design
Some scholars had conducted in-depth research on the mixing proportion of PG-modified lime mixture. Ghosh (2010) suggested that the content of lime should be controlled below 10%. To improve the early strength and seven-day compressive strength of the PG–lime mixture, Shen et al. (2007) and Shen et al. (2008) gave a more precise range, that is, the content of lime should be between 6 and 10%, the content of PG should be between 23 and 46%, and the ratio of PG to lime should be controlled within 1:1∼1:3. Mashifana et al. (2018) pointed out that when the content of PG is between 10 and 50%, PG can improve the early strength of the mixture. Folek et al. (2011) suggested that the proportion of PG in the ash mixes should be between 50 and 60%. Nine groups of specimens with different mix proportions (as shown in Table 4) were made in this study, cured, and formed under standard conditions, and early strength tests were carried out respectively. Three groups—A, B, and C—with high early strength and high PG content were selected to further test the strength, temperature shrinkage, and drying shrinkage of the mixture, respectively.
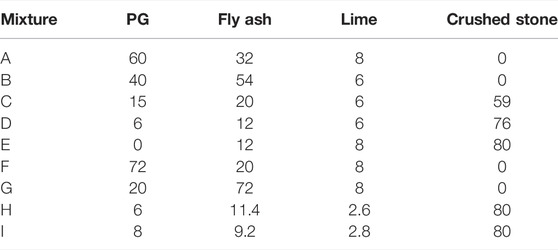
TABLE 4. Mixing proportion of the PLF mixture.
Compaction Test and Optimum Moisture Content
Compaction Test
Compaction tests were carried out to determine the optimal water content in the three mix proportions: A, B, and C considering the particle size in the mixture may influence the result of the compaction test (Li et al., 2020; Li et al., 2021). The test process is strictly conducted by JTG E51-2009 (2009). Specimens were prepared according to the predetermined moisture content. Samples were placed in a 152 mm cylinder and compacted in layers. After the samples were compacted, the moisture content of the samples was measured.
Optimum Moisture Content
The dry density and moisture content of the specimens of three different mix proportions were obtained from the compaction test, as shown in Table 5.
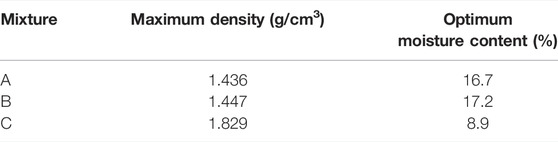
TABLE 5. Maximum dry density and optimum water content of the mixture.
Mechanical Property Test and Results
Compression Rebound Modulus Test and Analysis
Three groups of cylindrical specimens with a diameter of 150 mm and a height of 150 mm were prepared. The specimens were formed by static pressing and cured in a standard curing room (temperature: 20 ± 2°C; humidity: ≥95%). Each group of specimens has three curing times of 28, 90, and 180 days, respectively. The loading test process is as follows.
After wiping the specimens soaked in water for 1 day with a dry rag, smoothing the surface protrusion with a spatula, and then filling the uneven surface with fine sand, two preload tests of loading and unloading were performed on the specimen using half of the maximum load. The loading pressure is divided into five levels which are gradually applied from small to large. The data were recorded after the load was applied for 1 min, and then the load was removed to recover the elastic deformation of the specimen. The measured unit pressure was recorded, and then the compression rebound modulus was calculated from Formula 1. The relationship between compression rebound modulus and time is shown in Figure 2.
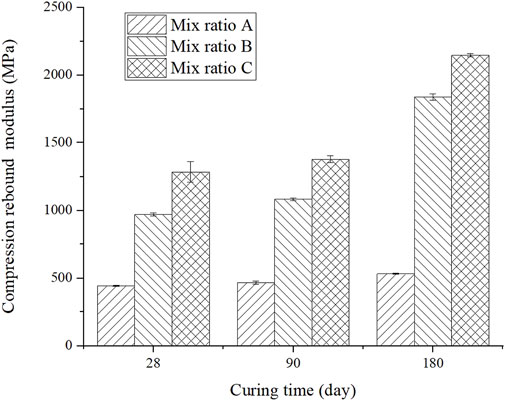
FIGURE 2. Relationship between curing time and compression rebound modulus.
The compression rebound modulus is obtained by the following formula:
where Ec is the compression rebound modulus of the cylinder (MPa), p is the unit pressure (MPa), h is the height of the cylindrical specimen (mm), and l is the rebound deformation of the cylindrical specimen (mm).
It can be found from Figure 2 that the compression rebound modulus of the three mixtures increases with the increase of curing time. However, the growth rate of compression rebound modulus gradually declines. This is because the early stiffness of each proportion is mainly determined by the modulus of the raw material itself and the structural form of the material. In the early stage of the reaction, more and more binders are produced with cutting time, and the connectivity and integrity between particles are getting stronger and stronger, which is manifested as an increasing modulus of resilience. The decrease in the growth rate of compression rebound modulus is because the amount of binder produced decreases with curing time.
Comparing the compression rebound modulus of the three kinds of PLF mixtures at the same age, the relationship is C > B > A. The compression rebound modulus of the specimens of proportion C is the largest, and the compression rebound modulus of proportion C in 180 days is greater than that of lime–fly ash–cement stabilized macadam (Chen et al., 2009). Proportion C contains a large amount of crushed stone. The lime content of proportions A and B is similar, while the compression rebound modulus of the specimens of proportion B is greater than that of the specimens of proportion A at the same age. This is because the amount of PG is too much for the A mixture. Part of the PG did not participate effectively in the reaction with fly ash. It can be concluded that excessive PG will reduce the compression rebound modulus of the mixture.
Unconfined Compression Strength Tests and Analysis
Three sets of specimens with a diameter and height of 150 mm were prepared according to the three mix proportions of A, B, and C. The specimens were molded and cured in a standard curing room for three proportions (temperature 20 ± 2°C, humidity ≥95%). There were 72 specimens, and each mixing proportion had 24 specimens. Each curing age corresponds to six specimens, and the curing age is 7, 28, 90, and 180 days, respectively.
The UCS test was carried out with a press, and the surface of the instrument was cleaned before the test. The upper and lower ends of the specimen were smoothed with oil and placed in the center of the instrument.
The UCS can be obtained according to Eqs 2, 3. The test data are shown in Figure 3.
where P is the maximum pressure when the cylinder is damaged by compression (N), R is the unconfined compression strength of the cylinder (MPa), A is the cross-sectional area of the cylindrical specimen (mm2), and D is the diameter of the cylinder.

FIGURE 3. Relationship between curing time and unconfined compression strength.
As can be seen from Figure 3, the strengths of the three mixtures increase continuously with age. The compression strength in order from largest to smallest is C, B, and A. The specimens of proportion C contain crushed stone, while the specimens of proportions A and B do not. The average strength growth rate of the three mix proportions before 28 days is greater than that after 28 days. As the pozzolanic reaction between fly ash and lime is relatively violent at the beginning, more bases of PG were formed which are the gels. The reaction material decreases, and the reaction relatively weakens with age, so the growth rate of strength becomes slower. Kumar and Dutta (2014) illustrated that PG-modified bentonite can effectively improve the strength. The 28-day UCS of modified bentonite was around 1 MPa which is lower than the strength of the mixture in this research. Kumar Dutta et al. (2017) studied a fly ash mixture of 2% PG and 8% lime and showed that the axial stress of the mixture cured for 90 days in the UCS test was around 3 MPa. The UCS of mixture ratio A at 90 days in this research is about 3.4 MPa which is relatively higher than the strength of mixture in Dutta’s research. This is because the ratio of PG to lime is completely different. The ratio of PG to lime in this study is higher than that in Dutta’s study. PG reacts with lime more completely and fully.
According to the criteria of JTG D50-2017, 2017 (CCCC Road and Bridge Technology Co., 2017), the mix proportions A and B are suitable for the base course of heavy traffic class II and below. The mix proportion C is suitable for subgrade of extremely heavy traffic class II and below.
Flexural Tensile Strength Tests and Analysis
Four specimens for each mixture proportion were used for parallel testing. The specimens with the size of 100 mm × 100 mm × 400 mm were formed by static pressing. The specimens were cured for 180 days in a standard curing room with a temperature of 20 ± 2°C and humidity ≥95%. The flexural strength test was performed using an MTS machine. The overall stiffness of the test frame was 11.0 × 10⁹ N/m, the maximum axial force was 4600 kN, and the maximum axial tensile force was 2300 kN. The testing process was carried out by JTG E51-2009 (Transport, 2009). The rate of loading was controlled at 50 mm/min.
The ultimate load P of the fracture of the specimen was recorded, and the flexural tensile strength of the specimen was calculated by Formula 4. The average value of the data obtained from the test is shown in Table 6.
where Rs is the flexural tensile strength of the specimen (MPa), P is the ultimate load of the specimen (N), L is the distance between the two fulcrums (mm), h is the height of the specimen (mm), and b is the width of the specimen (mm).
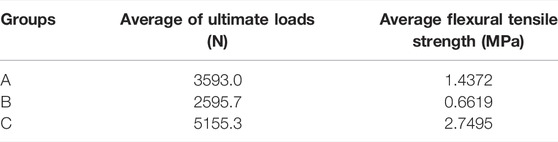
TABLE 6. Flexural tensile strength of the specimen.
It can be seen from Table 6 that the flexural tensile strength of the specimens of proportion C is the largest, followed by A and B. As the crushed stone was added to the specimens of proportion C, the compression strength of the specimens of proportion C was effectively increased by the indentation force and internal frictional resistance between the skeletons in the upper half specimen. The mixture of gypsum and fly ash provides the cohesive force which increases the ultimate load and the flexural tensile strength of the specimen.
The ultimate load and flexural tensile strength of the specimens of proportion A are greater than those of B. Because the PG content of the specimens of proportion A increased by 20% compared with that of B, lime reacts with fly ash to form hydrated calcium aluminate and further reacts with calcium sulfate dihydrate contained in PG to form trisulfide hydrated calcium aluminate (ettringite). Most ettringite converts to monosulfide hydrated calcium aluminate which is further crosslinked with a small part of ettringite crystals with age. The mixture joins into a denser whole, which increases the flexural tensile strength of the specimen (Dong et al., 2002). The ratio of fly ash to lime in the specimens of proportion A is higher than that of B. The pozzolanic reaction between fly ash and lime is sufficient to generate more hydrated calcium aluminates. Calcium aluminate hydrates react continuously with PG to generate calcium vanadate and single sulfur calcium aluminate, which improves the overall strength of the mixture.
According to Specifications for Design of Highway Asphalt Pavement (CCCC Road and Bridge Technology Co., 2017), the mix proportions of A, B, and C meet the flexural tensile strength requirements of lime–fly ash soil. The mix proportions of A and C also meet the flexural tensile strength requirements of lime–fly ash stabilized granular material.
Shrinkage Tests and Analysis
Dry Shrinkage Test
The molding size of the dry shrinkage test specimen is 100 mm × 100 mm × 400 mm. The curing room had a temperature of 20 ± 2°C and humidity ≥95% for 7 days. After grinding the long axis end of the specimen, plexiglass sheets were bonded on the two ends of the long axis. Then, dial indicators were installed on the glass at both ends, and a certain number of steel balls were placed on the lower edge of the specimen to reduce the friction between the specimen and the instrument. The schematic diagram of the drying shrinkage test device is shown in Figure 4. The temperature was controlled at 20 ± 2°C, and the relative humidity was 60 ± 5% in the testing room. The drying shrinkage characteristics of the specimen were measured with a shrinkage tester.
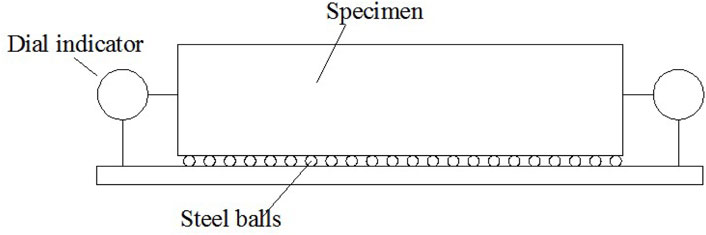
FIGURE 4. Schematic diagram of the drying shrinkage test device.
According to JTG E51-2009 (Transport, 2009), the drying shrinkage strain ε and the drying shrinkage parameter α were used to evaluate the drying shrinkage characteristics of the material:
where ε is the shrinkage per unit length of the specimen (×10–3), α is the proportion of the dry shrinkage strain to the rate of lost water (×10–6), ΔL is the overall shrinkage of the specimen (×10−3mm), L is the total length of the specimen (mm), and Δω is the proportion of the accumulated water loss to the dry weight of the specimen (%).
After the specimen was moved into the shrinkage room, the overall shrinkage and the rate of water loss of the specimen were recorded once a day. Figure 5 shows the relationship between drying shrinkage strain and time.
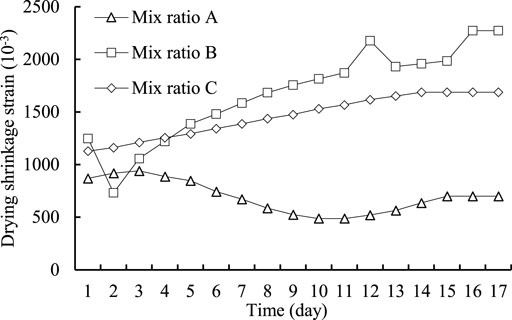
FIGURE 5. Relationship between drying shrinkage strain and time.
The drying shrinkage strain reflects the shrinkage per unit length of the specimens. Selçuk (Türkel and Aksin, 2012) studied the drying shrinkage of solid bricks with PG additive and found that the drying shrinkage of the bricks increased with the increase of the PG ratio. Both A and B mix ratios in this research exceeded the maximum PG ratio of 30% in Selçuk’s study. Thus, it is necessary to measure the drying shrinkage of the specimens in this research. It can be seen from Figure 5 that the specimens of proportion A have the best anti-dry shrinkage ability because the content of PG in the specimens of proportion A is the largest and a large amount of calcium sulfate dihydrate contained in the PG reacts with calcium aluminate hydrate to form ettringite. Monosulfur calcium aluminate hydrate leads to volume expansion, and the phenomenon of reduction of drying shrinkage strain in Figure 5 appears. The drying shrinkage strains of the specimens of proportions B and C increased with time, but the growth rate kept decreasing. The dry shrinkage strain of the specimens of proportion B was greater than that of C after the fifth day. The structure is relatively stable because the specimens of proportion C contain an aggregate skeleton. The total drying shrinkage of specimens contained in PG in the study of Selçuk (Türkel and Aksin, 2012) is around 6,000 × 10–3, which is greater than the total drying shrinkage of specimens in this research. Higher drying shrinkage is detrimental to the performance of the mixture, while smaller drying shrinkage indicates better volume stability of the mixture. Relatively speaking, the mixing ratio in this study performed better because of lower drying shrinkage.
It can be found from Figure 6 that the cumulative rate of water losses of the three mix proportions increased continuously over time. The cumulative rate of water loss of the specimens of proportions A and B is much higher than that of C. Because the water content of the specimens of proportion C is the lowest, the cumulative rate of water loss is the lowest. The rate of water loss of the specimens of proportion C remained stable after the fifth day.

FIGURE 6. Relationship between the cumulative rate of water loss and time.
Figure 7 shows that the drying shrinkage parameter of the three specimens decreased continuously with the increase of time. The drying shrinkage of the specimen of proportion C is the largest, followed by B and A. This is because the drying shrinkage parameter is the result of the combined effect of the drying shrinkage strain and the rate of water loss. The rate of water loss increases with the increase of the dry shrinkage strain and decreases with the increase of the rate of water loss. The specimens of proportion C have the lowest moisture content, and the drying shrinkage parameter of the specimens of proportion C is greater than that of A and B. The drying shrinkage strain of the specimens of proportion A is the smallest, and the rate of water loss is the largest, so the drying shrinkage of the specimens of proportion A is the smallest.
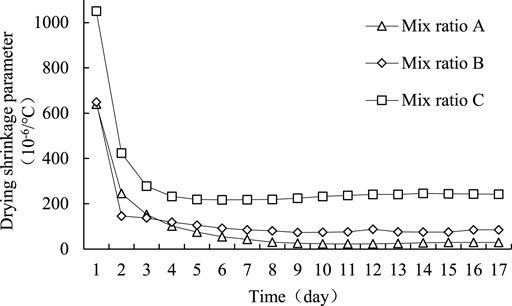
FIGURE 7. Relationship between the drying shrinkage parameter and time.
Temperature Shrinkage Tests
The specimens were formed by static pressing in the size of 100 mm × 100 mm × 400 mm. The specimens were cured in a standard curing room for 7 days with a temperature of 20 ± 2°C and humidity ≥95%. The last day of the curing period was saturated with water for 24 h. After curing, the temperature shrinkage parameter was measured by the resistance strain gauge method. The specimens were dried to constant weight and then placed in an environmental chamber at 50°C. The strain device and strain gauge were connected with the specimens. The environmental box was set to drop by 10°C every 2 h, and we waited for the data of the strain gauge in each temperature segment to stabilize (2 h). The data were read until the temperature dropped to 0°C. The effects of lime and fly ash content are important to the temperature shrinkage coefficient. The content of lime and fly ash in this research is higher than the content in Qian’s research (Ma et al., 2013). The temperature shrinkage of high content of lime and fly ash was not clear enough. To study the influence of high content of lime and fly ash with PG, it is vital to investigate the temperature shrinkage test in the mixture. The test results are shown in Figure 8.
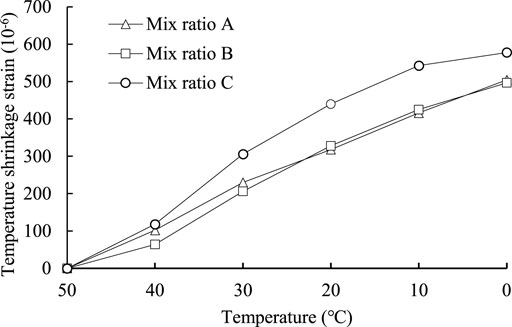
FIGURE 8. Relationship between shrinkage strain and temperature.
It can be found from Figure 8 that the shrinkage strain of the specimens shows an overall increasing trend with the decrease in temperature. The shrinkage strain of the specimens of proportion C is significantly larger than that of A and B. The greater the water loss rate, the smaller the temperature shrinkage deformation; the smaller the water loss rate, the greater the temperature shrinkage deformation (Li, 2002). This leads to a larger temperature shrinkage strain in the specimens of proportion A. The standard deviations of the temperature shrinkage strains of the three mix proportions are σA = 173.77, σB = 181.05, and σC = 213.46. Among the three mix proportions, the proportion of A is the least affected by the temperature.
Conclusion
In this research, three kinds of PLF mixture specimens with high early strength and large differences in PG content were selected. The specimens underwent compression strength tests, flexural tensile tests, drying shrinkage tests, and temperature shrinkage tests, respectively. The following conclusions were drawn:
1) The compression rebound modulus of PLF mixtures increases with time, but the growth rate keeps declining. The compression rebound modulus of PLF mixtures decreases with the increase of the content of PG.
2) According to the compression strength of the mix proportions of A, B, and C, three proportions are suitable for the subbase of heavy traffic class II and below. The mix proportion of C is suitable for the base layer of extremely heavy and extra heavy traffic class II and below.
3) The three proportions all meet the flexural tensile strength requirements of lime–fly ash soil materials, of which A and C also meet the flexural tensile strength requirements of lime–fly ash stabilized granular material. The flexural tensile strengths of the three mix proportions are C > A > B in descending order. The addition of crushed stone can significantly improve the flexural tensile strength of the mixture.
4) The high content of PG is more favorable than the high content of fly ash to improve the flexural tensile strength of the mixture.
5) The dry shrinkage and temperature shrinkage of the PLF mixture may be improved with the increasing content of PG. Combining the mechanical requirements of road construction for the fillers and PG adopted as much as possible, it is recommended to choose proportion A in the actual road construction (GB/T 14685-2001, 2001; JTG E51-2009, 2009; JTG D50-2017, 2017).
Data Availability Statement
The original contributions presented in the study are included in the article/Supplementary Material, and further inquiries can be directed to the corresponding author.
Author Contributions
GQ provided the ideas and guided the entire experiment. YZ and HP conducted experiments and data analysis and completed the manuscript. XL directed data analysis and manuscript writing and checking. JS and ZH contributed to the writing, translation, and verification of the manuscript. All authors have read and agreed to the published version of the manuscript.
Funding
This research was supported by the National Science Foundation of Hunan Province, China (No. 2020JJ5576), the Science and Technology Innovation Program of Hunan Province (2020RC4048), and the Excellent Youth Project of Hunan Province Department of Education (No. 19B030). The corresponding author would like to acknowledge the support of the China Scholarship Council.
Conflict of Interest
JS was employed by the company Hunan Expressway Maintenance Engineering Co., Ltd., and ZH was employed by the company Sany Automobile Manufacturing Co., Ltd.
The remaining authors declare that the research was conducted in the absence of any commercial or financial relationships that could be construed as a potential conflict of interest.
Publisher’s Note
All claims expressed in this article are solely those of the authors and do not necessarily represent those of their affiliated organizations, or those of the publisher, the editors, and the reviewers. Any product that may be evaluated in this article, or claim that may be made by its manufacturer, is not guaranteed or endorsed by the publisher.
Acknowledgments
The authors would like to thank all their enthusiastic colleagues, editors, and reviewers who provided guidance and advice on this article.
References
Al-Zaidyeen, S. M., and Al-Qadi, A. N. (2015). Effect of Phosphogypsum as a Waste Material in Soil Stabilization of Pavement Layers. Jordan J. Civ. Eng. 9, 1–7. doi:10.12816/0024473
Ben Chabchoubi, I., Bouguerra, S., Ksibi, M., and Hentati, O. (2021). Health Risk Assessment of Heavy Metals Exposure via Consumption of Crops Grown in Phosphogypsum-Contaminated Soils. Environ. Geochem Health 43, 1953–1981. doi:10.1007/s10653-020-00777-y
Cai, J., Song, C., Gong, X., Zhang, J., Pei, J., and Chen, Z. (2022). Gradation of Limestone-Aggregate-Based Porous Asphalt Concrete under Dynamic Crushing Test: Composition, Fragmentation and Stability. Constr. Build. Mater. 323, 126532. doi:10.1016/j.conbuildmat.2022.126532
Chen, Y., Li, Z., and Wang, X. (2009). “Research on Rapid Curing Technology of Lime-Flyash-Cement Stabilized Macadam,” in ICCTP 2009: Critical Issues in Transportation Systems Planning (Harbin, China: Development, and Management), 1–8. doi:10.1061/41064(358)50
Chernysh, Y., Yakhnenko, O., Chubur, V., and Roubík, H. (2021). Phosphogypsum Recycling: a Review of Environmental Issues, Current Trends, and Prospects. Appl. Sci. 11, 1575. doi:10.3390/app11041575
Colman, C., Bulteel, D., Rémond, S., Zhao, Z., and Courard, L. (2020). Valorization of Fine Recycled Aggregates Contaminated with Gypsum Residues: Characterization and Evaluation of the Risk for Secondary Ettringite Formation. Materials 13, 4866. doi:10.3390/ma13214866
De Rezende Lilian, R., Curado Tallyta Da, S., Silva Millena, V., Mascarenha Márcia Maria Dos, A., Metogo Daniel Arthur, N., Neto Manoel Porfirio, C., et al. (2017). Laboratory Study of Phosphogypsum, Stabilizers, and Tropicsal Soil Mixtures. J. Mater. Civ. Eng. 29, 04016188. doi:10.1061/(ASCE)MT.1943-5533.0001711
Ding, J., Shi, M., Liu, W., and Wan, X. (2019). Failure of Roadway Subbase Induced by Overuse of Phosphogypsum. J. Perform. Constr. Facil. 33, 04019013. doi:10.1061/(ASCE)CF.1943-5509.0001278
Dong, M., Ling, T., and Xu, J. (2002). Action Mechanism of Phosphogypsum on Semi-rigid Base Material. China J. Highw. Transp. 15 (2), 14–18. doi:10.19721/j.cnki.1001-7372.2002.02.004
Dutta, R. K., and Kumar, V. (2016). Suitability of Flyash-Lime-Phosphogypsum Composite in Road Pavements. Period. Polytech. Civ. Eng. 60, 455–469. doi:10.3311/PPci.7800
Dvorkin, L., Lushnikova, N., and Sonebi, M., 2018 Application Areas of Phosphogypsum in Production of Mineral Binders and Composites Based on Them: a Review of Research Results, MATEC Web Conf. EDP Sci. 149, 01012. doi:10.1051/matecconf/201814901012
Folek, S., Walawska, B., Wilczek, B., and Miśkiewicz, J. (2011). Use of Phosphogypsum in Road Construction. Pol. J. Chem. Technol. 13, 18–22. doi:10.2478/v10026-011-0018-5
GB/T 14685-2001 (2001). Pebble and Crushed Stone for Buildig. Beijing, China: Standards Press of China.
Ghosh, A. (2010). Compaction Characteristics and Bearing Ratio of Pond Ash Stabilized with Lime and Phosphogypsum. J. Mat. Civ. Eng. 22, 343–351. doi:10.1061/(ASCE)MT.1943-5533.0000028
Gu, K., and Chen, B. (2020). Loess Stabilization Using Cement, Waste Phosphogypsum, Fly Ash and Quicklime for Self-Compacting Rammed Earth Construction. Constr. Build. Mater. 231, 117195. doi:10.1016/j.conbuildmat.2019.117195
Gu, K., Chen, B., and Pan, Y. (2020). Utilization of Untreated-Phosphogypsum as Filling and Binding Material in Preparing Grouting Materials. Constr. Build. Mater. 265, 120749. doi:10.1016/j.conbuildmat.2020.120749
James, J., and Pandian, P. K. (2015). Effect of Phosphogypsum on Strength of Lime Stabilized Expansive Soil. Građevinar 66, 1109–1116. doi:10.14256/JCE.1097.2014
JTG D50-2017 (2017). Specifications for Design of Highway Asphalt Pavement. Hubei, China: Renmin Communication Press.
JTG E51-2009 (2009). Test Methods of Materials Stabilized with Inorganic Binders for Highway Engineering. Beijing, China: Renmin Communication Press.
Kumar Dutta, R., Khatri, V. N., and Panwar, V. (2017). Strength Characteristics of Fly Ash Stabilized with Lime and Modified with Phosphogypsum. J. Build. Eng. 14, 32–40. doi:10.1016/j.jobe.2017.09.010
Kumar, S., and Dutta, R. K. (2014). Unconfined Compressive Strength of Bentonite-Lime-Phosphogypsum Mixture Reinforced with Sisal Fibers. JORDAN J. Civ. Eng. 8, 239–250.
Kumar, S., Dutta, R. K., and Mohanty, B. (2014). Engineering Properties of Bentonite Stabilized with Lime and Phosphogypsum. Slovak J. Civ. Eng. 22, 35–44. doi:10.2478/sjce-2014-0021
Kumar, S., Dutta, R. K., and Mohanty, B. (2015). Potential of Bentonite-Lime-Mix Modified with Phosphogypsum and Reinforced with Sisal Fibres. Period. Polytech. Civ. Eng. 59, 143–154. doi:10.3311/PPci.7733
Li, B. (2002). Experimental Study on Temperature Shrinkage Property of Lime Fly Ash Macadam Base Material. J. China Foreign Highw., 70–72. Available at: https://kns.cnki.net/kcms/detail/detail.aspx?FileName=GWGL200202023&DbName=CJFQ2002.
Li, J., Zhang, Y., Mao, L., Zi, J., and Hu, T. (2014). “Laboratory Research on the Application of Phosphogypsum as an Anti-cracking Agent in a Cement-Treated Base,” in CICTP 2014: Safe, Smart, and Sustainable Multimodal Transportation Systems, 990–1002. doi:10.1061/9780784413623.096
Li, X., Zhang, K., Ma, X., Teng, J., and Zhang, S. (2020). New Method to Evaluate Strengthen Efficiency by Dynamic Compaction. Int. J. Geomechanics 20, 04020024. doi:10.1061/(ASCE)GM.1943-5622.0001586
Li, X., Yang, H., Zhang, J., Qian, G., Yu, H., and Cai, J. (2021). Time-domain Analysis of Tamper Displacement during Dynamic Compaction Based on Automatic Control. Coatings 11, 1092. doi:10.3390/coatings11091092
Ma, X. Q., Xue, X., and Cheng, X. P. (2013). Shrinkage Performance of Lime-Fly Ash Stabilized Crushed Stone. Adv. Mater. Res. Trans Tech Publ 779-780, 117–121. doi:10.4028/www.scientific.net/AMR.779-780.117
Mashifana, T. P., Okonta, F. N., and Ntuli, F. (2018). Geotechnical Properties and Microstructure of Lime-Fly Ash-Phosphogypsum-Stabilized Soil. Adv. Civ. Eng., 2018, 1–9. doi:10.1155/2018/3640868
Rashad, A. M. (2017). Phosphogypsum as a Construction Material. J. Clean. Prod. 166, 732–743. doi:10.1016/j.jclepro.2017.08.049
Saadaoui, E., Ghazel, N., Ben Romdhane, C., and Massoudi, N. (2017). Phosphogypsum: Potential Uses and Problems - a Review. Int. J. Environ. Stud. 74, 558–567. doi:10.1080/00207233.2017.1330582
Shen, W., Jiang, J., Zhang, L., Wang, K., and Zhou, M. (2008). Research on the Properties of Phosphogypsum Modified Lime Pavement Base Material. Highway, 2008 141–145. Available at: https://kns.cnki.net/kcms/detail/detail.aspx?FileName=GLGL200801035&DbName=CJFQ2008.
Shen, W., Zhou, M., and Zhao, Q. (2007). Study on Lime-Fly Ash-Phosphogypsum Binder. Constr. Build. Mater. 21, 1480–1485. doi:10.1016/j.conbuildmat.2006.07.010
Türkel, S., and Aksin, E. (2012). A Comparative Study on the Use of Fly Ash and Phosphogypsum in the Brick Production. Sadhana 37, 595–607. doi:10.1007/s12046-012-0099-8
Zeng, L.-L., Bian, X., Zhao, L., Wang, Y.-J., and Hong, Z.-S. (2021). Effect of Phosphogypsum on Physiochemical and Mechanical Behaviour of Cement Stabilized Dredged Soil from Fuzhou, China. Geomechanics Energy Environ. 25, 100195. doi:10.1016/j.gete.2020.100195
Keywords: mechanical properties, phosphogypsum–lime–fly ash, dry shrinkage properties, temperature shrinkage properties, subgrade
Citation: Qian G, Zhong Y, Li X, Peng H, Su J and Huang Z (2022) Experimental Study on the Road Performance of High Content of Phosphogypsum in the Lime–Fly Ash Mixture. Front. Mater. 9:935113. doi: 10.3389/fmats.2022.935113
Received: 03 May 2022; Accepted: 22 June 2022;
Published: 22 July 2022.
Edited by:
Zengfeng Zhao, Tongji University, ChinaReviewed by:
Rakesh Dutta, National Institute of Technology, Hamirpur, IndiaSaid Kenai, University of Blida, Algeria
Copyright © 2022 Qian, Zhong, Li, Peng, Su and Huang. This is an open-access article distributed under the terms of the Creative Commons Attribution License (CC BY). The use, distribution or reproduction in other forums is permitted, provided the original author(s) and the copyright owner(s) are credited and that the original publication in this journal is cited, in accordance with accepted academic practice. No use, distribution or reproduction is permitted which does not comply with these terms.
*Correspondence: Xi Li, bGl4aUBjc3VzdC5lZHUuY24=