 Weiya Jin1,2
 Yan Li
 Yuebing Li
 Mingjue Zhou
- 1Institute of Process Equipment and Control Engineering, Zhejiang University of Technology, Hangzhou, China
- 2College of Mechanical Engineering, Zhejiang University of Technology, Hangzhou, China
As an important material property in structural integrity assessment of nuclear power components, fracture toughness can be measured by single edge-notched bend (SENB) specimens or compact tension (CT) specimens. However, the tested values may be inhomogeneous with the crack size and specimen thickness. Some toughness scaling models (TSMs) were proposed to transfer the tested value to fracture toughness under small-scale yielding. Combined with the tested data by SENB specimens with different crack sizes and CT specimens with different thicknesses, the scaled fracture toughness is investigated on the global and local approaches to fracture. Using the scaled toughness values, the Weibull scale parameter K0 is estimated and compared for the ferritic steel DIN 22NiMoCr37 widely used in nuclear power plants. The results show that the estimated scale parameter K0 using the scaled toughness obtained by the global approach on the J-Q theory is reasonable in agreement with that of the local approach on the Weibull stress with a relative error of about 10%.
1 Introduction
Fracture toughness is a very important characteristic of a structural material indicating the resistance of a material to cracks, which is an indispensable input in the structural intensity assessment of nuclear power components containing cracks. As a key component in nuclear power plants, reactor pressure vessels are usually manufactured using ferritic steels, which presents a significantly ductile–brittle transition. In addition, the embrittlement effect caused by irradiation will increase the ductile–brittle transition temperature, which brings about the failure risk of brittle fracture.
Several geometry configurations can be used to measure the value of fracture toughness, including the single edge-notched bend (SENB) specimens or compact tension (CT) specimens, which are recommended in the test standards such as ASTM E1820 (ASTM International, 2020) and ISO 12135 (International Organization for Standardization, 2016). However, the fracture resistance depends on the specimen thickness and crack length, usually characterized by the out-of-plane and in-plane constraints on the macroscopic fracture mechanics. Some special provisions in the specimen thickness and crack length have been restricted in these test standards to obtain an effective value of fracture toughness for engineering assessment. It should be noted that the tested fracture toughness may be varied with the specimen configuration. Therefore, some toughness scaling models (TSMs) have been proposed to transfer the tested value to fracture toughness under small-scale yielding.
In order to explain the effect of crack length on the fracture toughness, a TSM is first proposed to transfer the tested value with a certain crack length to that with another crack size, with an assumption of the same critical stress on the crack head under plane strain (Dodds et al., 1991). Lately, O’Down and Shih proposed the J-Q theory to describe the stress field near the crack tip (O’dowd and Shih 1992; O’Dowd, 1995). The Q-parameter is now usually used to characterize the in-plane constraint due to the crack length. Compared with the crack opening stress, the fracture load for a certain specimen can be determined with the in-plane constraint parameter Q. Then, the fracture toughness can be scaled from different constraints. A model with T-stress to account for the in-plane constraint is provided in the R6 procedure (EDF Energy Nuclear Generation Ltd, 2015) for engineering practice. In addition, Ishihara et al. (2017) and Meshii and Ishihara (2018) proposed a T-scaling method for stress distribution scaling under small-scale yielding to scale the fracture toughness with the consideration of temperature dependence.
However, the toughness scaling models based on 2D plane strain models under small-scale yielding tend to overpredict the increment in toughness due to a loss of constraint (Link and Joyce, 1996). The thickness effect on the fracture toughness should be considered, which is usually described with the fracture toughness Jc corrected proportionally to the −1/2 power of thickness (Anderson et al., 1994). With the development of 3D crack-front stress fields, Guo (1995) and She and Guo (2007) introduced a parameter Tz as a function of thickness, which is successfully used to describe the effect of out-of-plane constraint on the fracture toughness. It should be noted that either parameter Q or Tz is usually limited to quantifying the in-plane or out-of-plane constraint separately. Several unified measure parameters of constraint are proposed to describe both in-plane and out-of-plane constraints, such as Ac (Mostafavi et al., 2010; Mostafavi et al., 2011; Nikishkov and Matvienko, 2016), Ap (Yang et al., 2013; Ma et al., 2016), and Ad (Xu et al., 2018; Zhen et al., 2021). It has been verified that these parameters can effectively characterize both in-plane and out-of-plane constraints.
In the above global approaches, the mean values of fracture toughness are usually focused, which has difficulty in explaining the scatter of the cleavage fracture toughness over the ductile–brittle transition (DBT) region. The local approach to fracture based on Weibull stress (Ruggieri and Dodds, 2018) can be used to describe the statistics feature of fracture toughness by a Weibull distribution. Then, one can scale the fracture toughness for constraint correction between cracked specimens of differing constraint levels with the same Weibull stress. In addition, the cleavage fracture probability can be calculated using the Weibull stress under different loading levels. Using local criterion based on the equivalence of Weibull stress, Ruggieri and Dodds (1996) successfully predicted the combined effects of loss of constraint. Gao et al. (1998), Gao and Dodds (2000), and Gao and Dodds Jr (2001) gave a simplified approach to assess constraint effects on cleavage fracture toughness of ferritic steels in the DBT region under plane strain, small-scale yielding conditions. A non-dimensional T-function is built up to scale fracture toughness values for constraint loss on the Weibull stress model. Based on Weibull stress, Smith et al. (2018) proposed an energy scaling mode to accurately predict cleavage fracture at quasi-static loading rates. The effect of blunt notches with varying root radii on the fracture behavior of SE(B) specimens is investigated using the Weibull stress-based toughness scaling model by Horn and Sherry (2010). The results show that different Weibull parameters will be obtained using notched specimens and conventional specimens containing pre-cracks. The test data and FE modeling results indicate that the effect of out-of-plane constraint loss on notch fracture toughness can be of the same order of magnitude as the in-plane effect of the notch radius alone (Horn et al., 2020). The local approach based on Weibull stress is also used to scale the fracture toughness of the sub-size specimens and compared with the standard specimens (Qian et al., 2018a; Ruggieri, 2020; Pan and Yin, 2021). Recently, Barbosa and Ruggieri (2020) investigated the thickness effect on fracture toughness based on the TSMs using the Weibull stress.
The fracture toughness from different constraint levels can be scaled by these TSMs developed by the global approach on the critical stress or the local approach on the Weibull stress. Therefore, the differences among these TSMs are compared and discussed in this work. Section 2 gives some detailed descriptions of the two types of TSMs. The data of fracture tests and finite element models are shown in Section 3. The scaled values of fracture toughness are obtained and discussed in Section 4. The last section gives some conclusions.
2 Toughness Scaling Models
2.1 Global Approach to J-Q Theory
The variations in fracture toughness resulting from the loss of constraint due to crack length are usually scaled by a 2D small-scale yielding (SSY) model. According to the critical stress, the scaling model compares the stress distribution in the tested specimen geometry with that of an infinite body under SSY, especially for the crack opening stress (Dodds et al., 1991). Then, the tested fracture toughness JIC by specimens can be transferred to the effective fracture toughness JSSY with the 2D SSY model, which denotes equivalent driving force for cleavage fracture on the critical stress over a microstructurally relevant volume. The effect of crack length on the fracture toughness tested by SENB specimens was successfully accounted for by the 2D SSY model. The tested fracture toughness results of deep crack specimens with a high constraint can be appropriately scaled for that of shallow crack specimens or structures with low constraint, as shown in Figure 1.
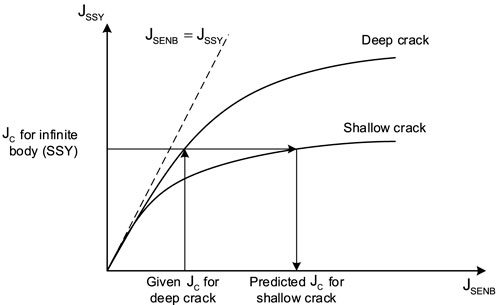
FIGURE 1. Schematic of the relationship between the J-integral values in SENB specimens for deep and shallow cracks with those of SSY conditions which generate equivalent opening mode stresses ahead of the crack tip.
The two-parameter J-Q theory can describe the near tip stress and strain states in a range of crack tip geometries. Parameter Q is determined from a finite element analysis and is the difference between the actual hoop stress and reference field hoop stress as follows:
where
The critical stress
With the assumption of finite strains, Neimitz et al. (2007) gave a modified scaling model on O’Dowd’s formula and generalized it for the arbitrary reference state. The corrected fracture toughness JCQ by the
where
For the thickness effect, Guo et al. proposed the
where
For the effect of thickness under the same in-plane constraint
Neimitz and Lipiec (2021) assumed that the
2.2 Local Approach to Weibull Stress
The fracture toughness presents a significant scatter over the DBT region. In order to quantify the statistic characterization, the local approaches employ a probabilistic model to define the functional relationship between macro- and microscale driving forces for cleavage fracture by using the scalar Weibull stress
with the Weibull stress
where
Figure 2 shows the construction of the toughness scaling model based on Weibull stress. In general, we can obtain the test value of fracture toughness using a specimen with configuration A, denoted as
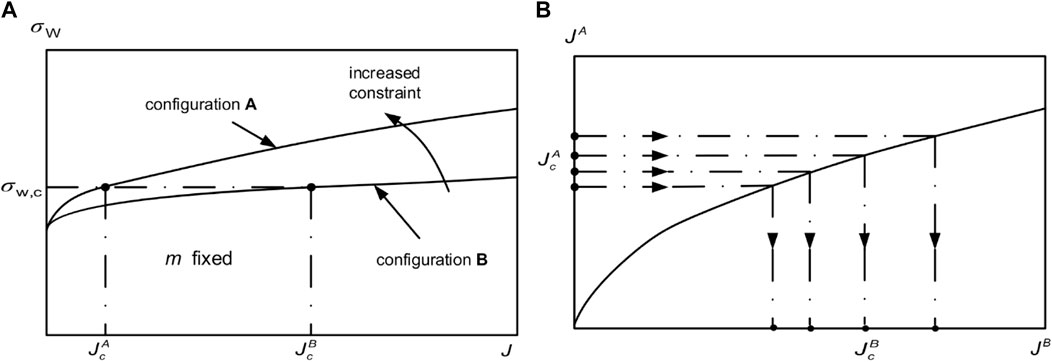
FIGURE 2. Illustration of toughness scaling between specimen configurations A and B based on the Weibull stress. (A) Loading J-integrity vs. Weibull stress. (B) Scaled fracture toughness from JcA to JcB.
3 Fracture Tests and Finite Element Models
3.1 Fracture Tests
In order to investigate the constraint effect on fracture toughness, several fracture toughness test results by CT and SENB specimens have been reported. For the ferritic steel DIN 22NiMoCr37 widely used in nuclear power plants, nearly 800 fracture toughness tests were performed using CT specimens to study specimen size and temperature effects on cleavage fracture toughness in the ductile–brittle fracture transition regime (Heerens and Hellmann, 2002). Using the same material, Gao et al. (2008) conducted fracture toughness tests by SENB specimens with a/W = 0.1 and 0.5 at −100°C. Thereby the tested results from these CT specimens and SENB specimens are used in this work to scale the fracture toughness. Figure 3 shows the true stress-strain curves transferred from the tension tests of DIN 22NiMoCr37, as reported by Gao et al. (2008) and Wasiluk et al. (2006), which will be used in finite element analysis.
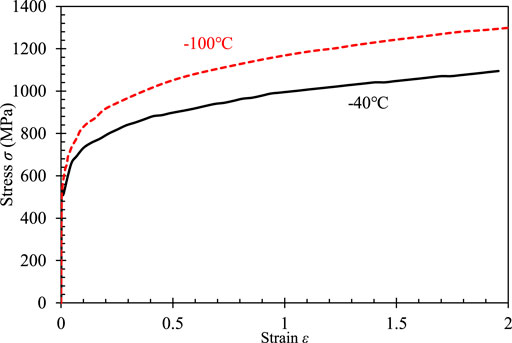
FIGURE 3. True stress–strain curves at −100°C and −40°C.
3.2 Finite Element Models
In this work, three kinds of specimen configurations are modeled by the finite element method using ABAQUS 2018, including the plane MBL, SENB, and CT models, as shown in Figure 4. For the MBL model used to model the SSY under plane strain, a detailed description can be found in previous studies (Li et al., 2019; Zhou et al., 2021). For the SENB and CT specimens, the quarter-symmetric models are considered with the sizes listed in Table 1, in which B is the specimen thickness, W denotes the specimen width, and a is the crack length.
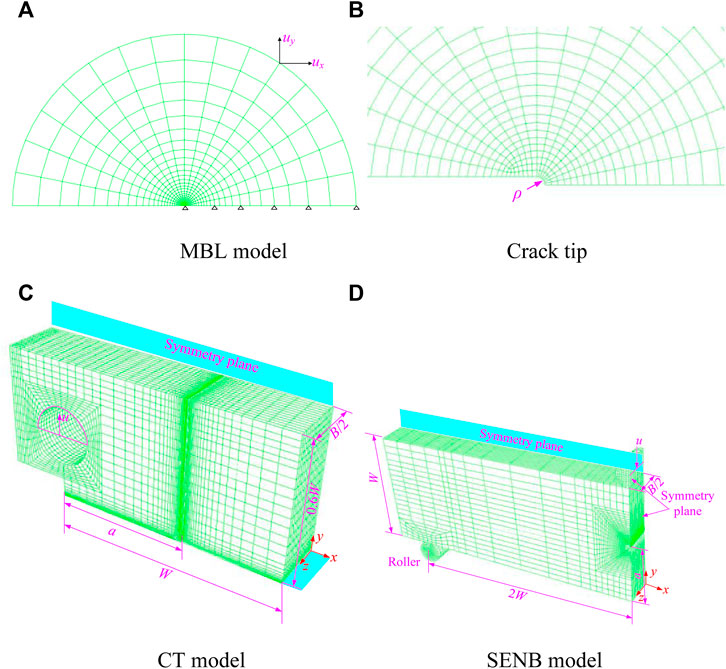
FIGURE 4. Finite element models. (A) MBL model. (B) Crack tip. (C) CT model. (D) SENB model.
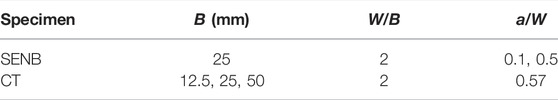
TABLE 1. Geometry sizes used in FE models.
Consistent with the crack tip in the MBL model, the crack tip with a radius ρ0 = 3 mm is adopted to calculate the Weibull stress using plane strain element CPE8R with 6017 nodes and 1916 elements. The three-dimensional, eight-node linear element C3D8 is used to mesh the SENB and CT models with about 30,100 nodes and 25,100 elements. In order to investigate the effect of thickness, 15 layers are arranged over the half-thickness.
On the symmetry planes at z = 0, a symmetry condition is applied. In addition, the roller is fixed in the SENB specimen. These finite element models are loaded by displacement increments imposed on the loading points for the symmetry plane. Using the domain integral procedure, ABAQUS can calculate and output the local J values at the tip location along the crack front.
4 Results and Discussions
4.1 Test Results
The tested values of fracture toughness
Then, the tested values of fracture toughness
where n denotes the number of toughness values in each data set and i represents the rank number. It can be obviously found that the crack length of single edge-notched bend (SENB) specimens and the thickness of CT specimens have an important effect on the fracture toughness. Higher fracture toughness presents in the lower in-plane constraint with shallow crack (a/W = 0.1) for SENB specimens or the lower out-of-plane constraint with thick CT specimens. Meanwhile, the scatter of test data by the same specimen geometry can be found with a maximum deviation of about
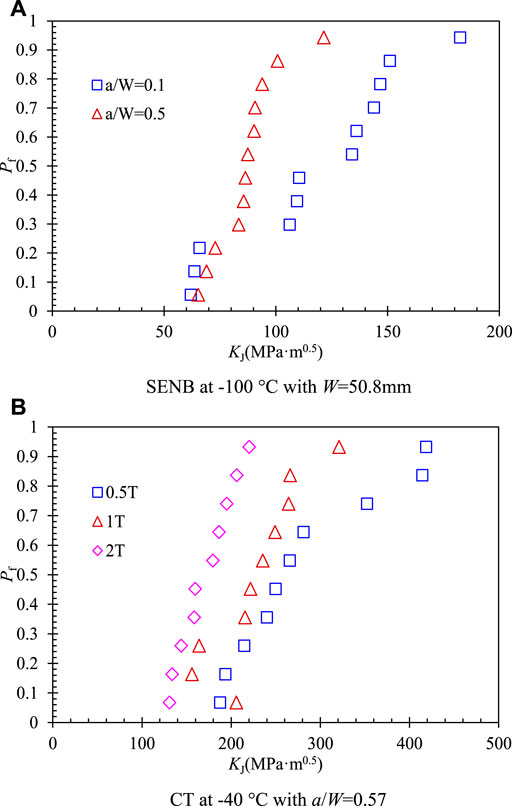
FIGURE 5. Rank probabilities of fracture toughness data (A) SENB at −100°C with W = 50.8 mm. (B) CT at −40 °C with
4.2 Toughness Scaled by Constraint Parameters Q and Tz
For the in-plane constraint, parameter
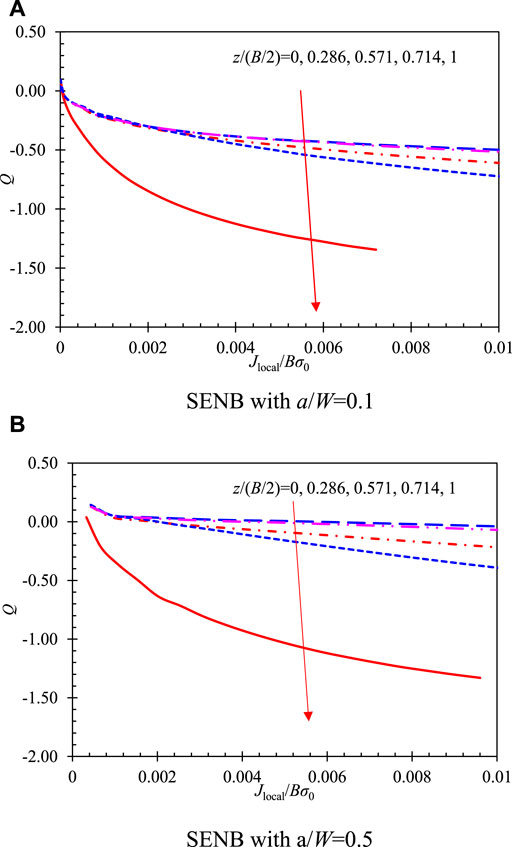
FIGURE 6. Variation in
Figure 7 shows the relationship of the local
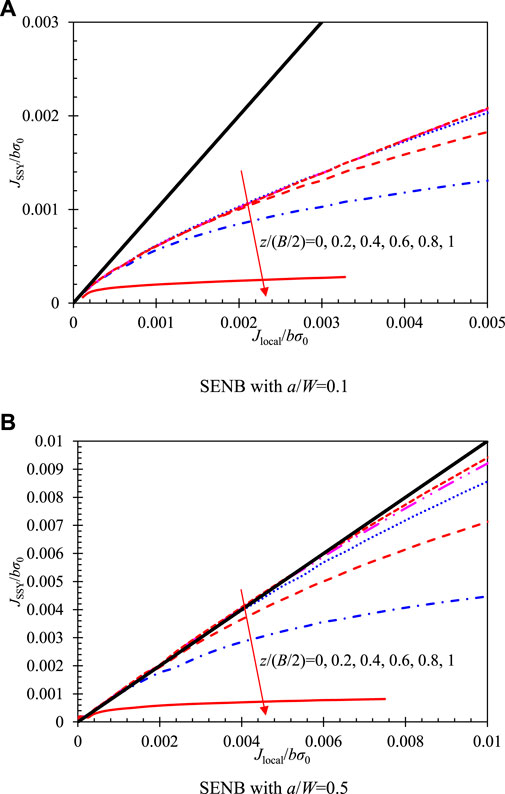
FIGURE 7. Fracture toughness scaling relationship for SENB specimens on the 2D SSY model. (A) SENB with a/W = 0.1. (B) SENB with a/W = 0.5.
For the TSM on the in-plane constraint
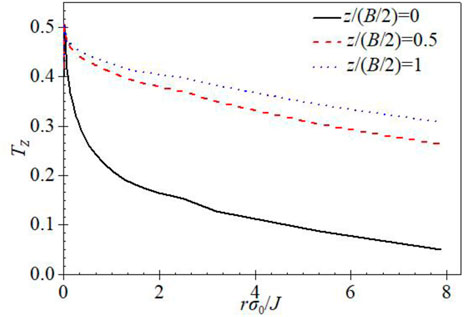
FIGURE 8.
The three parameters (
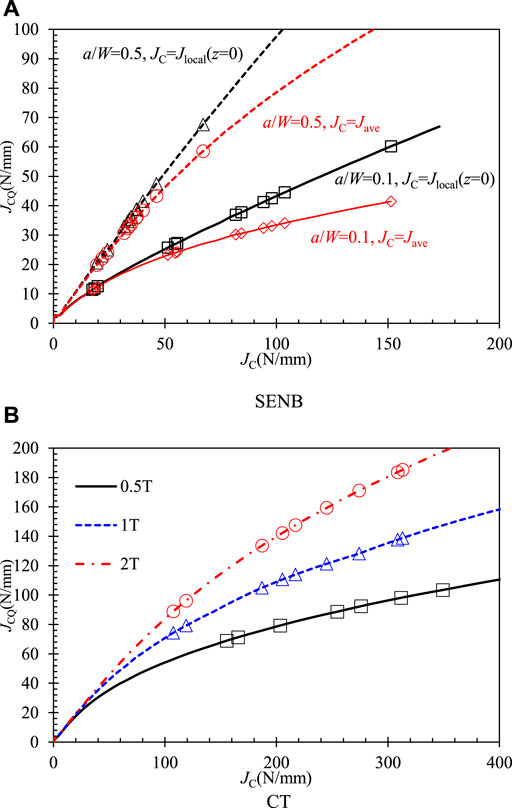
FIGURE 9. Corrected fracture toughness to
For the CT specimens with different thicknesses, the corrected fracture toughness to
4.3 Scaled Toughness by Weibull Stress
The local approach to fracture has been successfully applied to scale the fracture toughness tested by CT specimens with different thicknesses, SENB specimens with different crack lengths, or different specimen configurations. As the scale parameter in the local approach, Weibull stress should be calculated. A solution of Weibull stress as a function of in-plane constrain Q has been deduced by Li et al. ) 2019), but the thickness effect is not available. Therefore, the Weibull stress was calculated according to the stress filed from finite element analysis. The fracture toughness tested by different specimens can be scaled to that under the SSY condition with the same Weibull stress.
Figure 10 shows the Weibull stress for different configurations with the parameter
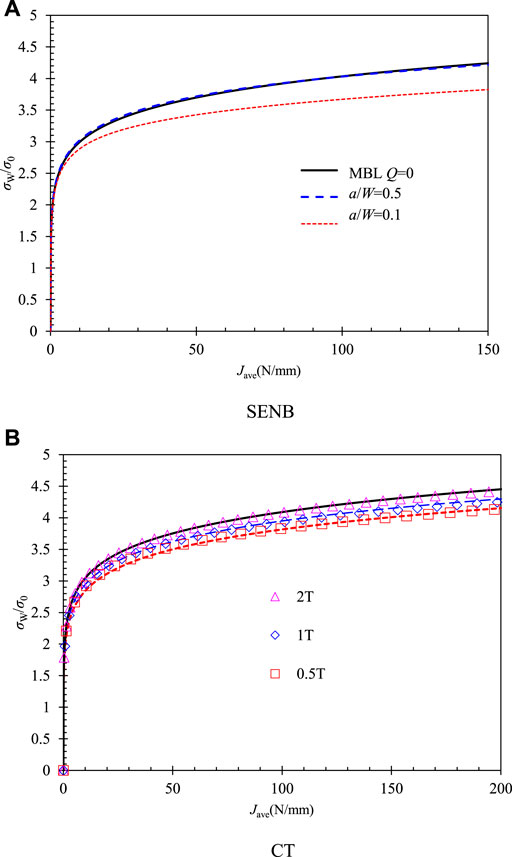
FIGURE 10. Weibull stress varied with the applied J average for different models. (A) SENB. (B) CT.
The assumption with the same Weibull stress, the tested fracture toughness
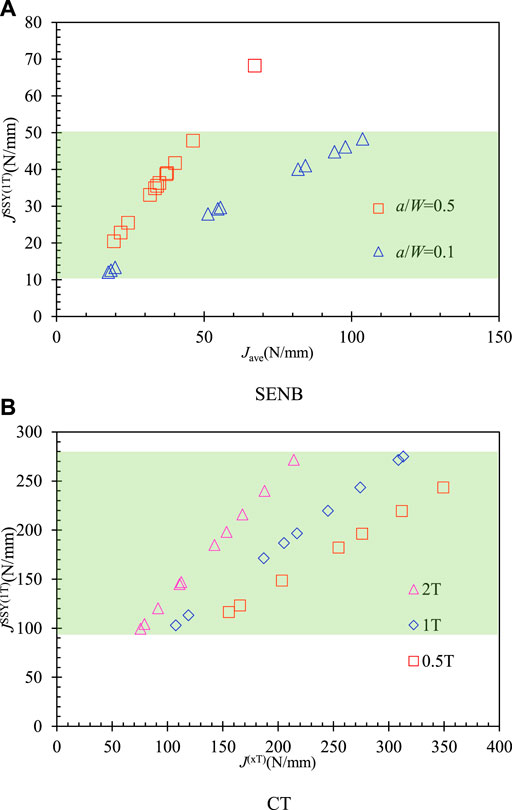
FIGURE 11. Corrected fracture toughness to
4.4 Comparisons of Scaled Toughness
Using the TSMs by the global approach on the J-Q theory and the local approach on the Weibull stress, the scaled values of fracture toughness
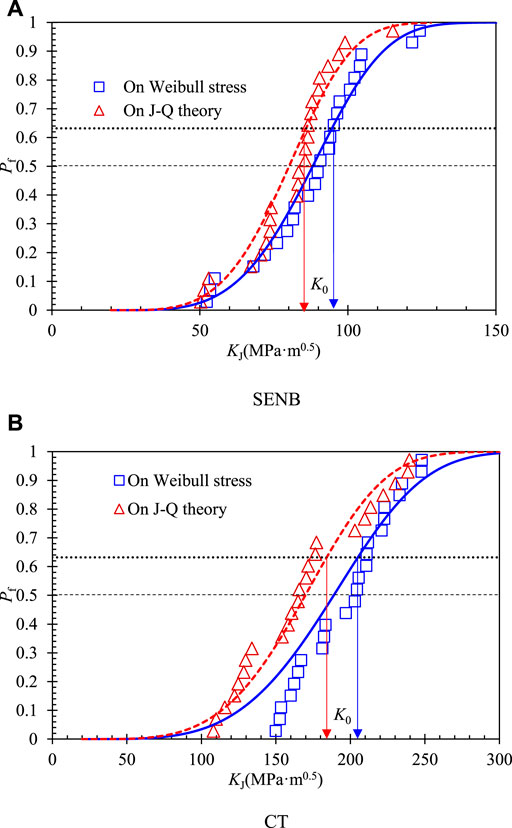
FIGURE 12. Cumulative failure probability of the scaled toughness on the two approaches. (A) SENB. (B) CT.
Furthermore, a three-parameter Weibull distribution is used to characterize the scatter of the scaled toughness, as shown in Figure 12 by lines. The cumulative distribution function of the scaled toughness can be described as
where
where
where
According to Eqs 10–12, we can estimate the scale parameter
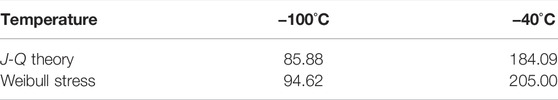
TABLE 2. Estimated scale parameter K0 by two approaches (
5 Conclusion
Some toughness scaling models (TSMs) were proposed to transfer the tested value to fracture toughness under small-scale yielding. Combined with the tested data by SENB specimens with different crack sizes and CT specimens with different thicknesses, the scaled fracture toughness is investigated on the global and local approaches to fracture. Some conclusions can be summarized as follows:
1) The
2) A lower corrected fracture toughness
3) Using the single variable of Weibull stress
4) The estimated scale parameter
Data Availability Statement
The original contributions presented in the study are included in the article/Supplementary Material. Further inquiries can be directed to the corresponding author.
Author Contributions
Conceptualization, YuL; methodology, WJ; software, YaL and MZ; validation, WJ and MZ; formal analysis, WJ; investigation, YuL; writing—original draft preparation, WJ and YaL; writing—review and editing, YuL and MZ; funding acquisition, YuL. All authors have read and agreed to the published version of the manuscript.
Funding
This research was funded by the National Key R&D Program of China, Grant no. 2020YFB1506100.
Conflict of Interest
The authors declare that the research was conducted in the absence of any commercial or financial relationships that could be construed as a potential conflict of interest.
Publisher’s Note
All claims expressed in this article are solely those of the authors and do not necessarily represent those of their affiliated organizations or those of the publisher, the editors, and the reviewers. Any product that may be evaluated in this article, or claim that may be made by its manufacturer, is not guaranteed or endorsed by the publisher.
References
Anderson, T. L., Stienstra, D., and Dodds, R. H. (1994). A Theoretical Framework for Addressing Fracture in the Ductile-Brittle Transition Region. ASTM Spec. Tech. Publ. 1207, 186. doi:10.1520/stp13706s
ASTM International (2020). ASTM E1820-20b, A. Standard Test Method for Measurement of Fracture Toughness. West Conshohocken, PA: ASTM International. doi:10.1520/E1820-20B
Barbosa, V. S., and Ruggieri, C. (2020). A Simplified Estimation Procedure for the Weibull Stress Parameter, M, and Applications to Predict the Specimen Geometry Dependence of Cleavage Fracture Toughness. Int. J. Press. Vessels Pip. 188, 104228. doi:10.1016/j.ijpvp.2020.104228
Dodds, R. H., Anderson, T. L., and Kirk, M. T. (1991). A Framework to Correlate a/W Ratio Effects on Elastic-Plastic Fracture Toughness (JC ). Int. J. Fract. 48, 1–22. doi:10.1007/bf00012499
EDF Energy Nuclear Generation Ltd (2015). Assessment of the Integrity of Structures Containing Defects, R6. Revision 4, with updates to Amendment 11. Gloucester, United Kingdom.
Gao, X., and Dodds Jr, R. H. (2001). An Engineering Approach to Assess Constraint Effects on Cleavage Fracture Toughness. Eng. Fract. Mech. 68, 263–283. doi:10.1016/s0013-7944(00)00102-8
Gao, X., and Dodds, R. H. (2000). Constraint Effects on the Ductile-To-Brittle Transition Temperature of Ferritic Steels: a Weibull Stress Model. Int. J. Fract. 102, 43–69. doi:10.1023/A:1007526006632
Gao, X., Dodds, R. H., Tregoning, R. L., Joyce, J. A., and Link, R. E. (1999). A Weibull Stress Model to Predict Cleavage Fracture in Plates Containing Surface Cracks. Fatigue & Fract. Eng. Mater. Struct. 22, 481–493. doi:10.1046/j.1460-2695.1999.00202.x
Gao, X., Joyce, J. A., and Roe, C. (2008). An Investigation of the Loading Rate Dependence of the Weibull Stress Parameters. Eng. Fract. Mech. 75, 1451–1467. doi:10.1016/j.engfracmech.2007.07.007
Gao, X., Ruggieri, C., and Dodds Jr, R. H. (1998). Calibration of Weibull Stress Parameters Using Fracture Toughness Data. Int. J. Fract. 92, 175–200. doi:10.1023/a:1007521530191
Guo, W. L. (1995). Elastoplastic 3-Dimensional Crack Border Field .3. Fracture Parameters. Eng. Fract. Mech. 51, 51–71. doi:10.1016/0013-7944(94)00215-4
Heerens, J., and Hellmann, D. (2002). Development of the Euro Fracture Toughness Dataset. Eng. Fract. Mech. 69, 421–449. doi:10.1016/s0013-7944(01)00067-4
Horn, A. J., and Sherry, A. H. (2010). Prediction of Cleavage Fracture from Non-sharp Defects Using the Weibull Stress Based Toughness Scaling Model. Int. J. Press. Vessels Pip. 87, 670–680. doi:10.1016/j.ijpvp.2010.10.007
Horn, A. J., Cicero, S., and Andres, D. (2020). Out-of-plane Constraint Loss in Three Point Bend Specimens with Notches. Int. J. Press. Vessels Pip., 180, 104025. doi:10.1016/j.ijpvp.2019.104025
International Organization for Standardization (2016). ISO 12135, Metallic Materials - Unified Method of Test for the Determination of Quasistatic Fracture Toughness. Vernier, Geneva, Switzerland.
Ishihara, K., Hamada, T., and Meshii, T. (2017). T-scaling Method for Stress Distribution Scaling under Small-Scale Yielding and its Application to the Prediction of Fracture Toughness Temperature Dependence. Theor. Appl. Fract. Mech. 90, 182–192. doi:10.1016/j.tafmec.2017.04.008
Li, Y., Wang, Z., Lei, Y., Qian, G., Zhou, M., Gao, Z., et al. (2019). Weibull Stress Analysis in Local Approach to Fracture. Theor. Appl. Fract. Mech. 104, 102379. doi:10.1016/j.tafmec.2019.102379
Link, R. E., and Joyce, J. A. (1996). Application of Fracture Toughness Scaling Models to the Ductile-To-Brittle Transition. No. NUREG/CR-6279. Washiton DC: Nuclear Regulatory Commission.
Ma, H. S., Wang, G. Z., Liu, S., Tu, S. T., and Xuan, F. Z. (2016). Three-dimensional Analyses of Unified Characterization Parameter of In-Plane and Out-Of-Plane Creep Constraint. Fatigue Fract. Engng Mater Struct. 39, 251–263. doi:10.1111/ffe.12361
Meshii, T., and Ishihara, K. (2018). “Application of the T-Scaling Method to Predict Fracture Toughness under Compressive Residual Stress in the Transition Temperature Region,” in ASME 2018 Pressure Vessels and Piping Conference, Prague, Czech Republic, July 15–20, 2018.
Mostafavi, M., Smith, D. J., and Pavier, M. J. (2010). Reduction of Measured Toughness Due to Out-Of-Plane Constraint in Ductile Fracture of Aluminium Alloy Specimens. Fatigue Fract. Eng. M. 33, 724–739. doi:10.1111/j.1460-2695.2010.01483.x
Mostafavi, M., Smith, D. J., and Pavier, M. J. (2011). A Micromechanical Fracture Criterion Accounting for In-Plane and Out-Of-Plane Constraint. Comput. Mater. Sci. 50, 2759–2770. doi:10.1016/j.commatsci.2011.04.023
Neimitz, A., and Dzioba, I. (2015). The Influence of the Out-Of- and In-Plane Constraint on Fracture Toughness of High Strength Steel in the Ductile to Brittle Transition Temperature Range. Eng. Fract. Mech. 147, 431–448. doi:10.1016/j.engfracmech.2015.07.017
Neimitz, A., and Galkiewicz, J. (2006). Fracture Toughness of Structural Components: Influence of Constraint. Int. J. Press. Vessels Pip. 83, 42–54. doi:10.1016/j.ijpvp.2005.10.001
Neimitz, A., and Lipiec, S. (2021). Fracture Toughness Correction Due to the in- and Out-Of-Plane Constraints. Theor. Appl. Fract. Mech. 112, 102844. doi:10.1016/j.tafmec.2020.102844
Neimitz, A., Graba, M., and Gałkiewicz, J. (2007). An Alternative Formulation of the Ritchie-Knott-Rice Local Fracture Criterion. Eng. Fract. Mech. 74, 1308–1322. doi:10.1016/j.engfracmech.2006.07.015
Nevalainen, M., and Dodds, R. H. (1996). Numerical Investigation of 3-D Constraint Effects on Brittle Fracture in SE(B) and C(T) Specimens. Int. J. Fract. 74, 131–161. doi:10.1007/bf00036262
Nikishkov, G. P., and Matvienko, Y. G. (2016). Elastic-plastic Constraint parameterAfor Test Specimens with Thickness Variation. Fatigue Fract. Engng Mater Struct. 39, 939–949. doi:10.1111/ffe.12390
O'dowd, N. P., and Shih, C. F. (1992). Family of Crack-Tip Fields Characterized by a Triaxiality Parameter-2. Fracture Applications. J. Mech. Phys. Solids 40, 939–963. doi:10.1016/0022-5096(92)90057-9
O'Dowd, N. P. (1995). Applications of Two Parameter Approaches in Elastic-Plastic Fracture Mechanics. Eng. Fract. Mech. 52, 445–465. doi:10.1016/0013-7944(95)00033-r
Pan, J., and Yin, M. (2021). A Study on Fracture Toughness Based on a Modified Beremin Model. J. Mater. Eng. Perform. 30, 8309–8321. doi:10.1007/s11665-021-06072-w
Qian, G., Cao, Y., Niffenegger, M., Chao, Y. J., and Wu, W. (2018). Comparison of Constraint Analyses with Global and Local Approaches under Uniaxial and Biaxial Loadings. Eur. J. Mech. - A/Solids 69, 135–146. doi:10.1016/j.euromechsol.2017.12.006
Qian, G., Lei, W.-S., Niffenegger, M., and González-Albuixech, V. F. (2018). On the Temperature Independence of Statistical Model Parameters for Cleavage Fracture in Ferritic Steels. Philos. Mag. 98, 959–1004. doi:10.1080/14786435.2018.1425011
Ruggieri, C., and Dodds, R. H. (1996). A Transferability Model for Brittle Fracture Including Constraint and Ductile Tearing Effects: a Probabilistic Approach. Int. J. Fract. 79, 309–340. doi:10.1007/bf00018594
Ruggieri, C., and Dodds, R. H. (2018). A Local Approach to Cleavage Fracture Modeling: An Overview of Progress and Challenges for Engineering Applications. Eng. Fract. Mech. 187, 381–403. doi:10.1016/j.engfracmech.2017.12.021
Ruggieri, C. (2020). A Modified Local Approach Including Plastic Strain Effects to Predict Cleavage Fracture Toughness from Subsize Precracked Charpy Specimens. Theor. Appl. Fract. Mech. 105, 102421. doi:10.1016/j.tafmec.2019.102421
She, C., and Guo, W. (2007). The Out-Of-Plane Constraint of Mixed-Mode Cracks in Thin Elastic Plates. Int. J. Solids Struct. 44, 3021–3034. doi:10.1016/j.ijsolstr.2006.09.002
Smith, R. J., Horn, A. J., and Sherry, A. H. (2018). Relating Charpy Energy to Fracture Toughness in the Lower Transition Region Using a Weibull Stress Dependent Energy Scaling Model. Int. J. Press. Vessels Pip. 166, 72–83. doi:10.1016/j.ijpvp.2018.06.001
Wasiluk, B., Petti, J. P., and Dodds, R. H. (2006). Temperature Dependence of Weibull Stress Parameters: Studies Using the Euro-Material. Eng. Fract. Mech. 73, 1046–1069. doi:10.1016/j.engfracmech.2005.11.006
Xu, J. Y., Wang, G. Z., Xuan, F. Z., and Tu, S. T. (2018). Unified Constraint Parameter Based on Crack-Tip Opening Displacement. Eng. Fract. Mech. 200, 175–188. doi:10.1016/j.engfracmech.2018.07.021
Yang, J., Wang, G. Z., Xuan, F. Z., and Tu, S. T. (2013). Unified Characterisation of In-Plane and Out-Of-Plane Constraint Based on Crack-Tip Equivalent Plastic Strain. Fatigue Fract. Eng. M. 36, 504–514. doi:10.1111/ffe.12019
Zhao, J., and Guo, W. (2012). Three-parameter K-T-Tz Characterization of the Crack-Tip Fields in Compact-Tension-Shear Specimens. Eng. Fract. Mech. 92, 72–88. doi:10.1016/j.engfracmech.2012.06.004
Zhen, Y., Chang, Q., Cao, Y., and Niu, R. (2021). A Novel Unified Characterization Parameter of In-Plane and Out-Of-Plane Constraints Based on Critical CTOA. Fatigue Fract. Eng. Mater Struct. 44, 1305–1317. doi:10.1111/ffe.13430
Keywords: toughness scaling models, ferritic steel, local approach to fracture, Weibull stress, J-Q theory
Citation: Jin W, Li Y, Li Y and Zhou M (2022) Scaled Fracture Toughness Based on the Weibull Stress for the Ferritic Steel Used in Nuclear Power Plants. Front. Mater. 9:927806. doi: 10.3389/fmats.2022.927806
Received: 25 April 2022; Accepted: 31 May 2022;
Published: 12 July 2022.
Edited by:
Zihao Wang, Tohoku University, JapanReviewed by:
Kehuan Wang, Harbin Institute of Technology, ChinaJianhua Pan, Hefei University of Technology, China
Copyright © 2022 Jin, Li, Li and Zhou. This is an open-access article distributed under the terms of the Creative Commons Attribution License (CC BY). The use, distribution or reproduction in other forums is permitted, provided the original author(s) and the copyright owner(s) are credited and that the original publication in this journal is cited, in accordance with accepted academic practice. No use, distribution or reproduction is permitted which does not comply with these terms.
*Correspondence: Mingjue Zhou, emhvdW1pbmdqdWVAemp1dC5lZHUuY24=