 Kai Gong
 Tunahan Aytas
 Shu Yang Zhang
 Elsa A. Olivetti
- Department of Materials Science and Engineering, Massachusetts Institute of Technology, Cambridge, MA, United States
Dissolution of silicate-based materials is important to many natural processes and engineering applications, including cement and concrete production. Here, we present a data-driven study to predict the dissolution rates of crystalline silica (i.e., quartz) in near-neutral and alkaline environments. We present a quartz dissolution database containing both dissolution rates and five major dissolution conditions (i.e., temperature, pressure, pH at the experimental temperature T (pHT), and the sodium and alumina content in the solution) via data mining from the literature. We supplement the database with experimental data of quartz dissolution rate in sodium hydroxide solutions (0–5 M) at different target temperatures (25–90°C), which are significantly less covered by the existing literature. We build two data-driven models (i.e., random forest (RF) and artificial neural network (ANN)) to predict the dissolution rate of quartz (i.e., output target) as a function of dissolution conditions (i.e., input features). The results show that both RF and ANN models exhibit high predictive capability, with R2 values of 0.97–0.98, MAPEs of 2.95–4.24% and RMSEs of ∼0.31–0.44 log (mole/m2/s) for the test set. These prediction errors are much smaller than linear regression models (RMSE of ∼1.25 log) also presented here and comparable with those achieved in previous studies using reaction models based on a smaller and less complex dataset (RMSE of ∼0.35–0.44 log). We further evaluate the interpretability and performance of the data-driven models, and the results show that the model predictions are generally consistent with literature observations, including the different impacts of input features on dissolution rate. In particular, the ANN model appears to exhibit a certain level of ability to extrapolate, i.e., making predictions in feature space not covered in the database.
1 Introduction
As the most abundant free oxide on earth, silica and its polymorphs (e.g., crystalline quartz and amorphous silica) have been extensively used or studied in many different fields, including geochemistry, earth science, and concrete materials. The thermodynamically stable polymorph quartz is estimated to account for ∼20% of the continental crust (Nesbitt and Young, 1984), and this abundance renders the dissolution of quartz and the subsequent precipitation significant components of the global geochemical circle. Hence, the dissolution kinetics of quartz have been studied over a wide range of pH (∼0–12), temperature (∼25–300°C), and solution chemistry (Dove, 1994; Bickmore et al., 2006; Bickmore et al., 2008).
Furthermore, quartz is a major mineral phase in siliceous aggregates (sand in particular), which have been extensively used in construction, with an estimated global usage of 3.2 Gt/year in 2020 and 4.5 Gt/year by 2060 (Zhong et al., 2022). Despite this large quantity of usage, there are few studies on the quantitative dissolution kinetics of quartz (and other forms of silica) in concrete environments, where the pH is generally higher than ∼13. Although quartz is often considered as an inert filler in concrete, the dissolution of sand aggregate and its impact on concrete chemistry and properties could be nonnegligible in the long term (Diamond, 1976). This is especially the case for concrete based on alkali-activated materials (AAM), where concentrated alkaline activating solutions (with pH often above ∼14) and elevated temperature curing can significantly accelerate the dissolution of quartz (and sand aggregate). As postulated in an early study on alkali-activated slag (AAS) mortars, this accelerated dissolution of quartz in a NaOH solution (∼3 M) increases the surface roughness of quartz and the formation of products at the quartz-paste interface, leading to no apparent weak interfacial transition zone (ITZ)) (Shi and Xie, 1998). Subsequent studies confirmed that the AAS-based mortar and concrete exhibited denser ITZ or no apparent ITZ compared with Portland cement (PC)-based systems (Shi and Xie, 1998; Lee and van Deventer, 2004; San Nicolas and Provis, 2015; Fang and Zhang, 2020), which is expected to improve the mechanical and transport properties of the resulting AAS-based concretes (San Nicolas and Provis, 2015).
On the other hand, the dissolution of siliceous aggregate in high alkalinity environments could lead to alkali-silica reaction (ASR) (Diamond, 1976; Broekmans, 2004), a major durability issue causing deleterious expansion and cracking of concrete materials and structure. The risk of ASR increases when the aggregate used contains reactive siliceous phases, which include amorphous silica, cristobalite, and microcrystalline or cryptocrystalline quartz (e.g., flint and chalcedony) (Diamond, 1976; Alaejos and Lanza, 2012; Du and Tan, 2014; Rajabipour et al., 2015). These reactive phases exhibit faster dissolution in concrete than the more thermodynamically stable quartz, accelerating the provision of dissolved silica species for deleterious ASR (Diamond, 1976). Studies have shown that radiation-induced transformation of crystalline quartz to distorted amorphous silica significantly accelerates its dissolution rate (Ichikawa and Koizumi, 2002; Pignatelli et al., 2016), and this increased aggregate reactivity promotes ASR, contributing to the deleterious expansion of concrete materials surrounding nuclear facilities (Rosseel et al., 2016). Fine amorphous silica fume (∼0.1–0.3 µm) is highly reactive in concrete and has been widely used as a supplementary cementitious material (SCM) to make high strength concrete; interestingly, well-dispersed amorphous silica fume was shown to suppress ASR (Hooton, 1993), whereas agglomerated silica fume can lead to severe ASR depending on the agglomerate size (Maas et al., 2007).
This presence of a “pessimum” size effect (i.e., maximum ASR at some intermediate particle size) has been observed for many reactive aggregates, where different hypotheses or models have been proposed to explain this effect (Rajabipour et al., 2015). It is interesting that the “pessimum” size with maximum ASR potential was found to vary considerably depending on the type of aggregate (from 0.18 to 0.6 mm for siliceous magnesian limestone (Stanton, 2008) to 4–8 mm for mixed-mineralogy alpine aggregate (Dunant and Scrivener, 2012)) (Rajabipour et al., 2015). There is also a “pessimum” effect on the content of reactive phases for some aggregates, which has been attributed to a specific ratio of reactive silica/available alkalis (e.g., ∼6) (Rajabipour et al., 2015). These “pessimum” effects may be partially related to the dissolution kinetics of different aggregates (e.g., dissolved Si in molar per second) or the amount of dissolved silica species after a specific period of time, which are influenced by particle size (area of reactive surface), mineralogy, and amount of reactive sites (Rajabipour et al., 2015).
Since the overall rate of ASR is largely dependent on the rate of silica dissolution in pore solution (Rajabipour et al., 2015), there is a strong need to study the dissolution kinetics of different silica polymorphs in alkaline environments relevant to concrete materials. However, as stated in this recent review article (Rajabipour et al., 2015), “literature on this subject is limited and significant knowledge gaps exist with respect to quantifying the dissolution rate as a function of aggregate composition, mineralogy, and surface properties, pore solution composition, temperature, and pressure”. Most existing studies on the dissolution kinetics of silica polymorph (e.g., quartz and amorphous silica) come from the fields of geochemistry and earth science (Dove, 1994), with only a few exceptions from the cement and concrete field (Snellings, 2013; Pignatelli et al., 2016; Bagheri et al., 2022). For example, as mentioned earlier, most of these studies (Dove, 1994) focus on pH < 12, and there are significantly fewer dissolution rate data for quartz (and its polymorph) at pH > ∼13, which is more relevant to concrete, especially for AAM-based concrete.
Given the importance of silica dissolution kinetics and the research gap mentioned above for the cement and concrete community, this article builds data-driven machine learning (ML) models that allow us to predict the dissolution rates of quartz in near-neutral and alkaline environments. We build a quartz dissolution rate database containing 597 measurements across a wide range of dissolution conditions via data mining from the literature. We supplement the mined database by collecting quartz dissolution rate data in NaOH solutions (0–5 M) at different temperatures (∼26–85°C). We build random forest (RF) and single-layer artificial neural network (ANN) models to predict quartz dissolution rate (i.e., output target), in comparison with linear regression (LR) models, as a function of five dissolution conditions (i.e., input features): temperature, pressure, pHT (i.e., pH at the measurement temperature T), and the content of alkali (i.e., Na+) and alumina species in the dissolving solution.
Finally, we evaluated the interpretability and reliability of these data-driven models (e.g., impact of different input features on quartz dissolution rate and apparent activation energies) using a SHapley Additive exPlanations (SHAP) technique and feature exploration. The high prediction accuracy of these ML models, along with their ability to improve once more data in unexplored feature space is collected and fed into the models, illustrate the value of using a data-driven approach for the prediction of mineral and glass dissolution.
2 Data and Methods
2.1 Data Curation
We extracted 597 dissolution rate measurements for quartz in the near-neutral or alkaline environments from ∼30 literature studies (Schwartzentruber et al., 1987; Dove and Elston, 1992; Berger et al., 1994; Dove, 1994; Knauss and Copenhaver, 1995; Worley et al., 1996; Dove and Nix, 1997; Dove, 1999; Bickmore et al., 2006; Mitra, 2008; Davis et al., 2011; Choi et al., 2013; Choi et al., 2015; Zhang et al., 2015), where part of the data has been compiled and analyzed previously in refs. (Dove and Elston, 1992; Dove, 1994; Bickmore et al., 2008; Rimstidt, 2015; Heřmanská et al., 2022). This database, as given in Supplementary Material A, represents the largest compilation of quartz dissolution rates, to the best of our knowledge. The histograms and statistics of the dissolution rate data, along with five dissolution conditions (i.e., temperature, pressure, pHT, and Na and Al content), are shown in Supplementary Figure S1 and Table S1, respectively. These five dissolution conditions are included in the database mainly because of three considerations, i.e., 1) their respective impact on quartz dissolution has been well documented (Worley, 1994), 2) they are relevant to quartz dissolution in concrete materials, and 3) their relative abundancy in data availability. Other factors that have been shown to also impact quartz dissolution kinetics include 1) the type of reactor (e.g., batch vs. mixed flow reactor) (Dove and Crerar, 1990), 2) the type of cations and anions in the solution (Bennett, 1991; Dove and Nix, 1997), 3) flow rates in the case of flow reactor (Worley et al., 1996), 4) the extent of undersaturation (Dove et al., 2008), and 5) particle size (Diedrich et al., 2012). These factors are not considered in the current database mainly due to insufficient and missing data (i.e., not reported in the original studies) and/or their relatively mild influence on quartz dissolution rate. Although particle size was not used as an input feature, its impact on quartz dissolution rate has been taken into account by normalizing the rate data using the surface area of the quartz particle (rate in the unit of mole/m2/s), which is a common practice in the literature. In this study, the Brunauer–Emmett–Teller (BET) surface areas from N2 sorption experiments have been used. We note that pHT represents the pH at the temperature T at which the dissolution experiments were performed. This pHT at a high temperature can be very different from pH measured at room temperature, especially in alkaline solutions (Dove, 1994). Furthermore, the addition of fluoride in the dissolution solution has been shown to significantly impact quartz dissolution (Liang and Readey, 1987; Mitra, 2008); however, it is not relevant to cementitious materials and hence not included in the current database as well.
Next, we plot the quartz dissolution rate as a function of the five dissolution conditions in Figure 1 to illustrate their relationship in the database. Figure 1, along with Supplementary Figure S1 and Table S1, show that the database covers a wide range of dissolution rates (∼10−4 to ∼10−14 mol/m2/s), temperature (∼20–450°C) and pHT (∼4–13), and to a lesser extent, sodium content (∼0–4 M). For the other two factors (i.e., dissolved alumina content (∼0–10 mM) and pressure (∼0.1–200 MPa)), there is significantly fewer data in the database (i.e., most of the measurements were performed at atmospheric pressure (0.1 MPa) and in solutions without any dissolved alumina additives). It is clear from Figure 1 that temperature has the most obvious impact on quartz dissolution, with a higher temperature generally leading to a higher dissolution rate, which is expected. In contrast, the correlations between the dissolution rate and the other four variables (i.e., pressure, pHT, and alumina and sodium content) are not evident in Figure 1. Nevertheless, the fact that the measured dissolution rate varies by ∼3-8 orders of magnitude at a given temperature (Figure 1C) illustrates that the other four variables also have large impacts on quartz dissolution. It is also clear from Figure 1 that there is significantly less quartz dissolution rate data at pHT > ∼12–13 in the literature, yet they are highly relevant to modern cement and concrete, especially those based on AAMs. Hence, in this study, we have collected experimental quartz dissolution data in pHT > ∼12 alkaline solutions to complement the mined database.
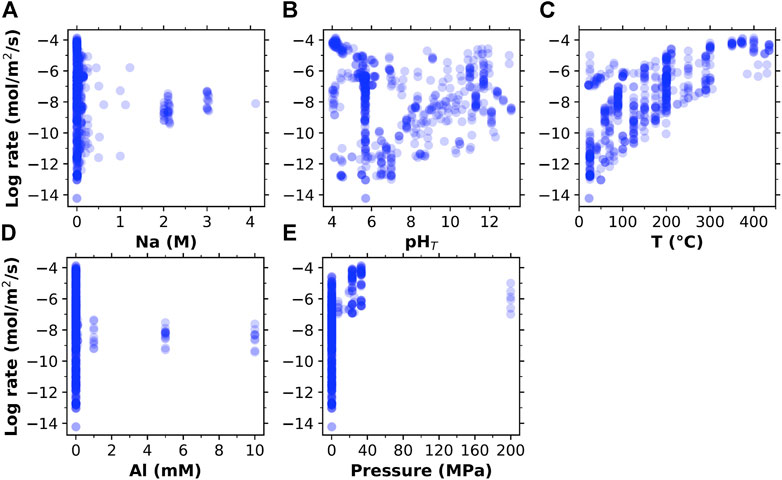
FIGURE 1. The relationship between the log dissolution rate of quartz (in mole/m2/s, based on Brunauer–Emmett–Teller (BET) surface area of quartz particles) and the five dissolution conditions (A) Na + content (in mole/L (M)), (B) pHT, (C) temperature T (in °C), (D) Al content (in mM), and (E) pressure (in MPa) in the mined database (as given in Supplementary Material A).
2.2 Dissolution Experiments
Here, dissolution experiments were performed on fine quartz particles in sodium hydroxide (NaOH) solutions using a batch reactor. The quartz sample used is Quartz-Chalcedony purchased from Ward’s Science, with their chemical composition (determined using scanning electron microscopy with energy dispersive X-ray analysis (SEM-EDX)) and mineralogical composition (determined using X-ray diffraction (XRD)) shown in Supplementary Figures S2 and S3, respectively. The XRD data in Supplementary Figures S2 were collected using high-speed Bragg-Brentano optics on a PANalytical X'Pert Pro MPD operated at 45 kV and 40 mA. HighScore Plus software was used for quantitative XRD using Rietveld analysis. For SEM-EDX, quartz powders were packed onto carbon tape and imaged on a Zeiss Merlin equipped with an EDAX detector and energy-dispersive X-ray spectrometer. Both the SEM-EDX and XRD data show that the samples used here are predominantly crystalline quartz.
The quartz samples were first ground and then sieved through mesh sizes of 45–150 μm in diameter. To remove fine residues on particle surface, the powdered quartz samples have been placed into a beaker with isopropyl alcohol and ultrasonically cleaned for 7–8 min. The samples were dried in a furnace at 80–90°C for >12 h and cooled to room temperature before incorporating them into batch reactors for dissolution experiments. The resulting powder has a BET surface area of 1.722 m2/g, as measured using N2 sorption with a Micromeritics ASAP202 instrument. The particle size distribution of the quartz sample has been determined using a Beckman Coulter LS I3 320 Laser Diffraction Particle Size Analyzer, with the result presented in Supplementary Figure S4.
The dissolution experiments were performed in batch systems using 400 ml of NaOH solutions (in 500 ml plastic bottle) of varying concentrations (0–5 M (mole Na+/L)). The NaOH solutions were prepared by dissolved NaOH pellets in deionized water. For each batch experiment, 0.04–0.4 g of quartz powders were added to each bottle of solution to begin dissolution. This gives a liquid-to-solid ratio of 1,000–10,000, which is sufficiently high to ensure that all dissolution experiments are carried out at far-from-equilibrium conditions. To study the effects of temperature on quartz dissolution rates, separate batch systems were conducted at targeted temperature of 25°C, 50°C, and 90°C—where samples were stored in the open lab environment and inside furnaces fixed at 50 and 90°C, respectively. To study the effects of additional sodium ions (Na+) on dissolution rates, varying amounts of sodium chloride (NaCl, ≥99.0% ACS, VWR Chemicals BDH) were added to 1 M NaOH solutions for dissolution experiments at a targeted 50°C, resulting in solvents with Na+ concentrations of 1.0, 1.5, 2.0, and 2.5 M. The constituent information for all the dissolution experiments is summarized in Table 1.
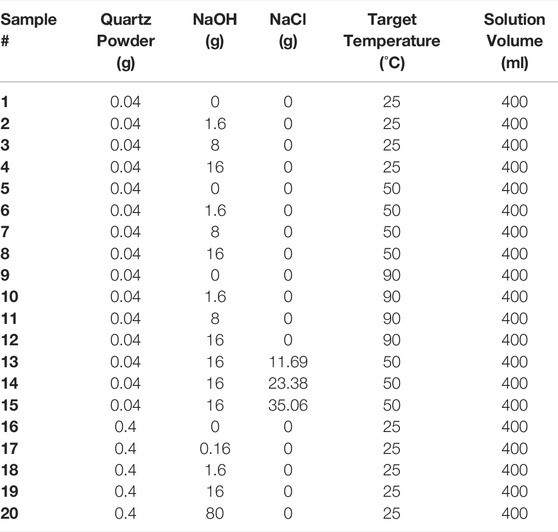
TABLE 1. Summary of the constituent information for all the batch dissolution experiments that have been performed here. The quartz powder used has a BET surface area of 1.722 m2/g. Note that the target temperature is slightly different from the actual experimental temperatures which have been measured and given in Table 2.
At designated time intervals, a 15 ml sample was taken out per solution using syringes capped with filters (0.2 µm) to prevent any further dissolution of powders once samples were removed from the batch system. The drawn sample was then distributed equally (5 ml) to three separate test tubes for three independent measurements, which allows measurement uncertainty to be estimated. Each solution was then immediately replenished with 15 ml of the original solution to keep the solid to liquid ratio constant throughout the experiment. No stirring or mixing of the solutions in the batch systems was conducted. After a plateau was reached with the silicon concentration, the collection of solutions was stopped.
The Si concentration in each sampled solution was determined using an Agilent 5,100 Vertical Dual View ICP-OES with an autosampler. Standards for calibration were prepared by diluting the standard solution –1,000 mg/L Si in H2O (Elemental Scientific, Omaha, NE). Solution pHs were measured using a Thermo Orion Ag/AgCl combination triode with an Automatic Thermal Correction probe stored in KCl solution. Based on the evolution of Si concentration in the dissolving solutions, we then determined the early-stage steady-state and far-from-equilibrium dissolution rate of quartz using Eq. 1:
where
The maximum and minimum rates of dissolution was calculated from the mean difference between the maximum silicon concentrations and the minimum silicon concentrations of each time point. The error is higher for the samples with a slower dissolution rate due to the proximity of the dissolved silicon concentration during the experiments to the measurement limit of the ICP-OES used.
2.3 Data-Driven Modeling
Empirical rate equations based on reaction models have been used previously to model the dissolution rates of quartz as a function of temperature, pHT and Na content (Bickmore et al., 2008; Rimstidt, 2015). Here, we have built two data-driven ML models (i.e., RF and single layer ANN) based on the database presented in Section 2.1 and additional data collected here for predicting the dissolution rate of quartz (i.e., output target) as a function of the five dissolution conditions (i.e., input features) shown in Figure 1. Compared with conventional reaction models, data-driven ML models have the advantage of capturing complex relationships or hidden trends between many input features and output targets, which are often not visually evident, as illustrated in Figure 1. However, due to the relatively small dataset used here, care is needed to build robust ML models. Next, we briefly describe the theoretical background of the RF and ANN models and the procedures used here to construct the models, with more details given in Supplementary Material B.
2.3.1 Random Forest Regression
RF, developed by Breiman (Breiman, 2001), is a widely used ML technique based on an ensemble of decision trees, which can be used for both classification and regression problems. A decision tree is a “rule-based” model which works by splitting the source data (root node) into a series of partitions (leaf node) based on a set of splitting rules (usually selected to minimize error). Different from a single decision tree method, the RF method uses a bootstrap aggregating (or bagging) technique to generate an ensemble of trees (creating a forest), with each tree constituting a randomly sampled subset of the training data (as opposed to all the training data). Another distinction is that the RF method randomly selects a subset of input features (as opposed to all the input features) at each node of the tree, which reduces the correlation between the trees in the forest. The output predictions (i.e., the dissolution rate of quartz in this case) produced by all the trees are then averaged to generate the final prediction of the RF model. The RF method has been shown to both reduce over-fitting and generalization error and improve the accuracy of prediction compared with other “rule-based” models (Bryll et al., 2003; John Lu, 2010; Altman and Krzywinski, 2017).
We started the model construction by performing a shuffled and stratified split (as opposed to a random training-testing split) of the combined database (i.e., data is sorted and binned into ten equally spaced ranges based on its dissolution rate values) into a training and a testing set, accounting for 85 and 15% of the data, respectively. Compared with a random training-testing split, a stratified training-testing split ensures the distribution of the sampled training data is representative of the whole dataset, which has been shown to be important for small dataset (Song et al., 2021). We then used the training set (with 521 measurements) to train the RF model to learn the correlations between the prediction target (i.e., dissolution rate) and the five input features.
Due to the importance of hyperparameters to the performance of ML modeling, we performed a grid search with a stratified five-fold cross-validation on the training set to optimize the hyperparameters. Specifically, the training set has been partitioned into five equally sized folds, where we used four folds of the data for training while the remaining fold for validation at each training-validation iteration. Based on the average score values of validation, the optimal combination of hyperparameters was determined (i.e., with the highest average score). For the RF model, we have optimized three important hyperparameters, i.e., 1) the number of features to consider at each split (max_features), 2) the minimum number of samples at a leaf node (min_samples_leaf), and 3) the number of trees (n_estimators). For all other hyperparameters, we used default values in scikit-learn (Pedregosa et al., 2011), unless specified otherwise. We then evaluated the ability of the RF model (based on the optimized hyperparameters) to make predictions on the testing set (92 measurements), which has not been exposed to the training-validation process. To evaluate the performance of the RF models, we have calculated three different error metrics, namely, 1) coefficient of the determinant (R2), 2) root mean square error (RMSE), and 3) mean absolute percentage error (MAPE). Details on the calculation of these error metrics are given in Supplementary Material B. To improve the robustness of the model prediction, we repeated the whole process twenty times, each using a different random state during the initial training-testing split of data. This generates twenty independently trained models, enabling the prediction uncertainties to be estimated.
2.3.2 Artificial Neural Network
ANN is a mathematic model that is capable of predicting complex input-output relationships based on a collection of connected nodes called artificial neurons. These artificial neurons are arranged in hierarchical layers, with each neuron serving as a computational unit that takes input information from the previous layer and passes the processed information to the neurons in the subsequent layer. As a result, raw information from the input layer propagates through the neurons in the hidden layer in between all the way to the final output layer, where a prediction is made. Mathematically, each artificial neuron can be described using Eq. 2 below:
where,
The transfer function is critical to the performance of ANN, and here we adopt the rectified linear activation unit (ReLU) (i.e.,
The model construction process for the ANN model is similar to that of the RF model in Section 2.3.1, including the use of stratified sampling, k-fold cross-validation and twenty independent production runs. Three hyperparameters, i.e., 1) the number of neurons in the hidden layer, 2) the number of training epochs (i.e., the number of times that the whole training set pass through the ANN model), and 3) L2 regularization parameter (i.e., alpha) used to reduce overfitting by penalizing model complexity, have been optimized using a grid search method combined with stratified five-fold cross-validation on the training data (see Section 2.3.1). The optimized hyperparameters for all twenty independent production runs for both the RF and ANN models are summarized in Supplementary Table S3. A similar process was also adopted to build linear regression (LR) models to serve as the baseline for the RF and ANN models. All the ML modeling was implemented in scikit-learn and executed in python coding (Pedregosa et al., 2011).
3 Results & Discussion
3.1 Dissolution Experiments
To complement the database mined from the existing literature (see Figure 1 and Supplementary Material A), which has limited data in high pH environments relevant to modern concrete, we have performed batch dissolution experiments for quartz particles in NaOH solutions (as given in Table 1). Figure 2A shows the evolution of Si concentration (as measured using ICP-OES) released from quartz particles in 0–5 M NaOH solutions at room temperature as a function of dissolution time (i.e., samples # 16–20 in Table 1). Similar Si concentration evolution curves for samples #1–15 in Table 1 are presented in Supplementary Figure S6, with the raw ICP data given in Supplementary Material C. It is clear from Figure 2A and Supplementary Figure S6 that dissolved Si in the 0 M solution (i.e., distilled water) is almost negligible (close to the detection limit of the ICP-OES instrument) even after ∼42 days. As a result, the dissolution rates in deionized water are likely to be inaccurate. As suggested in the literature (Worley, 1994), long-term experiments (e.g., >300 days) are often needed to obtain reliable quartz dissolution rates in deionized water, especially at room temperature. This, together with the fact that there are abundant dissolution rate data at neutral pH in the database (see Figure 1), the four measurements in deionized water are not included for model construction in the next section.
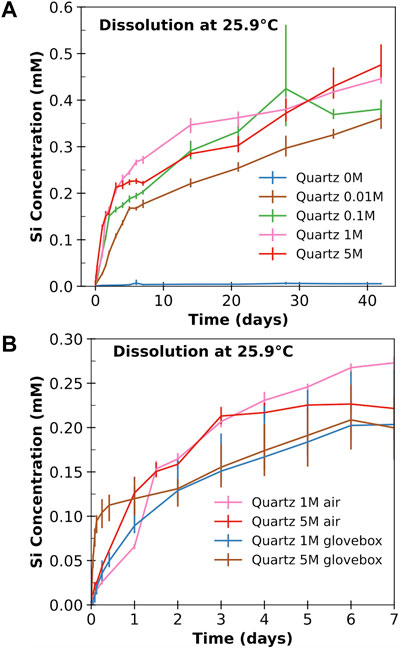
FIGURE 2. The evolution of dissolved Si concentration in mM (i.e., mmol/L) from quartz powders in five solutions with different NaOH molarities (0 M, 0.01 M, 0.1 M, 1 M, and 5 M) as a function of time at a temperature of 25.9°C. (A) shows the results from experiments performed in air, while (B) compares the data from air and glovebox experiments for 1 and 5 M NaOH. The values in the figure are the averages of three ICP-OES measurements, with the error bars indicating the range of the measured concentrations.
With the addition of NaOH at 0.01 M, a significantly higher dissolved Si concentration was observed, and the release of Si is enhanced as NaOH molarity increases from 0.01 to 1 M. However, as NaOH molarity further increases from 1 to 5 M, no obvious enhancement of Si dissolution has been observed in Figure 2A at the early stage. This might be due to carbonation during the experiment, as evidenced by the SEM-EDX results for the quartz samples in the 5 M solution in Supplementary Figure S7 and Table S6. Hence, we have repeated the experiments in 1 and 5 M NaOH solutions (i.e., #19 and #20 in Table 1) in the glovebox. The results in Figure 2B shows that the dissolved Si concentration in the glovebox experiments is noticeably higher at the early stage than those not performed in the glovebox. A comparison of the glovebox data at the early stage (within 24 h) reveals that increasing NaOH molarity from 1 to 5 M enhances quartz dissolution.
Based on slopes of the early-stage linear proportion of Figure 2, Eq. 2 and the method outlined in Section 2.2, we have calculated the dissolution rates of all quartz samples under different conditions, and the results are shown in Table 2 and Figure 3. In addition to the dissolution rates, Table 2 also gives the five dissolution conditions for all experiments, which will be used as input features in the ML models (see Section 2.3 for details on model construction) to predict dissolution rate. Given that the pH meter systematically underestimates the pH values of concentrated NaOH solutions (the extent of underestimation increases with increasing NaOH molarity (Traynor et al., 2020)), we have made corrections to the pHT values of the 0.1–5 M NaOH solutions following ref. (Traynor et al., 2020), as detailed in Supplementary Material B. It is observed from Table 2 that the measured pHT of the same NaOH solution decrease with increasing temperature, which is consistent with literature (Ashton and Geary, 2011). The dissolution rate of quartz in NaOH solution is also observed as highly dependent on temperature. For instance, the measured dissolution rates in the 0.1–1 M solutions at 85.4°C are over two orders of magnitude greater than those measured at room temperature. This strong enhancing effect of temperature on quartz dissolution is consistent with literature (Dove, 1994; Worley, 1994), as illustrated in Figure 3.
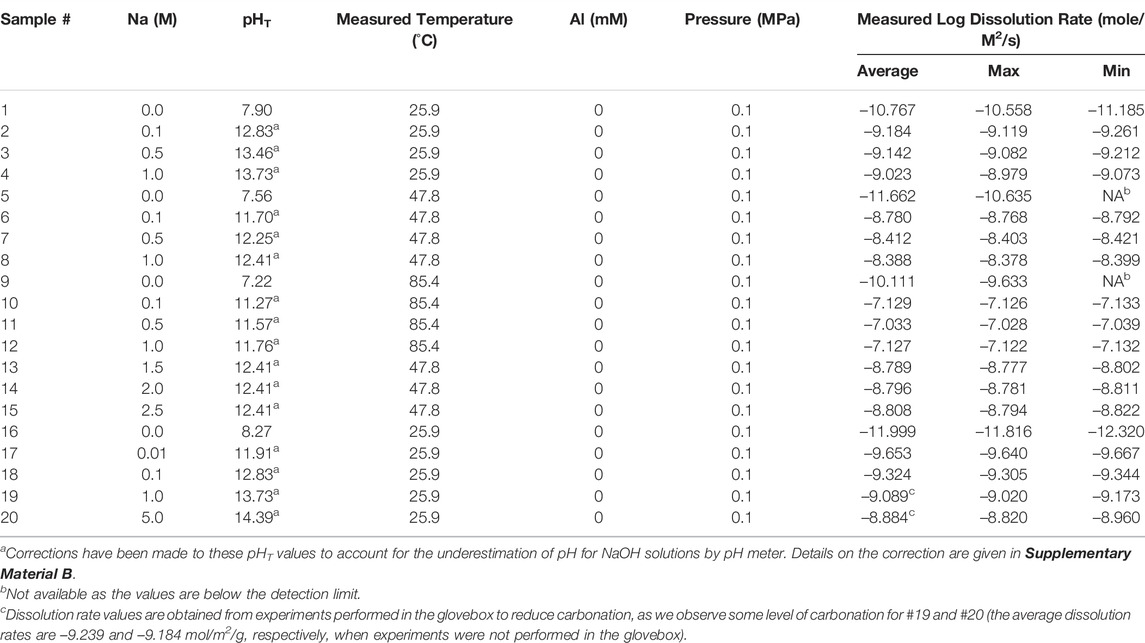
TABLE 2. Summary of the calculated log dissolution rates (in mole/m2/s), along with the five dissolution conditions (i.e., the input features that are used for constructing ML models as detailed in Section 2.3) for all batch experiments conducted here. For each experiment, an average dissolution rate, along with the maximum and minimum rates, are given in the table based on three ICP-OES measurements. The temperature values are measured using a pH meter, which are slightly different from the target temperatures (i.e., 25, 50, and 90°C).
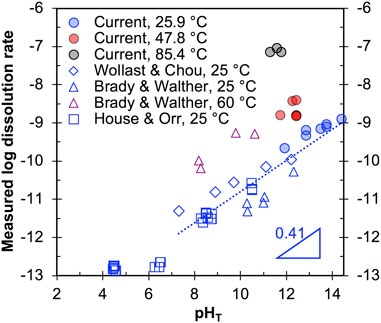
FIGURE 3. The dissolution rate data (mole/m2/s) as a function of pHT and different temperatures. Literature data from House & Orr (House and Orr, 1992), Brady & Walther (Brady and Walther, 1990), and Wollast & Chou (Wollast et al., 1988; Dove and Elston, 1992) (empty square, star, and pentagon, respectively) are compared with the results of this study (filled circles). The dotted line is given to describe the overall trend of the room temperature data at pHT ∼7–14.
Our room temperature data at pH 12 (Figure 3) generally agree with those reported by Brady & Walther (Brady and Walther, 1990) and Wollast & Chou (Wollast et al., 1988; Dove and Elston, 1992) at similar pHs, and we also see our room temperature data generally align well with the overall trend of increasing rate with increasing pH, as illustrated by the dotted line in Figure 3. The slope of this dotted line (for pHT in ∼7–14) gives the partial reaction order of quartz dissolution with respect to OH− (∼0.41), which is within the range of values reported by other studies for quartz dissolution (∼0.27–0.52) (Worley, 1994; Bandstra and Brantley, 2008; Crundwell, 2017). Finally, comparison of #13–15 in Table 2 reveals that addition of Na+ (in the form of NaCl) into the 1M NaOH solution does not lead to obvious change of dissolution rate.
3.2 Dissolution Rate Modeling
Combining the new data collected here (all the rate data in Table 2, except for #1, 5, 9 16 performed in distilled water) with data mined from the existing literature (as given in Supplementary Material A), we build three types of data-driven models (i.e., RF, ANN, and LR) for predicting quartz dissolution rate, as outlined in Section 2.2 and Supplementary Material B. The typical predictive performance of these models is illustrated in Figure 4, which shows that both RF and ANN models give excellent predictions of quartz dissolution rates across a wide range of reaction rates. Both models exhibit much better performance (i.e., significantly smaller prediction errors for both training and testing, as seen in Figures 4A,B) than simple LR model (Figure 4C). In particular, the RF model in Figure 4A has the best overall predictive performance, with an R2 value, RMSE and MAPE of ∼0.982, ∼0.318 mol/m2/s and ∼2.903% for the 15% testing set (not exposed during the training of the model), respectively.
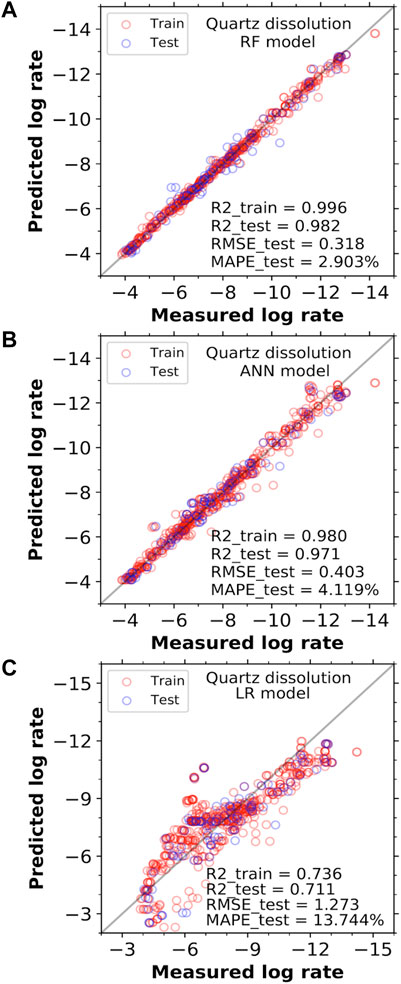
FIGURE 4. Comparison of the measured quartz dissolution rates in log scale (mole/m2/s) with the predicted values from the (A) RF, (B) ANN, amd (C) LR models, based on five input features (i.e., temperature, pHT, pressure, and Na+ and Al3+ content). In each case, the error metrics for the training set comprises 85% of the entire data set (including both the training and validation folds used during the five-fold cross-validation process), while the remaining 15% of the data that have not been exposed during model training is used as the test set. Selected error metrics (i.e., MAPE, R2 and RMSE) for both the training and testing sets are shown in the figures. The solid grey lines represent the line of equality between the measured and predicted rates.
To increase the robustness of the analysis, we have trained an ensemble of models based on different training-testing splits for each type of ML algorithm. The average error metrics for each type of algorithm, along with the standard deviations, are summarized in Table 3, where the main observations are consistent with Figure 4: 1) both RF and ANN models exhibit much better predictive performance than the LR models, and 2) RF has the best overall performance. The relatively small standard deviations for the three types of error metrics (i.e., generally less than 10% of the corresponding average values) suggest that the analysis is robust and is independent of the training-testing split. The average prediction errors for the RF and ANN models (e.g., RMSE of ∼0.310 and ∼0.435 mol/m2/g, respectively) are comparable with those achieved in previous studies using rate equations based on different reaction models (e.g., RMSE of ∼0.35–0.44 mol/m2/g) (Dove, 1994; Bickmore et al., 2008). Given that the rate equations in refs. (Dove, 1994; Bickmore et al., 2008) are obtained by fitting a smaller dataset of 285 measurements and with less complexity (e.g., the impact of pressure and Al content were not included), the comparable performance achieved with the RF and AAN models on a larger and more complex dataset compiled here demonstrate that these data-driven models are promising tools for predicting quartz dissolution (and potentially other types of mineral and glass dissolution, where sufficient experimental data are available).
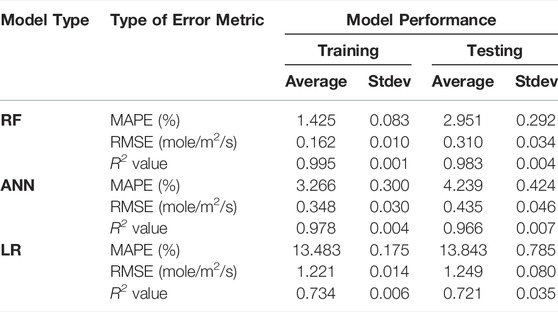
TABLE 3. Summary of the error metrics for the RF, ANN and LR models on the prediction of quartz dissolution rates. The values are averaged based on twenty independently trained models (each with a different training-testing split by using a different random state) with one standard deviation (Stdev) also given in the table. The error metrics for training are calculated based on all the 85% of the data used for training the model, i.e., including the training and validation folds used during the five-fold cross-validation process. Details on the calculation of the error metrics are given in Supplementary Material B.
3.3 Model Interpretation
While the more complex ML models like RF and ANN are able to capture complex hidden intercorrelations between input features and output targets and generates accurate predictions, their interpretability is often lower than simpler linear regression, especially the ANN model. Here, for the purpose of interpreting the trained models in Section 3.2, we employed a SHapley Additive exPlanations (SHAP) technique, developed by Lundberg and Lee based on corporative game theory (Lundberg and Lee, 2017), to evaluate how individual input feature influence the prediction target (i.e., quartz dissolution rate). The left panel of Figures 5A–C provides a summary of the distribution of the SHAP values (evaluated using the 15% testing set) for each input feature ranked with decreasing importance from top to bottom for the RF, ANN and LR models, respectively. If a feature with a higher value (toward the red color) leads to a more positive SHAP value, this feature has a positive impact on (or promotes) quartz dissolution. In contrast, if a higher feature value is associated with a more negative SHAP value, it means that this feature negatively impacts (or hinders) quartz dissolution. The right panel of Figures 5A–C provides the mean absolute SHAP value for each feature, with a higher value indicating a larger overall impact on predicted quartz dissolution rate.

FIGURE 5. Summary of the SHAP analysis for the (A) RF and (B) ANN and (C) LR models, showing the influence of input features (i.e., five dissolution conditions) on quartz dissolution rates (i.e., prediction target). The SHAP values shown are based on the 15% testing set, where the mean absolute SHAP value for each input feature is also given on the right panel of the figure. The error bars for the mean absolute SHAP value are standard deviations based on twenty independently trained models.
Therefore, the SHAP analysis in Figure 5 shows that temperature, among the five features studied here, has the largest and positive impact on quartz dissolution for all three models, as also clearly evident in Figure 1. For the RF and ANN models in Figures 5A,B, pressure is seen to be the second most important feature, also exhibiting a positive impact on quartz dissolution, which is followed by pHT and alkali content (Na+). These observations are consistent with existing literature, where the positive impact of temperature, pHT, and alkali cations (including Na+) (Dove, 1994; Worley et al., 1996; Dove, 1999; Zhang et al., 2015), and to a lesser extent pressure (Choi et al., 2012) have been documented. Our quartz dissolution data in 0.01–5 M NaOH solutions (Table 2) also show that temperature has a more pronounced impact on quartz dissolution than pHT and Na+ content.
The Al content, however, is seen to have a negative impact on quartz dissolution according to the RF and ANN models, especially for the latter, where the mean SHAP value is clearly more negative. This hindrance effect of Al species on silica dissolution in alkaline solutions has also been reported in the literature for both quartz (Bickmore et al., 2006; Bagheri et al., 2022) and silicate-based glasses (Snellings, 2013; Bagheri et al., 2022). This hindrance effect has been considered a major reason for another widely observed phenomenon in the cement and concrete community: Al additives or supplementary cementitious materials (e.g., slag, fly ash and metakaolin that contains dissolvable Al species) suppress ASR in concrete and the associated deleterious expansion (Chappex and Scrivener, 2012; Leemann et al., 2015; Zhou et al., 2019; Tapas et al., 2021). A similar hinderance effect of dissolved Al species has also been observed for other mineral dissolution, e.g., muscovite (Brantley et al., 2008). For the LR model in Figure 5C, the feature importance ranking is slightly different from those of the RF and ANN models. Specifically, the LR models have failed to capture the generally positive impact of Na content on quartz dissolution.
Next, we evaluate the extent to which the different input features influence the quartz dissolution rates predicted using the RF and ANN models. Figure 6 shows that both models predict a general trend of decreasing quartz dissolution rate with decreasing pHT, with a plateau region at around 5-7, which is consistent with literature studies (Worley, 1994; Bandstra and Brantley, 2008; Crundwell, 2017). The orders of reactions with respect to OH− (i.e., the slope of the curves in Figure 6 above pHT 7) are around 0.21–0.31 and 0.36–0.44 from the RF and ANN models, respectively, with the latter being closer to that seen in Figure 3 (∼0.4) and previously reported reaction orders nOH− of 0.27–0.52 for quartz dissolution (Worley, 1994; Bandstra and Brantley, 2008; Crundwell, 2017). Both models are seen to predict that Na+ has the largest rate-enhancing effect on quartz dissolution at near-neutral pH and Na+ content <0.5 M, which is consistent with experimental observation (Dove, 1994). However, a further increase of Na+ content from 0.5 to 1 M is seen to slightly reduce (have almost no impact on) dissolution rate according to the ANN (RF) model, especially in the near-neutral pH region.
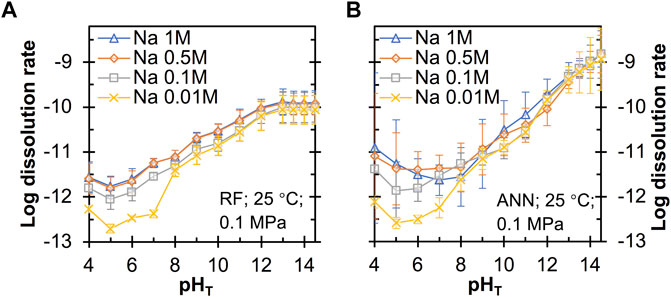
FIGURE 6. Predicted quartz dissolution rate (in mole/m2/s) at 25°C and 0.1 MPa as a function of pHT and Na content from the (A) RF and (B) ANN models. The error bars represent one standard deviation for the predictions from twenty independently trained models.
Figures 7, 8 show the predicted quartz dissolution rate (at pHT = 13 and 1M Na) as a function of temperature at different pressure and Al content, respectively, where the log dissolution rates are seen to be linearly and inversely correlated with 1,000/T in all cases, exhibiting Arrhenius-like behavior as described by Eq. 3:
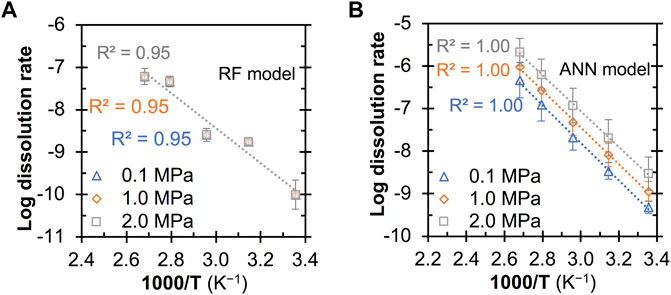
FIGURE 7. Predicted quartz dissolution rate (in mole/m2/s) at pHT = 13 as a function of temperature (i.e., 298, 318, 338, 358 and 373 (K) and pressure from the (A) RF and (B) ANN models. All the predictions are based on a Na+ content of 0.1 M and an Al content of zero. The error bars represent one standard deviation for the predictions from twenty independently trained models.
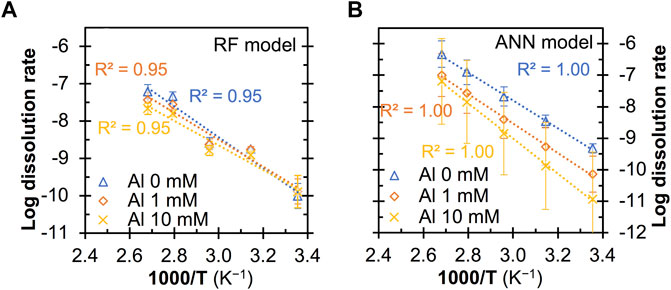
FIGURE 8. Impact of Al additives on the predicted quartz dissolution rate (in mole/m2/s) at pHT = 13 from (A) RF and (B) ANN model. All the predictions are based on a Na+ content of 0.1 M and a pressure of 0.1 MPa. The error bars represent one standard deviation for the predictions from twenty independently trained models.
where
By fitting the log dissolution rate versus 1,000/
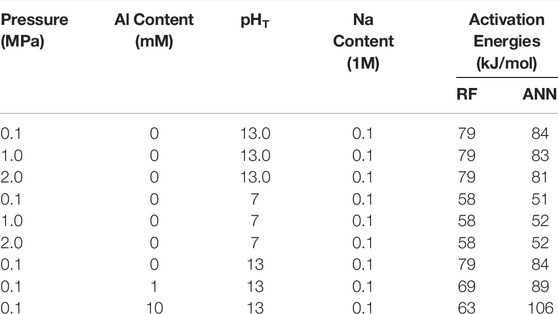
TABLE 4. Comparison of the activation energies for quartz dissolution obtained by fitting predicted quartz dissolution rates by the RF and ANN models with the Arrhenius equation (Eq. 3).
Furthermore, the ANN model is also seen to capture the hindrance effect of dissolved Al species on quartz dissolution at all considered temperatures, whereas the RF model prediction does not exhibit an obvious hindrance effect at room temperature (Figure 8A). Given that the significant hindrance effect of Al species on ASR and reduction in the associated mortar expansion have been observed for sand aggregate in cement mortar at 38°C (Chappex and Scrivener, 2012; Zhou et al., 2019), it is reasonable to expect the dissolve Al species to also exhibit a strong hinderance effect on quartz dissolution at room temperature, which has been captured by the ANN models but not the RF models. Note that most of the data points in Figures 7, 8 are outside the feature space covered in the database. This means that most of these predictions are extrapolated by the ML models, which are generally good at interpolating within the feature space (as opposed to extrapolating to feature space where there is no data at all in the database). Hence, the observations that the ANN models have captured the accelerating effect of mild pressure and the hindrance effect of Al additives on quartz dissolution while the RF model generally failed suggest that the ANN models exhibit a certain level of ability to extrapolate to uncovered feature space. Nevertheless, given the large standard deviation seen for the ANN model predictions at a pressure of 2.0 MPa (Figure 7B) and 10 mM of Al additives (Figure 8B), more data in these uncovered spaces are needed to prove or disprove observations in Figures 6–8 and further improve the quality of these data-driven models.
Finally, Table 4 shows that the apparent activation energies derived from the predicted dissolution rates (based on Eq. 3) from the RF and ANN models vary considerably depending on the dissolution conditions and type of model. Nevertheless, these values (58–79 and 51–106 kJ/mol for the RF and ANN models, respectively) are generally consistent with the wide range of activation energies being reported for quartz dissolution depending on many factors (including pH, temperature and alkali content), as summarized in ref. (Tamada et al., 2012) (46–96 kJ/mol) and ref. (Icenhower and Dove, 2000) (66–90 kJ/mol). In particular, one observation that has been reported in the literature (Brady and Walther, 1990; Worley et al., 1996) and captured here by both the RF and ANN models is that the apparent activation energies for quartz dissolution are noticeably higher at a higher pH (e.g., 79–84 kJ/mol at pHT 13 vs. 51–58 kJ/mol at pHT 7). For instance, Brady and Walther (Brady and Walther, 1990) showed that the activation energies for quartz dissolution (calculated from experimental data) increase from ∼46 kJ/mol at pH 6 to ∼96 kJ/mol at pH 11. Furthermore, the RF and ANN models show that the addition of dissolved Al species has a dissimilar impact on the apparent activation energies for quartz dissolution, and more data is needed in the future to prove or disprove this observation.
3.4 Broader Impact & Limitations
Although there are very few silica dissolution rate data from the cements and concrete community (Snellings, 2013; Bagheri et al., 2022), data mining reveals abundant quartz dissolution data across different disciplines. Data-driven ML models are seen to give accurate prediction of quartz dissolution rates as a function of different dissolution conditions. The feature exploration process identifies new and interesting trends and observations, pointing out areas where new measurements are needed. As more data in the uncovered space are collected and fed into the models, these data-driven model can be further improved. Importantly, this combined data mining, experiments and ML modeling framework could be extended to study the dissolution properties of other minerals.
Here we discuss several limitations of this study. First, several other factors influence quartz dissolution rate, beyond the five dissolution conditions considered here. This includes 1) the type of reactor (batch vs. flow reactor) (Dove and Crerar, 1990), 2) the type of cations and anions in the solution (Bennett, 1991; Dove and Nix, 1997), 3) flow rates in the case of flow reactors (Worley et al., 1996), 4) the extent of undersaturation (Dove et al., 2008), and 5) direction of the crystal plane (Liang and Readey, 1987). Accounting for all these factors is challenging for conventional reaction models. Data-driven models can capture the complex correlations between the prediction target and all possible dissolutions conditions and the impact of each individual dissolution condition on the dissolution rate can be quantified. However, we are data limited when many of these dissolution conditions are not reported in the original studies. Furthermore, although the ANN models presented here have some predictive ability in the feature space not covered in the database, more data are needed to confirm the observations (e.g., the extent of rate increase (decrease) due to application of mild pressure (addition of Al species)), given the large variation in the predicted rates.
4 Conclusion
As the most abundant free oxide on earth and a major phase in concrete aggregate, dissolution of crystalline quartz (and its polymorphs) has raised considerable interest across different fields, including geochemistry, materials science, and, more recently, the concrete field. Although rate equations based on different reaction models have been developed and shown to give accurate predictions of quartz dissolution rates as a function of temperature, pHT, and Na content for a complied dataset (with 285 measurements), their applications to more complex datasets remain to be demonstrated. Here, we introduced a data-driven approach to predict quartz dissolution for a newly complied and more complex dataset mined from the literature (with 597 measurements). Given the scarcity of quartz dissolution data in high pH environments relevant to modern concrete applications, we have collected 16 quartz dissolution rate data in NaOH solutions (0.01–5 M) at different temperatures (∼26–85°C) to complement the existing database.
Based on this new database, we have developed an ensemble of random forest (RF) and single-layer artificial neural network (ANN) models (each trained independently) to predict quartz dissolution rate as a function of the five dissolution conditions. Both the RF and ANN models are seen to give accurate predictions across the whole dataset, with R2 values of ∼0.97–0.98, MAPEs of ∼2.95–4.24% and RMSEs of ∼0.31–0.44 mol/m2/s (in log scale) for the 15% testing set. Both RF and ANN models are shown to capture some literature observations, including the different impact of temperature, pressure, pHT, Na and Al content on dissolution rate. In particular, the ANN model appears to exhibit certain level of ability to extrapolate (i.e., making predictions in feature space not covered in the database), leading to new and interesting trends and observations.
One potential direction moving forward is to incorporate other dissolution conditions into the models to enable them to predict quartz dissolution rate for more complex and realistic situations (e.g., those relevant to modern concrete environments). However, due to missing data for other dissolution conditions (e.g., the extent of undersaturation and flow rate) in some studies referred in the database, there is a need to perform missing data imputation or data augmentation. This also necessitates the collection of new data in feature space not covered in the existing database, for which the ML models can help optimize the experimental design (e.g., reduce the number of experiments while maintaining a similar level of data quality for model construction). Another potential direction is to build out the data infrastructure and ML models for other silica polymorphs (e.g., amorphous silica, cristobalite, and microcrystalline or cryptocrystalline quartz) and reactive aggregate. Overall, as a first step, this study has highlighted the vast potential of using data-driven models for predicting mineral dissolution rates, which is important to many fields.
Data Availability statement
The original contributions presented in the study are included in the article/supplementary materials, further inquiries can be directed to the corresponding author.
Author Contributions
KG and TA contributed to the conception and design of the study. KG organized the database and performed the statistical analysis. TA and SZ collected and analyzed the experimental data. KG wrote the first draft of the manuscript. TA and SZ wrote sections of the manuscript. EO acquired funding and supervised the project. All authors contributed to manuscript revision, read, and approved the submitted version.
Funding
This study received funding from MIT-IBM Watson AI Lab. The funder was not involved in the study design, collection, analysis, interpretation of data, the writing of this article or the decision to submit it for publication. All authors declare no other competing interests.
Conflict of Interest
The authors declare that the research was conducted in the absence of any commercial or financial relationships that could be construed as a potential conflict of interest.
Publisher’s Note
All claims expressed in this article are solely those of the authors and do not necessarily represent those of their affiliated organizations, or those of the publisher, the editors and the reviewers. Any product that may be evaluated in this article, or claim that may be made by its manufacturer, is not guaranteed or endorsed by the publisher.
Acknowledgments
We would like to acknowledge MRSEC Shared Experimental Facilities at MIT for the usage of XRD, SEM, and ICP-OES and the Institute for Soldier Nanotechnologies (ISN) at MIT for the usage of BET.
Supplementary Material
The Supplementary Material for this article can be found online at: https://www.frontiersin.org/articles/10.3389/fmats.2022.924834/full#supplementary-material
References
Alaejos, P., and Lanza, V. (2012). Influence of Equivalent Reactive Quartz Content on Expansion Due to Alkali Silica Reaction. Cem. Concr. Res. 42 (1), 99–104. doi:10.1016/j.cemconres.2011.08.006
Altman, N., and Krzywinski, M. (2017). Ensemble Methods: Bagging and Random Forests. Nat. Methods 14 (10), 933–934. doi:10.1038/nmeth.4438
Ashton, J. J. B. C., and Geary, L. (2011). The Effects of Temperature on pH Measurement. Tsp 1 (2), 1–7.
Bagheri, M., Lothenbach, B., Shakoorioskooie, M., and Scrivener, K. (2022). Effect of Different Ions on Dissolution Rates of Silica and Feldspars at High pH. Cem. Concr. Res. 152, 106644. doi:10.1016/j.cemconres.2021.106644
Bandstra, J. Z., and Brantley, S. L. (2008). Data Fitting Techniques with Applications to Mineral Dissolution Kinetics. In Kinetics of Water-Rock Interaction. Springer, 211–257. doi:10.1007/978-0-387-73563-4_6
Bennett, P. C. (1991). Quartz Dissolution in Organic-Rich Aqueous Systems. Geochimica Cosmochimica Acta 55 (7), 1781–1797. doi:10.1016/0016-7037(91)90023-x
Berger, G., Cadore, E., Schott, J., and Dove, P. M. (1994). Dissolution Rate of Quartz in Lead and Sodium Electrolyte Solutions between 25 and 300°C: Effect of the Nature of Surface Complexes and Reaction Affinity. Geochimica Cosmochimica Acta 58 (2), 541–551. doi:10.1016/0016-7037(94)90487-1
Bickmore, B. R., Nagy, K. L., Gray, A. K., and Brinkerhoff, A. R. (2006). The Effect of Al(OH)4− on the Dissolution Rate of Quartz. Geochimica Cosmochimica Acta 70 (2), 290–305. doi:10.1016/j.gca.2005.09.017
Bickmore, B. R., Wheeler, J. C., Bates, B., Nagy, K. L., and Eggett, D. L. (2008). Reaction Pathways for Quartz Dissolution Determined by Statistical and Graphical Analysis of Macroscopic Experimental Data. Geochimica Cosmochimica Acta 72 (18), 4521–4536. doi:10.1016/j.gca.2008.07.002
Brady, P. V., and Walther, J. V. (1990). Kinetics of Quartz Dissolution at Low Temperatures. Chem. Geol. 82, 253–264. doi:10.1016/0009-2541(90)90084-k
Brantley, S. L. (2008). “Kinetics of Mineral Dissolution,” in Kinetics of Water-Rock Interaction. 168. Editors S. L. Brantley, J. D. Kubicki, and A. F. White (New York: Springer), 151–210. doi:10.1007/978-0-387-73563-4_5
Broekmans, M. A. T. M. (2004). Structural Properties of Quartz and Their Potential Role for ASR. Mater Charact. 53 (2-4), 129–140. doi:10.1016/j.matchar.2004.08.010
Bryll, R., Gutierrez-Osuna, R., and Quek, F. (2003). Attribute Bagging: Improving Accuracy of Classifier Ensembles by Using Random Feature Subsets. Pattern Recognit. 36 (6), 1291–1302. doi:10.1016/s0031-3203(02)00121-8
Chappex, T., and Scrivener, K. L. (2012). The Influence of Aluminium on the Dissolution of Amorphous Silica and its Relation to Alkali Silica Reaction. Cem. Concr. Res. 42 (12), 1645–1649. doi:10.1016/j.cemconres.2012.09.009
Choi, J.-H., Chae, B.-G., and Kim, H.-J. (2015). Effects of Temperature and Pressure on Quartz Dissolution. J. Eng. Geol. 25 (1), 1–8. doi:10.9720/kseg.2015.1.1
Choi, J.-H., Seo, Y.-S., and Chae, B.-G. (2013). A Study of the Pressure Solution and Deformation of Quartz Crystals at High pH and under High Stress. Nucl. Eng. Technol. 45 (1), 53–60. doi:10.5516/net.06.2012.024
Choi, J. H., Kimoto, K., and Ichikawa, Y. (2012). Quartz Dissolution Experiments at Various pH, Temperature and Stress Conditions: CLSM and ICP-AES Investigations. Environ. Earth Sci. 66 (8), 2431–2440. doi:10.1007/s12665-011-1467-0
Crundwell, F. K. (2017). On the Mechanism of the Dissolution of Quartz and Silica in Aqueous Solutions. ACS Omega 2 (3), 1116–1127. doi:10.1021/acsomega.7b00019
Davis, M. C., Wesolowski, D. J., Rosenqvist, J., Brantley, S. L., and Mueller, K. T. (2011). Solubility and Near-Equilibrium Dissolution Rates of Quartz in Dilute NaCl Solutions at 398-473K under Alkaline Conditions. Geochimica Cosmochimica Acta 75 (2), 401–415. doi:10.1016/j.gca.2010.10.023
Diamond, S. (1976). A Review of Alkali-Silica Reaction and Expansion Mechanisms 2. Reactive Aggregates. Cem. Concr. Res. 6 (4), 549–560. doi:10.1016/0008-8846(76)90083-1
Diedrich, T., Dybowska, A., Schott, J., Valsami-Jones, E., and Oelkers, E. H. (2012). The Dissolution Rates of SiO2 Nanoparticles as a Function of Particle Size. Environ. Sci. Technol. 46 (9), 4909–4915. doi:10.1021/es2045053
Dong, S., Subhas, A. V., Rollins, N. E., Naviaux, J. D., Adkins, J. F., and Berelson, W. M. (2018). A Kinetic Pressure Effect on Calcite Dissolution in Seawater. Geochimica Cosmochimica Acta 238, 411–423. doi:10.1016/j.gca.2018.07.015
Dove, P. M., and Crerar, D. A. (1990). Kinetics of Quartz Dissolution in Electrolyte Solutions Using a Hydrothermal Mixed Flow Reactor. Geochimica Cosmochimica Acta 54 (4), 955–969. doi:10.1016/0016-7037(90)90431-j
Dove, P. M., and Elston, S. F. (1992). Dissolution Kinetics of Quartz in Sodium Chloride Solutions: Analysis of Existing Data and a Rate Model for 25°C. Geochimica Cosmochimica Acta 56 (12), 4147–4156. doi:10.1016/0016-7037(92)90257-j
Dove, P. M., Han, N., Wallace, A. F., and De Yoreo, J. J. (2008). Kinetics of Amorphous Silica Dissolution and the Paradox of the Silica Polymorphs. Proc. Natl. Acad. Sci. U.S.A. 105 (29), 9903–9908. doi:10.1073/pnas.0803798105
Dove, P. M., and Nix, C. J. (1997). The Influence of the Alkaline Earth Cations, Magnesium, Calcium, and Barium on the Dissolution Kinetics of Quartz. Geochimica Cosmochimica Acta 61 (16), 3329–3340. doi:10.1016/s0016-7037(97)00217-2
Dove, P. M. (1999). The Dissolution Kinetics of Quartz in Aqueous Mixed Cation Solutions. Geochimica Cosmochimica Acta 63 (22), 3715–3727. doi:10.1016/s0016-7037(99)00218-5
Dove, P. M. (1994). The Dissolution Kinetics of Quartz in Sodium Chloride Solutions at 25 Degrees to 300 Degrees C. Am. J. Sci. 294 (6), 665–712. doi:10.2475/ajs.294.6.665
Du, H., and Tan, K. H. (2014). Effect of Particle Size on Alkali-Silica Reaction in Recycled Glass Mortars. Constr. Build. Mater. 66, 275–285. doi:10.1016/j.conbuildmat.2014.05.092
Dunant, C. F., and Scrivener, K. L. (2012). Effects of Aggregate Size on Alkali-Silica-Reaction Induced Expansion. Cem. Concr. Res. 42 (6), 745–751. doi:10.1016/j.cemconres.2012.02.012
Fang, G., and Zhang, M. (2020). The Evolution of Interfacial Transition Zone in Alkali-Activated Fly Ash-Slag Concrete. Cem. Concr. Res. 129, 105963. doi:10.1016/j.cemconres.2019.105963
Heaton, J. (2008). Introduction to Neural Networks with Java. Chesterfield, MO: Heaton Research, Inc..
Heřmanská, M., Voigt, M., Marieni, C., Declercq, J., and Oelkers, E. (2022). A Comprehensive and Consistent Mineral Dissolution Rate Database: Part I: Primary Silicate Minerals and Glasses. Chem. Geol., 597.
Hooton, R. D. (1993). Influence of Silica Fume Replacement of Cement on Physical Properties and Resistance to Sulfate Attack, Freezing and Thawing, and Alkali-Silica Reactivity. ACI Mater J. 90 (2), 143–151.
House, W. A., and Orr, D. R. (1992). Investigation of the pH Dependence of the Kinetics of Quartz Dissolution at 25 °C. J. Chem. Soc. Faraday Trans. 88 (2), 233–241. doi:10.1039/ft9928800233
Icenhower, J. P., and Dove, P. M. (2000). The Dissolution Kinetics of Amorphous Silica into Sodium Chloride Solutions: Effects of Temperature and Ionic Strength. Geochimica Cosmochimica Acta 64 (24), 4193–4203. doi:10.1016/s0016-7037(00)00487-7
Ichikawa, T., and Koizumi, H. (2002). Possibility of Radiation-Induced Degradation of Concrete by Alkali-Silica Reaction of Aggregates. J. Nucl. Sci. Technol. 39 (8), 880–884. doi:10.1080/18811248.2002.9715272
John Lu, Z. Q. (2010). The Elements of Statistical Learning: Data Mining, Inference, and Prediction. Wiley Online Library.
Knauss, K. G., and Copenhaver, S. A. (1995). The Effect of Malonate on the Dissolution Kinetics of Albite, Quartz, and Microcline as a Function of pH at 70°C. Appl. Geochem. 10 (1), 17–33. doi:10.1016/0883-2927(94)00045-8
Lee, W. K. W., and van Deventer, J. S. J. (2004). The Interface between Natural Siliceous Aggregates and Geopolymers. Cem. Concr. Res. 34 (2), 195–206. doi:10.1016/s0008-8846(03)00250-3
Leemann, A., Bernard, L., Alahrache, S., and Winnefeld, F. (2015). ASR Prevention - Effect of Aluminum and Lithium Ions on the Reaction Products. Cem. Concr. Res. 76, 192–201. doi:10.1016/j.cemconres.2015.06.002
Li, X., Grasley, Z. C., Bullard, J. W., and Feng, P. (2018). Creep and Relaxation of Cement Paste Caused by Stress‐induced Dissolution of Hydrated Solid Components. J. Am. Ceram. Soc. 101 (9), 4237–4255. doi:10.1111/jace.15587
Liang, D.-T., and Readey, D. W. (1987). Dissolution Kinetics of Crystalline and Amorphous Silica in Hydrofluoric-Hydrochloric Acid Mixtures. J Am. Ceram. Soc. 70 (8), 570–577. doi:10.1111/j.1151-2916.1987.tb05708.x
Lundberg, S. M., and Lee, S-I. (2017). A Unified Approach to Interpreting Model Predictions. Adv Neur In. 30.
Maas, A. J., Ideker, J. H., and Juenger, M. C. G. (2007). Alkali Silica Reactivity of Agglomerated Silica Fume. Cem. Concr. Res. 37 (2), 166–174. doi:10.1016/j.cemconres.2006.10.011
Malouf R. (Editor) (2002). “A Comparison of Algorithms for Maximum Entropy Parameter Estimation,” COLING-02: The 6th Conference on Natural Language Learning 2002 (Taipei, Taiwan: CoNLL-2002).
Mitra, A. (2008). Silica Dissolution at Low pH in the Presence and Absence of Fluoride. Blacksburg, VA: Virginia Tech.
Nesbitt, H. W., and Young, G. M. (1984). Prediction of Some Weathering Trends of Plutonic and Volcanic Rocks Based on Thermodynamic and Kinetic Considerations. Geochimica Cosmochimica Acta 48 (7), 1523–1534. doi:10.1016/0016-7037(84)90408-3
Pedregosa, F., Varoquaux, G., Gramfort, A., Michel, V., Thirion, B., Grisel, O., et al. (2011). Scikit-learn: Machine Learning in Python. J. Mach. Learn Res. 12, 2825–2830.
Pignatelli, I., Kumar, A., Field, K. G., Wang, B., Yu, Y., Le Pape, Y., et al. (2016). Direct Experimental Evidence for Differing Reactivity Alterations of Minerals Following Irradiation: The Case of Calcite and Quartz. Sci. Rep. 6 (1), 1–10. doi:10.1038/srep20155
Rajabipour, F., Giannini, E., Dunant, C., Ideker, J. H., and Thomas, M. D. A. (2015). Alkali-silica Reaction: Current Understanding of the Reaction Mechanisms and the Knowledge Gaps. Cem. Concr. Res. 76, 130–146. doi:10.1016/j.cemconres.2015.05.024
Rimstidt, J. D. (2015). Rate Equations for Sodium Catalyzed Quartz Dissolution. Geochimica Cosmochimica Acta 167, 195–204. doi:10.1016/j.gca.2015.07.030
Rosseel, T. M., Maruyama, I., Le Pape, Y., Kontani, O., Giorla, A. B., Remec, I., et al. (2016). Review of the Current State of Knowledge on the Effects of Radiation on Concrete. Act 14 (7), 368–383. doi:10.3151/jact.14.368
San Nicolas, R., and Provis, J. L. (2015). The Interfacial Transition Zone in Alkali-Activated Slag Mortars. Front. Mat. 2, 70. doi:10.3389/fmats.2015.00070
Scherer, G. W., Funkhouser, G. P., and Peethamparan, S. (2010). Effect of Pressure on Early Hydration of Class H and White Cement. Cem. Concr. Res. 40 (6), 845–850. doi:10.1016/j.cemconres.2010.01.013
Schwartzentruber, J., Fürst, W., and Renon, H. (1987). Dissolution of Quartz into Dilute Alkaline Solutions at 90°C: A Kinetic Study. Geochimica Cosmochimica Acta 51 (7), 1867–1874. doi:10.1016/0016-7037(87)90177-3
Shi, C., and Xie, P. (1998). Interface between Cement Paste and Quartz Sand in Alkali-Activated Slag Mortars. Cem. Concr. Res. 28 (6), 887–896. doi:10.1016/s0008-8846(98)00050-7
Snellings, R. (2013). Solution-Controlled Dissolution of Supplementary Cementitious Material Glasses at pH 13: The Effect of Solution Composition on Glass Dissolution Rates. J. Am. Ceram. Soc. 96 (8), 2467–2475. doi:10.1111/jace.12480
Song, Y., Yang, K., Chen, J., Wang, K., Sant, G., and Bauchy, M. (2021). Machine Learning Enables Rapid Screening of Reactive Fly Ashes Based on Their Network Topology. ACS Sustain. Chem. Eng. 9 (7), 2639–2650. doi:10.1021/acssuschemeng.0c06978
Stanton, T. E. (2008). “Expansion of Concrete through Reaction between Cement and Aggregate,” in Selected Landmark Paper Collection on Concrete Materials Research (Farmington Hills, MI, USA: American Concrete Institute), 9–46.
Tamada, O., Gibbs, G. V., Boisen Jr., M. B., and Rimstidt, J. D. (2012). Silica Dissolution Catalyzed by NaOH: Reaction Kinetics and Energy Barriers Simulated by Quantum Mechanical Strategies. J. Mineralogical Petrological Sci. 107 (2), 87–98. doi:10.2465/jmps.110909
Tapas, M. J., Sofia, L., Vessalas, K., Thomas, P., Sirivivatnanon, V., and Scrivener, K. (2021). Efficacy of SCMs to Mitigate ASR in Systems with Higher Alkali Contents Assessed by Pore Solution Method. Cem. Concr. Res. 142, 106353. doi:10.1016/j.cemconres.2021.106353
Traynor, B., Uvegi, H., Olivetti, E., Lothenbach, B., and Myers, R. J. (2020). Methodology for pH Measurement in High Alkali Cementitious Systems. Cem. Concr. Res. 135, 106122. doi:10.1016/j.cemconres.2020.106122
Wollast, B., and Chou, L. (1988). in Physical and Chemical Weathering in Geochemical Cycles. Editors A. Lerman, and M. Meybeck (Dordrecht: Kluwer Academic Publishers).
Worley, W. G. (1994). Dissolution Kinetics and Mechanisms in Quartz-And Grainite-Water Systems. Cambridge, MA: Massachusetts Institute of Technology.
Worley, W. G., Tester, J. W., and Grigsby, C. O. (1996). Quartz Dissolution Kinetics from 100-200°C as a Function of pH and Ionic Strength. AIChE J. 42 (12), 3442–3457. doi:10.1002/aic.690421214
Zhang, R., Zhang, X., and Hu, S. (2015). Dissolution Kinetics of Quartz in Water at High Temperatures across the Critical State of Water. J. Supercrit. Fluids 100, 58–69. doi:10.1016/j.supflu.2015.02.010
Zhong, X., Deetman, S., Tukker, A., and Behrens, P. (2022). Increasing Material Efficiencies of Buildings to Address the Global Sand Crisis. Nat. Sustain, 1–4. doi:10.1038/s41893-022-00857-0
Keywords: quartz dissolution, machine learning - ML, data mining, batch dissolution experiments, ANN - artificial neural networks, radom forest
Citation: Gong K, Aytas T, Zhang SY and Olivetti EA (2022) Data-Driven Prediction of Quartz Dissolution Rates at Near-Neutral and Alkaline Environments. Front. Mater. 9:924834. doi: 10.3389/fmats.2022.924834
Received: 20 April 2022; Accepted: 15 June 2022;
Published: 06 July 2022.
Edited by:
Brant Walkley, The University of Sheffield, United KingdomReviewed by:
Enrico Masoero, Cardiff University, United KingdomYue Zhang, Qingdao University of Technology, China
Copyright © 2022 Gong, Aytas, Zhang and Olivetti. This is an open-access article distributed under the terms of the Creative Commons Attribution License (CC BY). The use, distribution or reproduction in other forums is permitted, provided the original author(s) and the copyright owner(s) are credited and that the original publication in this journal is cited, in accordance with accepted academic practice. No use, distribution or reproduction is permitted which does not comply with these terms.
*Correspondence: Elsa A. Olivetti, ZWxzYW9AbWl0LmVkdQ==