
95% of researchers rate our articles as excellent or good
Learn more about the work of our research integrity team to safeguard the quality of each article we publish.
Find out more
ORIGINAL RESEARCH article
Front. Mater. , 22 July 2022
Sec. Structural Materials
Volume 9 - 2022 | https://doi.org/10.3389/fmats.2022.915278
This article is part of the Research Topic High entropy alloy design concept enabled emerging novel materials with enhanced mechanical properties View all 7 articles
 S. Mohanty1A. Kothari1R. Raghavan2V. K. Sahu3
 N. P. Gurao3K. K. Sahu1B. K. Dhindaw1L. Zeng4M. Xia4
 S. Gollapudi1*
The effect of heat treatment on the mechanical properties of two high-carbon-containing (1.5 and 3 at%) single-phase face-centered cubic (fcc) Fe40.4Ni11.3Mn34.8Al7.5Cr6 high-entropy alloys is reported in this study. In the cold-rolled (CR) condition, the 1.5 and 3 at% C-containing alloys, referred to as CR1 and CR2, respectively, demonstrated yield strength values of 1,423 and 1,197 MPa, respectively. The corresponding values of elongation to failure was noted to be 4.05 and 4.46%, respectively. Upon heat treatment at 1,050°C, the CR1 and CR2 samples, referred to as HT1 and HT2 in the heat-treated (HT) condition, demonstrated yield strength values of 358 and 327 MPa, respectively. The elongation to failure of HT1 and HT2 was found to be 37.2 and 26.4%, respectively. The change in mechanical properties brought about by heat treatment was understood by studying the phase composition, microstructure, and crystallographic texture of the material in the CR and HT conditions. Despite the high-temperature heat treatment, the Fe40.4Ni11.3Mn34.8Al7.5Cr6 alloy retained a single-phase structure, indicating good phase stability. However, heat treatment caused a change in the grain structure. The CR materials exhibited an elongated grain structure, whereas the HT materials had an equiaxed microstructure. The CR and HT samples were found to exhibit a weak crystallographic texture although heat treatment had caused the {111} poles to orient themselves parallel to the rolling plane, whereas the CR material had a distribution of {200} poles at 45° to the rolling plane.
To increase energy efficiency and sustainability in various applications, continuous development of high-performance materials is required. Over the last decade, a new class of metallic materials known as high-entropy alloys (HEAs) have broadened the scope of alloy design. A vast range of elemental combinations has been reported, which has led to observation of phase evolution/decomposition in these multi-component alloys. HEAs are multi-component, multi-principal alloys containing at least five principal elements in equiatomic or near-equiatomic ratio with each element having concentrations ranging from 5 to 35% unlike traditional alloys with one or two principal elements (Cantor et al., 2004; Yeh et al., 2004). As the name suggests, the high entropy of mixing (≥1.5R) arising in the form of different configurations of arranging atoms along with lattice distortion, sluggish diffusion, and the cocktail leads to the formation of a simple face-centered cubic (fcc), body-centered cubic (bcc), hexagonal close-packed (hcp) disordered solid solution instead of a complex microstructure (Hsu et al., 2004; Yeh, 2006). As a result, many novel equiatomic and nonequiatomic multi-component alloys are developed with special combinations of properties, such as high strength/hardness, exceptional high-temperature strength, good structural stability, excellent corrosion resistance, hydrogen embrittlement resistance, and stress corrosion cracking resistance (Miracle et al., 2014; Mohanty et al., 2014; Tsai and Yeh, 2014; Zhang et al., 2014; Mohanty et al., 2017; George et al., 2019) Hence, there is enough scope to design and develop new multi-component HEAs with excellent mechanical properties and functional performance for various technological applications (Praveen et al., 2012; Sathiyamoorthi et al., 2017; Anupam et al., 2019; Rai et al., 2021).
Although in most of the recent studies the microstructure and mechanical properties of HEAs composed of elements that form substitutional solid solutions have been discussed, only few investigations report the designing of HEAs alloyed with interstitial elements, such as C, N, and B (Shun and Du, 2009; Wang et al., 2011; Wang et al., 2013; Zhang et al., 2013; Fang et al., 2014; Meng and Baker, 2015). One of the most promising single-phase fcc equiatomic CoCrFeMnNi HEA possessing a relatively low yield strength (YS) but very high tensile elongations and exceptional fracture toughness even at cryogenic temperatures (Cantor et al., 2004; Otto et al., 2013; Gludovatz et al., 2014; Stepanov et al., 2015; Xiang et al., 2020) showed a pronounced increase in YS, ultimate tensile strength (UTS), and high uniform elongations to fracture with the dissolution of 0.5 at% C (Wu et al., 2015). This unusual behavior of the CoCrFeMnNi alloy by the addition of carbon is similar to the effect of carbon in twinning-induced plasticity steels (Wu et al., 2015). The effect of carbon concentration on mechanical properties of CoCrFeMnNi-based HEAs was also reported by Stepanov et al. who studied CoCrFeMnNiCx alloys with x = 0, 0.1, 0.175 and 0.25 (Stepanov et al., 2016). The microhardness of the CoCrFeMnNiCx alloy was found to increase significantly with the increase of carbon content from 160 HV at x = 0 to 275 HV at x = 0.25. Chen et al. (Chen et al., 2018) too investigated the effect of carbon content on the microstructure and tensile properties of as-cast CoCrFeNiMnCx (x = 0, 0.05, 0.1, 1.5, and 2) HEAs. The strength of the alloys increases with the increase of carbon concentration, but at x = 0.1, 0.15, and 2, the ductility decreases with the increase of carbon concentration. Interestingly at x = 0.05, the ductility of the CoCrFeNiMnCx alloy was found to be higher compared to that of the base alloy.
Wang et al. (Wang and Baker, 2016; Wang et al., 2016; Wang et al., 2017) showed that the addition of 1.1 at% C to a novel single-phase fcc Fe40.4Ni11.3Mn34.8Al7.5Cr6 HEA increased the YS and led to an increase of 25% in ductility. However, there is no published information on the effect of higher quantities of carbon alloying on the FeNiMnAlCr-based alloys. The present investigation reports the effect of the addition of higher quantities of carbon (1.5 and 3 at% C) on the mechanical properties of the single-phase Fe40.4Ni11.3Mn34.8Al7.5Cr6 alloy. Studies on the high-carbon-containing alloys were carried out in both the cold-rolled (CR) and heat-treated (HT) conditions. The microstructure, phase composition, and crystallographic texture of the CR and HT materials were investigated and correlated to their mechanical properties. In addition to investigating the effect of carbon, we also attempt to evaluate the effect of heat treatment on the mechanical properties and microstructure of the cold-rolled Fe40.4Ni11.3Mn34.8Al7.5Cr6 HEA. Two alloys, one with 1.5 at% C and another with 3 at% C, each were prepared in the form of plates by casting and later rolled at 1,050°C. The mechanical properties of both the CR and HT plates were determined using microhardness measurements and tensile testing.
The multi-component Fe40.4Ni11.3Mn34.8Al7.5Cr6 (concentration in at%) HEA alloyed with 1.5 and 3 at% C were synthesized by vacuum arc melting of the pure elements with 99.99% purity under a Ti-gettered high-purity argon atmosphere on a water-cooled copper hearth using a nonconsumable tungsten electrode. The melted metal liquids were mixed and solidified instantaneously. This rapid solidification may lead to the inhomogeneity in the alloy composition. Thus, the ingots were flipped over and re-melted at least five times to ensure homogeneity of chemical composition. Following solidification, the as-cast ingots bearing nominal size of 10 mm × 3 mm × 50 mm were cold rolled using the ZK18160R model rolling mill to 50% reduction in thickness and subsequently heat treated at 1,050°C for 2 h. The CR samples with 1.5 and 3 at% C are designated as CR1 and CR2, respectively, whereas the corresponding HT samples are designated as HT1 and HT2, respectively.
The samples were subjected to metallographic sample preparation techniques of grinding and polishing to obtain a scratch-free, mirror finish. The polishing was carried out on the rolled surface. The morphology, size, and distribution of phases in the specimens were characterized using a Carl Ziess SMT AG field-emission scanning electron microscope (FESEM) operated at 20 kV. The alloys investigated using FESEM were etched in a solution of HF: HNO3: H2O (1:3:7) for 3 s after mechanically polishing. The local chemical composition of the phases was identified using energy-dispersive X-ray spectroscopy (EDX) coupled with FESEM. The phase identification of the specimen was conducted using X-ray diffraction (XRD) with the 2θ ranging from 10° to 90° at a step size of 0.01°/min. The XRD analysis was performed with a Fe-filtered Co-Kα (λ = 1.789 Å) radiation. Vickers hardness, HV, of the investigated alloys was measured on polished cross-section surfaces using a Zwick Vickers microhardness tester at an applied load of 500 gf (∼5 N) force for a dwell time of 10 s. For each sample, at least 10 measurements were carried out, and then the average value was determined using the standard deviation mentioned. The tensile specimens were machined from the CR and HT samples using electro-discharge machining, and the tensile tests were carried out using a universal testing machine at a strain rate of 10−3/s. The crystallographic texture of CR1, CR2, HT1, and HT2 was determined using electron backscattered diffraction (EBSD) studies on a JEOL field-emission gun scanning electron microscope (FEG-SEM) at 20 kV operating voltage. The samples were first polished using 100–1,500 SiC grid paper followed by 1 and 5 μm wet alumina and 0.05 μm colloidal silica cloth polishing. EBSD scans were carried out on an area of 48.06 μm × 32.76 μm with a step size of 0.09 μm for CR1, 39.54 μm × 29.06 μm with 0.12 μm step size for CR2, and 609 μm × 417.2 μm with 0.7 μm step size for HT1 and HT2. EBSD data analysis was done using OIM™ Analysis 8.0 software from TSL.
In the following, we shall describe the results obtained during the investigation of the as-cast ingots and the CR and HT samples in detail.
Figure 1A shows the XRD patterns of the CR1, CR2, HT1, and HT2 alloys. The XRD patterns indicate the presence of a single-phase fcc structure, which is in agreement with that reported by Wang et al. (Wang and Baker, 2016). For CR1 and CR2, the peaks were indexed and found to belong to the (111) and (200) planes. For HT1 and HT2, the peaks were found to belong to (111), (200), (220), (311), and (222), which is indicative of a fcc structure. It is also observed that the peaks in HT samples are a lot sharper than the XRD peaks in the CR samples. The peaks in CR samples are slightly broader, which implies the presence of a high lattice strain brought about by the cold rolling process. The lattice parameter was determined from the XRD patterns, and the same was plotted in Figure 1B. For comparison purposes, the lattice parameter data of this alloy corresponding to different carbon concentrations were taken from the work of Wang et al. and plotted alongside the lattice parameter of the alloys under study here. Figure 1B indicates that the lattice parameter of the fcc solid solution phase increases with increase in carbon concentration from 0 to 1.5 at% C, but it decreases at high carbon percentage, i.e., at 3 at% C.
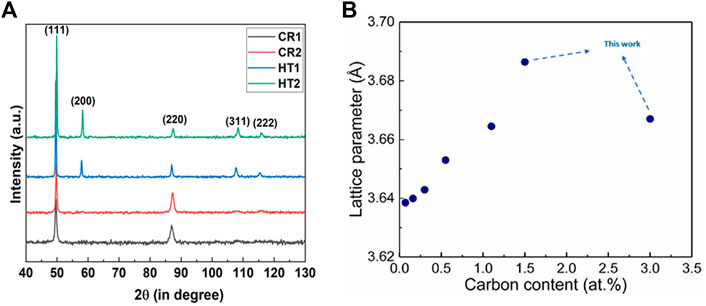
FIGURE 1. (A) X-ray diffraction patterns of CR1, CR2, HT1, and HT2. (B) Variation of lattice parameters of Fe40.4Ni11.3Mn34.8Al7.5Cr6 with carbon concentration.
The FESEM micrographs of the CR1 and CR2 alloys are shown in Figures 2A,B, respectively. The micrographs reveal the elongated grain structure of the two materials. The elongated grain structure is a signature of the cold rolling process. Following the heat treatment, the CR materials were found to develop an equiaxed grain structure as is shown in Figures 2C,D. The average grain size of the HT1 and HT2 samples as determined by the mean linear intercept technique was found to be 33 and 31 μm, respectively. The microstructures of both materials show the presence of twins. It is well known that metallic materials with an fcc crystal structure develop twins following heat treatment. Such twins are known as annealing twins. The EBSD analysis revealed the twins to be largely (111)-type twins. The EBSD maps of CR1, CR2, HT1, and HT2 are shown in Figure 3. The elongated grain structure is evident in the EBSD maps of CR1 (Figure 3A) and CR2 (Figure 3B). There are a few dark regions in the CR samples as revealed by the EBSD maps. These dark regions are regions of highly localized plastic deformation as introduced by the cold rolling process. The EBSD maps of HT1 (Figure 3C) and HT2 (Figure 3D) reveal the equiaxed nature of the grains as well as the presence of twins. The pole figures of the CR and HT samples are shown in Figure 4. In the CR material (Figures 4A,B), the 200 poles are oriented at 45° to the normal direction along the transverse direction, whereas the 111 poles are oriented at 30° to the normal direction along the rolling direction. The heat treatment process causes a change in the distribution of the poles (Figures 4C,D). The intensity of the 200 poles is weakened, whereas the 111 poles reorient themselves parallel to the normal direction. This implies that the {111} family of planes are parallel to the rolling plane in the HT samples. However, the crystallographic texture in both the CR and HT samples can be essentially described as random, considering the low values of mrd’s obtained. The maximum mrd was found to be 1.3 times random, which can be categorized as a case of weak to random crystallographic texture.
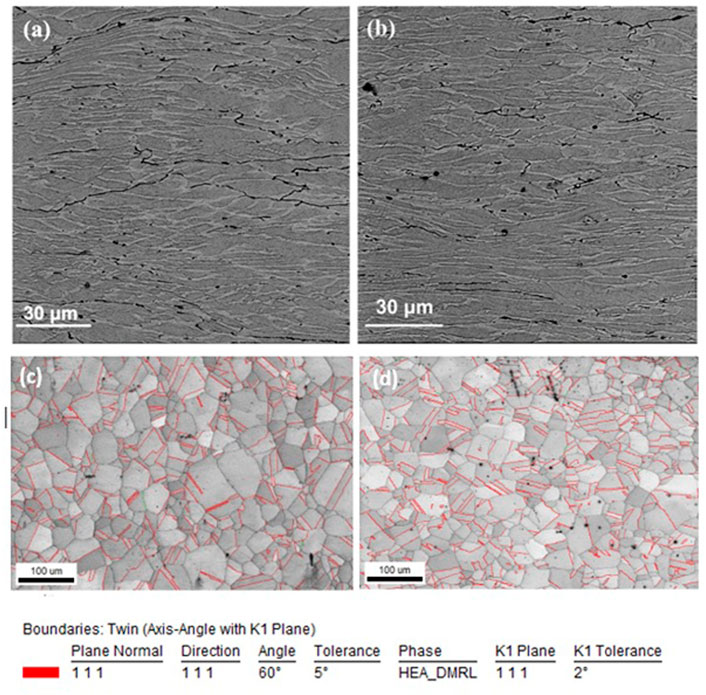
FIGURE 2. Field-emission scanning electron microscopy (FESEM) micrographs of (A) CR1 and (B) CR2. The elongated grain structure is a signature of the cold rolling process. Equiaxed grain structure of (C) HT1 and (D) HT2. The twins present in the two microstructures as indicated by red lines were indexed to be (111) twins. These are annealing-induced twins.
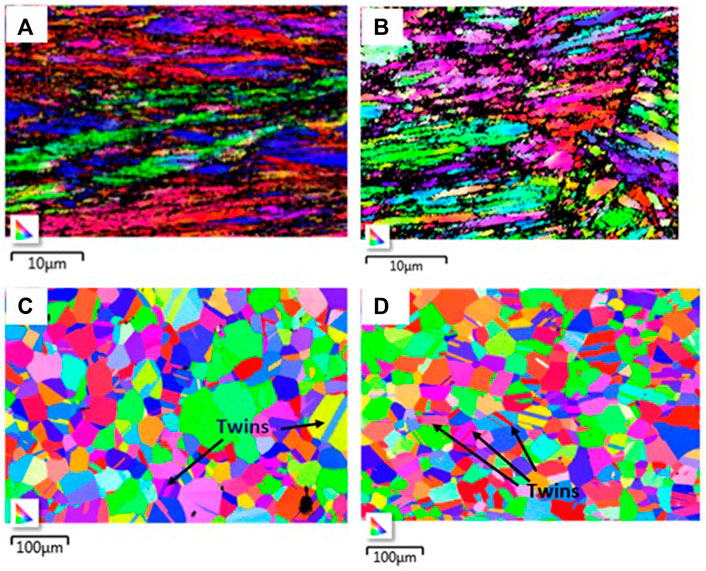
FIGURE 3. EBSD maps of CR1 (A), CR2 (B), HT1 (C) and HT2 (D). The EBSD maps of the cold rolled samples show the elongated grain structure. The dark regions in the EBSD maps indicate the localization of plastic deformation. The twins are evident in the heat-treated samples. Some of them are shown with the arrow.
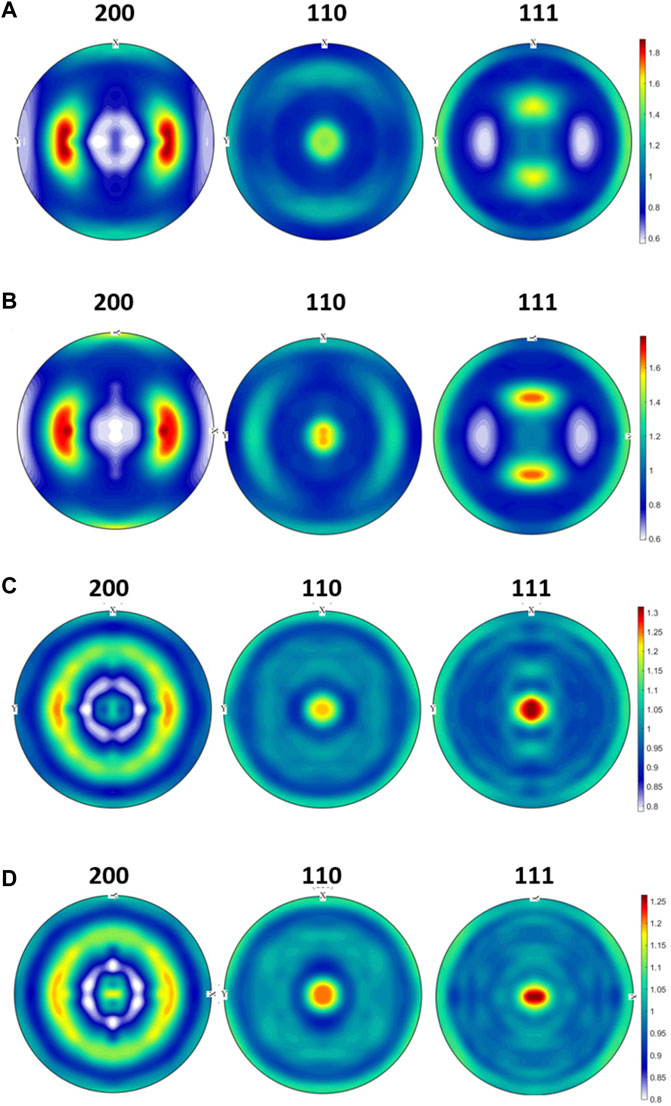
FIGURE 4. Pole figures of (200), (110), and (111) poles of CR1 (A) and CR2 (B) and HT1 (C) and HT2 (D).
Figure 5 depicts the microhardness data of the CR and HT samples. The plot reveals that the hardness of the CR1 sample (490 ± 11 VHN) is higher than that of the CR2 sample (395 ± 8 VHN). In addition, as expected, the CR samples show higher hardness than the HT ones. The microhardness of both HT1 (193 ± 7 VHN) and HT2 (189 ± 8 VHN) is similar, although the microhardness of their corresponding CR samples is different. It has been observed that the hardness of both the compositions is almost the same after the heat treatment samples as all the stress was released from the plates. It indicates that the addition of higher concentration of carbon is not improving the hardness of the alloy.
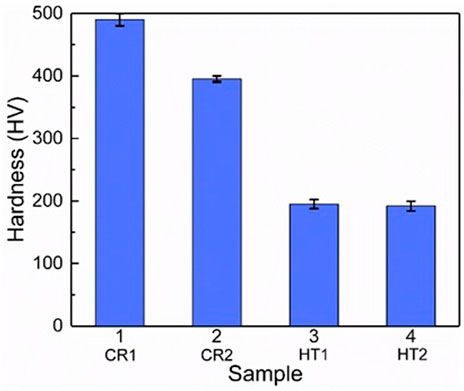
FIGURE 5. Microhardness of the CR1, CR2, HT1, and HT2 samples.
Figure 6 provides the engineering stress–strain curves for the CR and HT samples strained to failure under tension. The YS, UTS, and elongation to fracture are listed in Table 1. As Figure 6 indicates, CR1 has a higher YS and UTS than CR2. However, the elongation to failure of CR1 is marginally lower than that of CR2. The HT samples, i.e., HT1 and HT2, have lower YS and UTS than the CR samples. However, the elongation to failure of the HT samples is higher than that of the CR samples. Between HT1 and HT2, the former has a higher elongation to failure than the latter. The YS and UTS values of HT1 are higher than those of HT2.
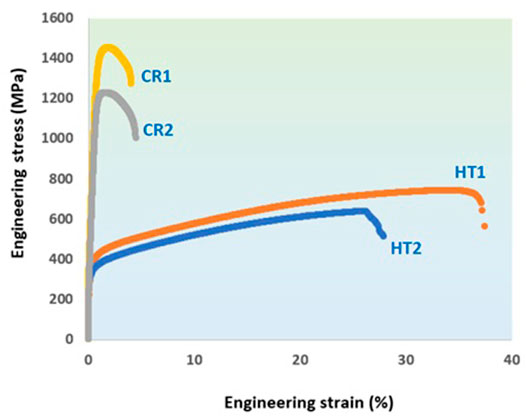
FIGURE 6. Engineering stress–engineering strain curves of the CR1, CR2, HT1, and HT2 samples.
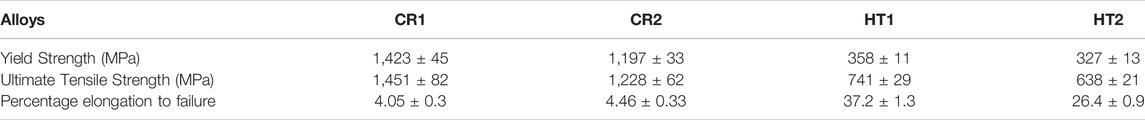
TABLE 1. Yield Strength (YS), Ultimate Tensile Strength (UTS), and Percentage elongation to failure for CR1, CR2, HT1, and HT2 alloys.
In a recent article, Baker (Baker, 2020) discussed the effect of interstitials on the mechanical properties of fcc HEAs. Baker surmises that carbon as an interstitial can be an excellent way of strengthening HEAs wherein the carbon leads to strengthening by way of expansion of the lattice of the HEA structure and the associated increase in lattice friction stress (Baker, 2020).
In order to gain an insight into the effect of carbon, we plot the variation in lattice parameter and YS of the Fe40.4Ni11.3Mn34.8Al7.5Cr6 alloy as a function of the carbon concentration. Toward this end, we take the lattice parameter, YS, and elongation data reported by Wang et al. (Wang et al., 2016) for this alloy for carbon concentrations varying from 0 to 1.1 at% and include them along with data generated in the current study for 1.5 and 3 at% C. As Figure 1B shows, the lattice parameter of the Fe40.4Ni11.3Mn34.8Al7.5Cr6 alloy increases with the addition of carbon up to a carbon concentration of 1.5 at%, beyond which it decreases. A similar trend is demonstrated by the YS vs. carbon concentration plot (Figure 7A) albeit the 1.5 at% C sample provides a strength similar to that of the 1 at% C sample. The 3 at% C samples have a slightly lower YS than the 1.5 at% C sample. Unlike its effect on the lattice parameter and YS, the effect of carbon is more prominent on the elongation to failure. As the plot Figure 7B shows, there is a significant drop in elongation to failure as the carbon concentration is increased. It is important to note here that the data taken from the work by Wang et al. (Wang et al., 2016) correspond to as-cast samples, whereas the data from this work shown in Figure 7 correspond to the HT samples HT1 and HT2. Wang et al. (Wang et al., 2016) attributed the strengthening brought about by carbon to its effect on the lattice friction stress. The interstitial carbon increases the lattice friction stress, and this leads to increase in YS at higher carbon concentrations.
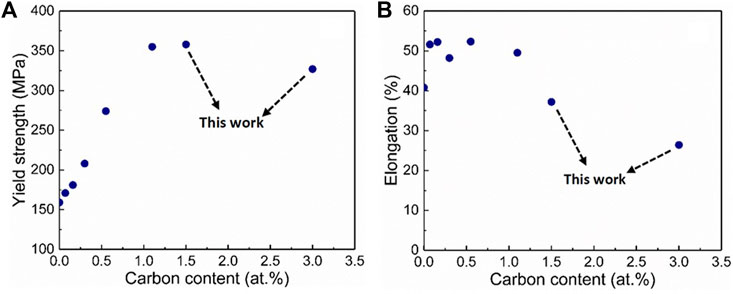
FIGURE 7. Plots of yield strength (A) and elongation to failure (B) as a function of carbon concentration. The data obtained in this work are compared to data taken from the work of Wang et al.
The alloys studied by Wang et al. (Wang et al., 2016) all had a grain size of approximately 110–130 μm, whereas the HT1 and HT2 samples being reported in this study have an average grain size of 33 and 31 μm, respectively. The effect of this difference in grain size has to be discussed in order to understand the specific role of carbon concentration on the strengthening of the Fe40.4Ni11.3Mn34.8Al7.5Cr6 alloy. Since fine-grained materials are generally known to demonstrate higher YS, the marginally higher values of YS demonstrated by HT1 and HT2 when compared to the alloys studied by Wang et al. (Wang et al., 2016) indicates that the strength of the HT1 and HT2 samples is probably being influenced by factors other than grain size. Based on their higher carbon concentration as well as finer grain structure, a higher YS was expected from the HT1 and HT2 samples when compared to alloys studied by Wang et al. (Wang et al., 2016). The observation of trends contrary to expectation suggests a possible role of crystallographic texture.
Crystallographic textures can lead to strengthening or softening depending on whether the dominant orientation is a hard orientation or a soft orientation. Texture-induced softening has been observed in the case of Mg alloys (Seipp et al., 2012) where orientation of the basal poles at 45° to the applied stress direction caused softening of the material (Kim et al., 2002). Kim et al. (Kim et al., 2002) observed the softening of Mg alloys despite grain refinement and attributed this to crystallographic orientation–induced softening of the Mg alloy. Ozturk and Davies (Öztürk and Davies, 1987) analyzed the texture-induced softening of fcc metals during plane strain deformation conditions. Dominance of crystallographically softer orientations can lead to overall softening of the material despite the presence of other favorable factors, such as fine grain size. In the current study, we observe that the HT materials have a fairly random texture although the orientation of {111} planes parallel to the rolling direction suggests the presence of some hard orientations. In fcc systems, the {111}<110> systems are the primary slip systems, and hence, easy slip on the primary slip systems demands the orientation of the slip plane at 45° to the applied stress direction. If the slip plane is oriented parallel to the applied stress direction, then slip on the {111} slip plane is prevented and other slip systems (secondary slip systems) may have to participate to support the slip process.
Wang et al. (Wang et al., 2016) have not reported the crystallographic texture of their alloys. Hence, we try to infer the same from the XRD patterns provided in their study. From their XRD patterns, we determine the I(111)/I(002) values for the different alloys investigated and compare the same to the I(111)/I(002) values exhibited by HT1 and HT2. Here I(111) is the intensity of the (111) peak, and I(002) is the intensity of the (002) or (200) XRD peak. Interestingly, the I(111)/I(002) ratio of the 1.1 at% C alloy is approximately 2.5, while the lower carbon concentration alloy, such as 0.55 and 0 at% C alloy have this value at 2.2 and 1.1, respectively. In comparison, HT1 and HT2 have I(111)/I(002) values of 5 and 4.1, respectively. This implies that the dominance of {111} is relatively higher in the HT1 and HT2 alloys than in the alloys studied by Wang et al. (Wang et al., 2016). Since the {111} plane is the primary slip plane in fcc systems, by virtue of the lower density of the {111} orientations, the alloys studied by Wang et al. (Wang et al., 2016) are harder than HT1 and HT2. This implies that crystallographic texture, albeit limited, has an influence on the strengthening achieved in HT1 and HT2 despite their higher carbon concentration as well as finer grain size. Hence, it is important to account for the crystallographic texture effects in conjunction with carbon and grain size effects to arrive at an understanding of the effects of these on the mechanical properties of the material.
Between the CR and HT materials, it is obvious that the CR material is stronger (Cheng et al., 2020) on account of the strain hardening it underwent during the cold rolling process. As mentioned earlier, the XRD peaks of the CR material are broader, which is indicative of high dislocation density. The difference in strength between the CR and HT materials is due to the dislocation density difference. The crystallographic texture of both sets of materials, i.e., CR and HT, is largely random/weak, and hence, the role of the same can be largely ruled out. Hence, we attribute the higher strength of CR and HT to dislocation density difference (Ungár, 2001) as is evident from the higher XRD peak broadening of CR samples. In addition to the XRD peak broadening, the difference in dislocation density of the CR and HT materials can also be inferred from the kernel average misorientation (KAM) maps of the CR1, CR2, HT1, and HT2 materials. In certain cases, the difference in the mechanical properties of CR and HT materials could be on account of phase transformations in the material, as was reported by Du et al. (Du et al., 2020; Du et al., 2022). However, in this material, we did not observe any phase transformations, and hence, its role can be ruled out. Thus, our focus is on the difference in dislocation density, which we evaluate through KAM maps.
The KAM value is an average misorientation value between pixels situated at the center and periphery of a kernel. It is a measurement of the intragranular misorientation, which helps measure the geometrical necessary dislocation density by equation (Krishna et al., 2020):
where
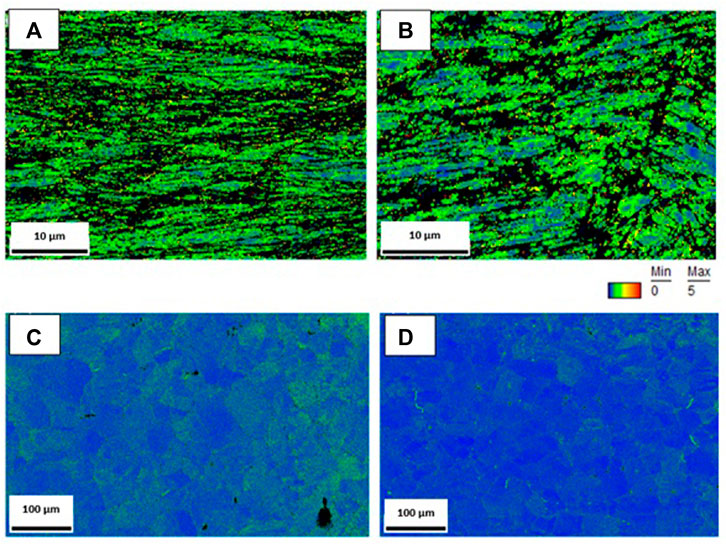
FIGURE 8. Kernel average misorientation maps of (A) CR1, (B) CR2, (C) HT1, and (D) HT2 alloys.
The higher dislocation density of HT1 is probably due to the activation of several dislocation sources within the material. As Figure 2 suggests, the lattice parameter of the HT1 sample is higher than that of the HT2 sample. This implies that a greater amount of carbon is dissolved in the HT1 sample than in the HT2 sample. Since carbon is an interstitial element, it is probably expanding the lattice by occupying the interstitial sites, resulting in a higher lattice parameter for HT1.
Herein, we would like to mention that carbon as an interstitial has been found to enhance twinning and introduce transformation-induced plasticity in the Fe49.5Mn30Co10Cr10C0.5 HEA, which in turn exhibited both enhanced strength and ductility. This was attributed to an increase in stacking fault energy brought about by the addition of carbon (Li et al., 2017). However, in our work, we believe carbon is introducing a solute drag effect. It is well known that carbon creates a solute drag effect on dislocations in steels and its effectiveness is higher than those of other solutes because of the nonsymmetric lattice distortion produced by carbon. This in turn allows it to interact with both edge and screw dislocations (Dieter, 1989). The solute drag effect on the dislocations will lead to pinning down of the dislocations, leading to higher strain hardening and also activation of other dislocation sources within the material. This in turn leads to multiplication of dislocations and consequently higher dislocation density. From Figure 8 by using Considere’s criterion of εu = n (Dieter, 1989), we find that the strain hardening exponent (n) is 0.3 for HT1 and 0.22 for HT2. Here, εu is the uniform true strain of plastic deformation. The higher n value of HT1 is consistent with our hypothesis of higher strain hardening in HT1 on account of greater dissolved carbon. Thus, the higher concentration of dissolved carbon by way of its effect on friction stress and dislocation density is the cause of the higher strength of HT1 vis-à-vis HT2. It is intriguing though as to why HT2 has a lower solid solubility for carbon despite its overall carbon concentration being higher than that of HT1. This aspect can form the subject of a future work.
1) The work reports the effect of carbon concentration on the mechanical properties of the cold-rolled and cold-rolled plus heat-treated Fe40.4Ni11.3Mn34.8Al7.5Cr6 alloys wherein the CR samples are referred to as CR1 and CR2 with CR1 having 1.5 at% C and CR2 having 3 at% C. The corresponding HT samples are referred to as HT1 and HT2 samples.
2) Between CR1 and CR2, the former is stronger with an average YS and average UTS of 1,423 and 1,451 MPa, respectively. whereas the CR2 sample exhibited average YS and average UTS of 1,197 and 1,228 MPa, respectively. The HT1 sample had an average YS and UTS of 358 and 741 MPa, respectively, whereas the HT2 sample had an average YS and UTS of 327 and 638 MPa, respectively.
3) The higher strength of CR samples was attributed to their higher dislocation density vis-à-vis the HT samples, which was established by the KAM maps.
4) The limited strengthening of HT samples could be on account of an unfavorable crystallographic texture.
The original contributions presented in the study are included in the article/Supplementary Material, and further inquiries can be directed to the corresponding author.
SM: manuscript preparation and data analysis. AK: experimentation and data analysis. RR: manuscript preparation and data analysis. VS: experimentation and data analysis. NG: resource and data analysis. KS: resource and data analysis. BD: manuscript editing and data analysis. MX: resource and data analysis. SG: manuscript writing, supervision, and data analysis. LZ: experimentation and data analysis.
The authors declare that the research was conducted in the absence of any commercial or financial relationships that could be construed as a potential conflict of interest.
All claims expressed in this article are solely those of the authors and do not necessarily represent those of their affiliated organizations, or those of the publisher, the editors, and the reviewers. Any product that may be evaluated in this article or claim that may be made by its manufacturer is not guaranteed or endorsed by the publisher.
Anupam, A., Kumar, S., Chavan, N. M., Murty, B. S., and Kottada, R. S. (2019). First Report on Cold-Sprayed AlCoCrFeNi High-Entropy Alloy and its Isothermal Oxidation. J. Mat. Res. 34, 796–806. doi:10.1557/jmr.2019.38
Cantor, B., Chang, I. T. H., Knight, P., and Vincent, A. J. B. (2004). Microstructural Development in Equiatomic Multicomponent Alloys. Mat. Sci. Eng. A 375-377, 213–218. doi:10.1016/j.msea.2003.10.257
Chen, J., Yao, Z., Wang, X., Lu, Y., Wang, X., Liu, Y., et al. (2018). Effect of C Content on Microstructure and Tensile Properties of As-Cast CoCrFeMnNi High Entropy Alloy. Mat. Chem. Phys. 210, 136–145. doi:10.1016/j.matchemphys.2017.08.011
Cheng, J., Li, J., Yu, S., Du, Z., Zhang, X., Zhang, W., et al. (2020). Cold Rolling Deformation Characteristic of a Biomedical Beta Type Ti-25Nb-3Zr-2Sn-3Mo Alloy Plate and its Influence on α Precipitated Phases and Room Temperature Mechanical Properties during Aging Treatment. Front. Bioeng. Biotechnol. 8, 598529. doi:10.3389/fbioe.2020.598529
Du, Z., Guo, H., Liu, J., Cheng, J., Zhao, X., Wang, X., et al. (2020). Microstructure Evolution during Aging Heat Treatment and its Effects on Tensile Properties and Dynamic Young's Modulus of a Biomedical β Titanium Alloy. Mat. Sci. Eng. A 791, 139677. doi:10.1016/j.msea.2020.139677
Du, Z., He, Q., Chen, R., Liu, F., Zhang, J., Yang, F., et al. (2022). Rolling Reduction-Dependent Deformation Mechanisms and Tensile Properties in a β Titanium Alloy. J. Mat. Sci. Technol. 104, 183–193. doi:10.1016/j.jmst.2021.05.071
Fang, S., Chen, W., and Fu, Z. (2014). Microstructure and Mechanical Properties of Twinned Al0.5CrFeNiCo0.3C0.2 High Entropy Alloy Processed by Mechanical Alloying and Spark Plasma Sintering. Mat. Des. (1980-2015) 54, 973–979. doi:10.1016/j.matdes.2013.08.099
George, E. P., Raabe, D., and Ritchie, R. O. (2019). High-Entropy Alloys. Nat. Rev. Mater 4, 515–534. doi:10.1038/s41578-019-0121-4
Gludovatz, B., Hohenwarter, A., Catoor, D., Chang, E. H., George, E. P., and Ritchie, R. O. (2014). A Fracture-Resistant High-Entropy Alloy for Cryogenic Applications. Science 345, 1153–1158. doi:10.1126/science.1254581
Hsu, C.-Y., Yeh, J.-W., Chen, S.-K., and Shun, T.-T. (2004). Wear Resistance and High-Temperature Compression Strength of Fcc CuCoNiCrAl0.5Fe Alloy with Boron Addition. Metall. Mat. Trans. A 35, 1465–1469. doi:10.1007/s11661-004-0254-x
Kim, W. J., An, C. W., Kim, Y. S., and Hong, S. I. (2002). Mechanical Properties and Microstructures of an AZ61 Mg Alloy Produced by Equal Channel Angular Pressing. Scr. Mater. 47, 39–44. doi:10.1016/S1359-6462(02)00094-5
Krishna, M. V., Sahu, V. K., Ghosh, A., Brokmeier, H.-G., and Gurao, N. P. (2020). In-Situ Investigation of the Evolution of Microstructure and Texture during Load Reversal of Commercially Pure Titanium Using Synchrotron X-Ray Diffraction. Mat. Charact. 159, 110039. doi:10.1016/j.matchar.2019.110039
Li, Z., Tasan, C. C., Springer, H., Gault, B., and Raabe, D. (2017). Interstitial Atoms Enable Joint Twinning and Transformation Induced Plasticity in Strong and Ductile High-Entropy Alloys. Sci. Rep. 7, 40704. doi:10.1038/srep40704
Meng, F., and Baker, I. (2015). Nitriding of a High Entropy FeNiMnAlCr Alloy. J. Alloys Compd. 645, 376–381. doi:10.1016/j.jallcom.2015.05.021
Miracle, D., Miller, J., Senkov, O., Woodward, C., Uchic, M., and Tiley, J. (2014). Exploration and Development of High Entropy Alloys for Structural Applications. Entropy 16, 494–525. doi:10.3390/e16010494
Mohanty, S., Gurao, N. P., and Biswas, K. (2014). Sinter Ageing of Equiatomic Al20Co20Cu20Zn20Ni20 High Entropy Alloy via Mechanical Alloying. Mat. Sci. Eng. A 617, 211–218. doi:10.1016/j.msea.2014.08.046
Mohanty, S., Maity, T. N., Mukhopadhyay, S., Sarkar, S., Gurao, N. P., Bhowmick, S., et al. (2017). Powder Metallurgical Processing of Equiatomic AlCoCrFeNi High Entropy Alloy: Microstructure and Mechanical Properties. Mat. Sci. Eng. A 679, 299–313. doi:10.1016/j.msea.2016.09.062
Otto, F., Dlouhý, A., Somsen, C., Bei, H., Eggeler, G., and George, E. P. (2013). The Influences of Temperature and Microstructure on the Tensile Properties of a CoCrFeMnNi High-Entropy Alloy. Acta Mater. 61, 5743–5755. doi:10.1016/j.actamat.2013.06.018
Öztürk, T., and Davies, G. J. (1987). Texture Softening and Strain Instability in F.C.C. Metals: Plane-Strain Deformation. Acta Metall. 35, 2307–2314. doi:10.1016/0001-6160(87)90078-2
Praveen, S., Murty, B. S., and Kottada, R. S. (2012). Alloying Behavior in Multi-Component AlCoCrCuFe and NiCoCrCuFe High Entropy Alloys. Mat. Sci. Engg. A 534, 83–89. doi:10.1016/j.msea.2011.11.044
Rai, N., Das, P., and Gollapudi, S. (2021). Can an Amorphous Alloy Crystallize into a High Entropy Alloy? Model. Simul. Mat. Sci. Eng. 30, 025007. doi:10.1088/1361-651x/ac2d9f
Sathiyamoorthi, P., Basu, J., Kashyap, S., Pradeep, K. G., and Kottada, R. S. (2017). Thermal Stability and Grain Boundary Strengthening in Ultrafine-Grained CoCrFeNi High Entropy Alloy Composite. Mater. Des. 134, 426–433. doi:10.1016/j.matdes.2017.08.053
Seipp, S., Wagner, M. F.-X., Hockauf, K., Schneider, I., Meyer, L. W., and Hockauf, M. (2012). Microstructure, Crystallographic Texture and Mechanical Properties of the Magnesium Alloy AZ31B after Different Routes of Thermo-Mechanical Processing. Int. J. Plasticity 35, 155–166. doi:10.1016/j.ijplas.2012.03.007
Shun, T.-T., and Du, Y.-C. (2009). Age Hardening of the Al0.3CoCrFeNiC0.1 High Entropy Alloy. J. Alloys Compd. 478, 269–272. doi:10.1016/j.jallcom.2008.12.014
Stepanov, N. D., Yurchenko, N. Y., Tikhonovsky, M. A., and Salishchev, G. A. (2016). Effect of Carbon Content and Annealing on Structure and Hardness of the CoCrFeNiMn-Based High Entropy Alloys. J. Alloys Compd. 687, 59–71. doi:10.1016/j.jallcom.2016.06.103
Stepanov, N., Tikhonovsky, M., Yurchenko, N., Zyabkin, D., Klimova, M., Zherebtsov, S., et al. (2015). Effect of Cryo-Deformation on Structure and Properties of CoCrFeNiMn High-Entropy Alloy. Intermetallics 59, 8–17. doi:10.1016/j.intermet.2014.12.004
Tsai, M.-H., and Yeh, J.-W. (2014). High-Entropy Alloys: A Critical Review. Mat. Res. Lett. 2, 107–123. doi:10.1080/21663831.2014.912690
Ungár, T. (2001). Dislocation Densities, Arrangements and Character from X-Ray Diffraction Experiments. Mater. Sci. Eng. A 309-310, 14–22. doi:10.1016/S0921-5093(00)01685-3
Wang, Y. P., Li, D. Y., Parent, L., and Tian, H. (2011). Improving the Wear Resistance of White Cast Iron Using a New Concept - High-Entropy Microstructure. Wear 271, 1623–1628. doi:10.1016/j.wear.2010.12.029
Wang, Y. P., Li, D. Y., Parent, L., and Tian, H. (2013). Performances of Hybrid High-Entropy High-Cr Cast Irons during Sliding Wear and Air-Jet Solid-Particle Erosion. Wear 301, 390–397. doi:10.1016/j.wear.2012.12.045
Wang, Z., Baker, I., Cai, Z., Chen, S., Poplawsky, J. D., and Guo, W. (2016). The Effect of Interstitial Carbon on the Mechanical Properties and Dislocation Substructure Evolution in Fe40.4Ni11.3Mn34.8Al7.5Cr6 High Entropy Alloys. Acta Mater. 120, 228–239. doi:10.1016/j.actamat.2016.08.072
Wang, Z., Baker, I., Guo, W., and Poplawsky, J. D. (2017). The Effect of Carbon on the Microstructures, Mechanical Properties and Deformation Mechanisms of Thermomechanically Treated Fe40.4Ni11.3Mn34.8Al7.5Cr6 High Entropy Alloy. Acta Mater. 126, 346–360. doi:10.1016/j.actamat.2016.12.074
Wang, Z., and Baker, I. (2016). Interstitial Strengthening of a f.c.c. FeNiMnAlCr High Entropy Alloy. Mat. Lett. 180, 153–156. doi:10.1016/j.matlet.2016.05.122
Wu, Z., Parish, C. M., and Bei, H. (2015). Nano-Twin Mediated Plasticity in Carbon-Containing FeNiCoCrMn High Entropy Alloys. J. Alloys Compd. 647, 815–822. doi:10.1016/j.jallcom.2015.05.224
Xiang, K., Chen, L.-Y., Chai, L., Guo, N., and Wang, H. (2020). Microstructural Characteristics and Properties of CoCrFeNiNbx High-Entropy Alloy Coatings on Pure Titanium Substrate by Pulsed Laser Cladding. Appl. Surf. Sci. 517, 146214. doi:10.1016/j.apsusc.2020.146214
Yeh, J.-W., Chen, S.-K., Lin, S.-J., Gan, J.-Y., Chin, T.-S., Shun, T.-T., et al. (2004). Nanostructured High-Entropy Alloys with Multiple Principal Elements: Novel Alloy Design Concepts and Outcomes. Adv. Eng. Mat. 6, 299–303. doi:10.1002/adem.200300567
Yeh, J.-W. (2006). Recent Progress in High-Entropy Alloys. Ann. Chim. Sci. Mat. 31, 633–648. doi:10.3166/acsm.31.633-648
Zhang, H., He, Y., and Pan, Y. (2013). Enhanced Hardness and Fracture Toughness of the Laser-Solidified FeCoNiCrCuTiMoAlSiB0.5 High-Entropy Alloy by Martensite Strengthening. Scr. Mat. 69, 342–345. doi:10.1016/j.scriptamat.2013.05.020
Keywords: HEA, FCC, cold rolled, texture, carbon
Citation: Mohanty S, Kothari A, Raghavan R, Sahu VK, Gurao NP, Sahu KK, Dhindaw BK, Zeng L, Xia M and Gollapudi S (2022) Microstructure and Mechanical Properties of High-Carbon-Containing Fe-Ni-Mn-Al-Cr High-Entropy Alloy: Effect of Thermomechanical Treatment. Front. Mater. 9:915278. doi: 10.3389/fmats.2022.915278
Received: 07 April 2022; Accepted: 01 June 2022;
Published: 22 July 2022.
Edited by:
Ravi Sankar Kottada, Indian Institute of Technology Madras, IndiaReviewed by:
Liang-Yu Chen, Jiangsu University of Science and Technology, ChinaCopyright © 2022 Mohanty, Kothari, Raghavan, Sahu, Gurao, Sahu, Dhindaw, Zeng, Xia and Gollapudi. This is an open-access article distributed under the terms of the Creative Commons Attribution License (CC BY). The use, distribution or reproduction in other forums is permitted, provided the original author(s) and the copyright owner(s) are credited and that the original publication in this journal is cited, in accordance with accepted academic practice. No use, distribution or reproduction is permitted which does not comply with these terms.
*Correspondence: S. Gollapudi, c3Jpa2FudGdAaWl0YmJzLmFjLmlu
Disclaimer: All claims expressed in this article are solely those of the authors and do not necessarily represent those of their affiliated organizations, or those of the publisher, the editors and the reviewers. Any product that may be evaluated in this article or claim that may be made by its manufacturer is not guaranteed or endorsed by the publisher.
Research integrity at Frontiers
Learn more about the work of our research integrity team to safeguard the quality of each article we publish.