 Zirui Chen
 Yongfu Zhao
 Zongpei Wu
- Reactor Engineering Sub-Institute, Nuclear Power Institute of China, Chengdu, China
Corrosion behaviors, microstructures of oxide films, and hydrogen absorptions of a Chinese domestic Zr alloy in 6.7 × 10⁻³ mol/L ammonia solution and 2.9 × 10⁻⁴ mol/L LiOH+9.3 × 10⁻² mol/L H3BO3 solution at 360 °C, 18.6 MPa were studied. Weight gains, oxide film thicknesses, and hydrogen absorptions showed that the corrosion rate in the ammonia solution is a little higher than that in the boron–lithium solution. There is no significant difference in the microstructure and crystalline structure between the oxide films formed in the two types of solutions. The element distributions along the depth direction of the oxide films showed the existence of nitrogen in the oxide film formed in ammonia solution. Moreover, nitrogen was found to be segregated in local areas in a range of about 2 μm from the oxide/metal interface. The corrosion behavior of the Chinese domestic Zr alloy in 360 °C aqueous solution shows no difference with other Zr alloys.
Introduction
Zirconium alloys are the main fuel cladding materials in nuclear power stations (NPPs) as they have low thermal neutron absorption cross section, good corrosion resistance, and mechanical properties (Cox, 2005; Yilmazbayhan et al., 2006; Ni et al., 2012; Motta et al., 2015; Duan et al., 2017). Among the zirconium alloys, Zr–Sn alloys such as zircaloy-2 and zircaloy-4 are widely used in water reactors from the 1950s to the 1990s (Motta et al., 2015). Zr–Nb alloys, such as Zr–2.5Nb and M5 have both good protections against hydrogen ingress and corrosion properties. With the increasing demand for higher burn-up of nuclear fuel, the need for higher waterside corrosion resistance of fuel cladding materials is proposed. Thereupon, Zr–Sn–Nb alloys with better corrosion resistance are developed.
In China, although most of the primary coolant of NPPs is boron–lithium type, there are still several VVER units whose primary coolant is boron–potassium–ammonia type. In the primary coolant, ammonia can not only act as a pH-controlling agent but also can adjust hydrogen concentration by its radiolysis decomposition (Kysela et al., 1996; Kim et al., 2007). However, the corrosion behavior of the Zr alloys especially Zr–Sn–Nb alloy is rarely considered in the boron–potassium–ammonia water chemistry environment. Garzarolli et al. found a large increase in the corrosion rate of zirconium alloy when tested in 20% NH4OH in 400 °C steam, but only in nickel autoclave (Garzarolli et al., 1993). Titanium, which belongs to the same elemental group as zirconium, also shows acceleration in corrosion and hydrogen absorption when tested in 360°C ammonia aqueous solution (Kim et al., 2002; Kim et al., 2007).
Therefore, it is necessary to study the influence of ammonia on the corrosion behavior of zirconium alloy in 360°C ammonia solution. In this work, the corrosion behavior of a Chinese domestic Zr–Sn–Nb alloy is studied.
Experimental
The chemical composition of the Zr–Sn–Nb alloy is listed in Table 1. The dimensions of the specimens are 30 mm × 20 mm × 2 mm, and a Φ2-mm hole was drilled on each specimen. All specimens were hung with Zr wires through those Φ2 mm holes during the test. Before the autoclave test, all specimens are grinded by an SiC paper (up to 800#), and pickled in a solution of 10% HF, 45% HNO3, and 45% H2O (volume percent) to remove surface oxide formed during manufacturing. In order to show the influence of ammonia, two types of aqueous solutions with close pH300 °C were compared as shown in Table.2. The B–Li solution is a common simulated primary loop coolant in pressurized water reactor NPPs. The autoclave tests lasted for 300 days at 360°C and 18.6 MPa. The weight gain of all specimens was measured every 30 days during the whole test. In general, the corrosion test followed the ASTM G2/G2M-19 Standard.
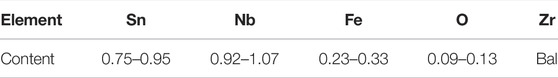
TABLE 1. Chemical composition of the Zr–Sn–Nb alloy (wt%).
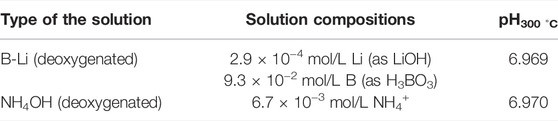
TABLE 2. Aqueous solutions compared in this study.
The crystalline structures of the oxide films were analyzed using Bruker D8 Discovery X-ray diffraction (XRD) in the scanning range of 10–80° (2θ). A JSM-7500F field emission scanning electron microscope (FESEM) attached with an energy dispersive spectroscopy (EDS) was used to observe the surface, the cross-sectional morphology of oxidation films, and chemical compositions of the specimens. Thin foils of cross sections of the oxide films were prepared using a Helios Nanolab 600i focused ion beam (FIB) with an initial milling current of 7,000–300 pA at 30kV. The morphologies and microstructures of the cross section of oxide films were observed by an FEI Themis Z transmission electron microscope. The distributions of elements in oxide films along the depth direction were measured by performing glow discharge optical emission spectrometry (GDOES) analyses. The hydrogen contents of the corroded specimens were analyzed by using a HORIBA EMGA-800 oxygen/nitrogen/hydrogen determinator, and the hydrides were observed in the cross sections of the matrix of the corroded specimens using an optical microscope.
Results
Figure 1 shows the weight gain curves of the Zr–Sn–Nb alloy in the two types of aqueous solutions for 300 days. The fitted weight gain–corrosion time relationships are listed in Table 3.
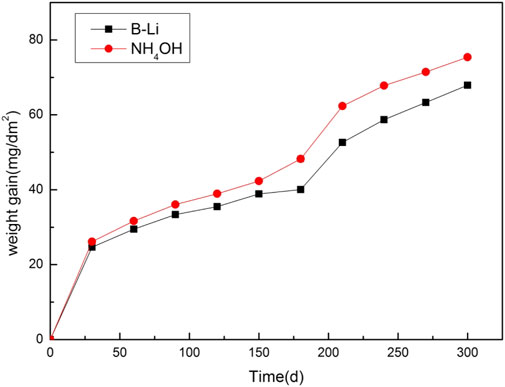
FIGURE 1. Weight gain curves of the Zr–Sn–Nb alloy in the two types of aqueous solutions.

TABLE 3. Fitted weight gain–corrosion time relationships of the Zr–Sn–Nb alloys.
As shown in Figure 1, the corrosion behavior of the Zr–Sn–Nb alloy in two types of aqueous solutions seems to follow the same law. Both transitions occur after about 180 days. The oxidation kinetics follow a parabolic trend during post-transition, as fitted in Table 3. The corrosion rate of the Zr–Sn–Nb alloy in the B–Li solution is a little lower than that in the NH4OH solution. After the 300-day tests, the weight gains of the Zr–Sn–Nb alloy in B–Li solution and in NH4OH solution are about 67.15 mg/dm2 and 75.44 mg/dm2, respectively.
Figure 2 shows the surface morphologies of the oxidation films on the specimens after 30, 90, 150, 240, and 300 days of tests in the two types of solutions. After first 30 days of test, compact oxide films can already be seen on the specimens in both two types of solutions. Wave terrains which may be related to inhomogeneous oxidation can be found on all specimens. No cracks but a few microspores and oxide particles were found on the surfaces of the specimens. No apparent changes in the oxidation morphology were found as the tests went on. The EDS results show that the chemical compositions of all specimens after different days of test in the two types of solutions were nearly the same as shown in Table 4. All of them are oxides with about 70 wt% Zr.
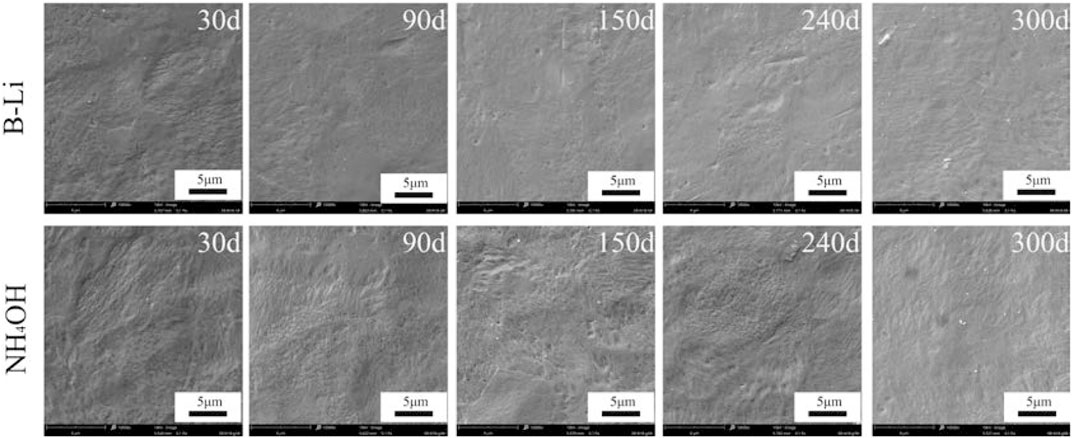
FIGURE 2. SEM images of the surface morphologies of the oxidation films.
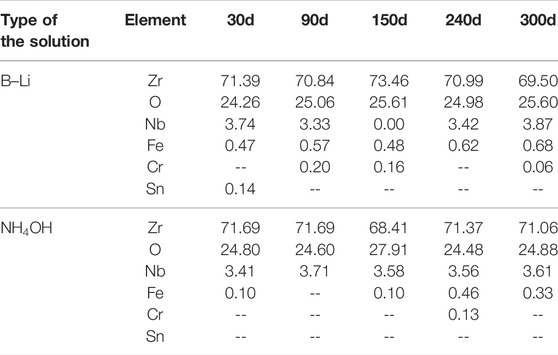
TABLE 4. EDS results of the chemical compositions of the surface oxide films (wt%).
The cross-sectional morphologies of the oxide films on the specimens after 30, 90, 150, 240, and 300 days of test in the two types of solutions are shown in Figure 3 (the white dotted lines in the images are the oxide/metal interface marked by the authors). The cross-sectional morphologies show that the oxide films are compact and uniform in thickness. Preferential oxidation can be found in some local areas. In the oxide films on specimens tested in NH4OH solution, a few short cracks which are parallel to the surface can be found after 150 days of the test. In the specimens tested in B–Li solution, a few cracks can also be found in oxide files near oxide/metal interfaces. These cracks are usually formed due to inhomogeneous oxidation in local areas which leads to tensile stress perpendicular to the surface and compressive stress parallel to the surface (Polatidis et al., 2013). As the cracks appeared earlier in the specimens tested in NH4OH solution than those tested in B–Li solution, it can be concluded that the corrosion rate of the specimens tested in NH4OH solution is faster.

FIGURE 3. SEM images of the cross-sectional morphologies of the oxidation films.
The thickness of the oxide films is the average value of ten sites which were randomly selected on each specimen. The results are shown in Figure 4. The oxide films on the specimens tested in the NH4OH solution are a little thicker than those tested in the B–Li solution. It is consistent with the weight gain results shown in Figure 1. Moreover, the error bars shown in Figure 4 also reveal the inhomogeneous oxidation of the Zr–Sn–Nb alloy, which is commonly found in Zr alloys (Liu et al., 2019).
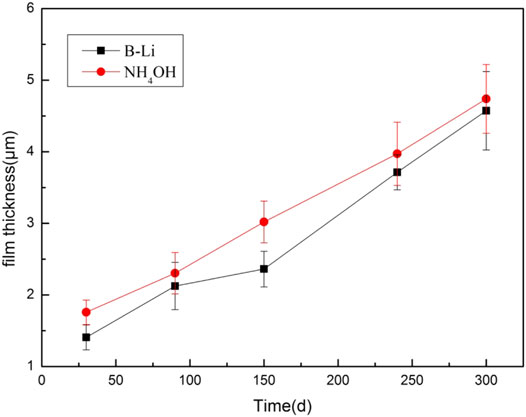
FIGURE 4. Thickness change of the oxide films tested in two types of solutions.
Figure 5 shows the XRD results of the specimens tested in the two types of solutions after 30, 150, and 300 days. After 30 days of the test, most of the strong diffraction peaks are Zr matrix and a few of them are tetragonal-ZrO2 (t-ZrO2) on the specimens tested in both types of solutions. This is because the oxide films are rather thin and the X-ray diffraction results show information of Zr-matrix under the oxide films. The other reason is that there may still be some unoxidized Zr-matrix among the oxide films. After 150 days of the test, a lot of weak monoclinic-ZrO2 (m-ZrO2) peaks appeared, which means that lots of m-ZrO2 oxides nucleated. But strong peaks show that there are still a lot of t-ZrO2 and Zr matrices on the surface. It is consistent with the results of Kritskii et al. (Kritskii et al., 2013). After 300 days of the test, strong m-ZrO2 peaks can be found in both XRD spectrums. Moreover, the m-ZrO2 peaks from the surface of the specimens tested in NH4OH solution are even stronger, which means that there may be more m-ZrO2 on the specimens tested in solution than those tested in B–Li solution (Gravie and Nicholson, 1972; Garzarolli et al., 1991; Gravie and Nicholson, 2006). The oxidation process of Zr is often as follows: t-ZrO2 first formed, and as the process went on, t-ZrO2 transformed into m-ZrO2 (Malinovschi et al., 2017; Balakrishnan et al., 2018); it can be concluded that the t- ZrO2 to m-ZrO2 transformation is faster in the specimen tested in NH4OH solution.
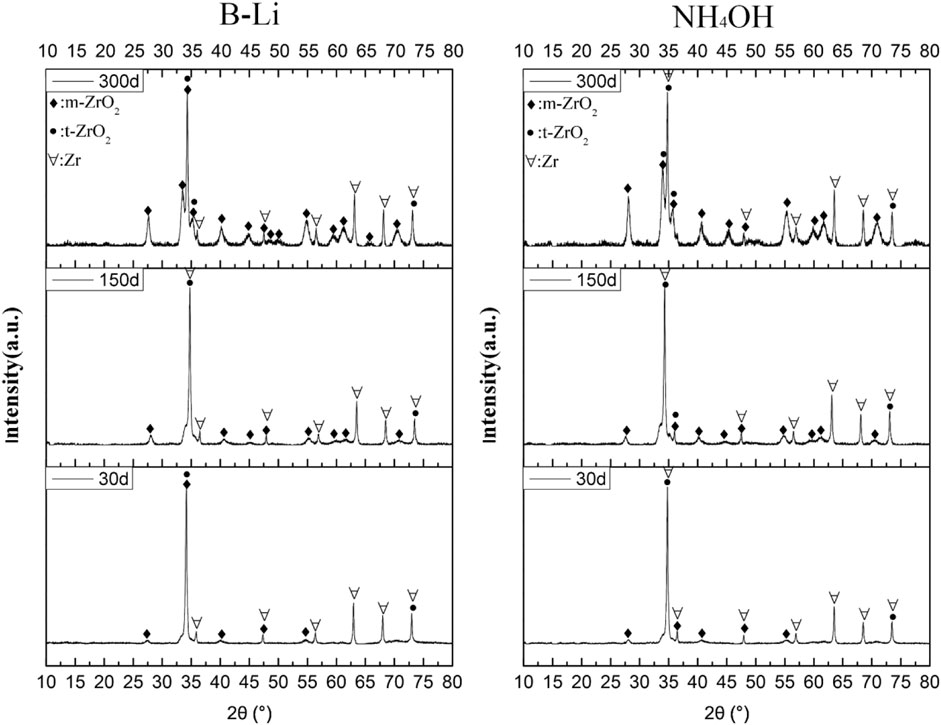
FIGURE 5. XRD results of the specimens tested in two solutions after 30, 150, and 300 days.
Figures 6A,C show the cross-sectional morphologies of oxide films on the specimen tested in B–Li solution and NH4OH solution after 300 days, respectively. It can be found that both the two oxide films are formed by a layer of equiaxed crystal with a thickness of 300–500 nm and a columnar crystal layer beneath it. Figures 6B,D are the high-resolution TEM (HRTEM) images taken from the equiaxed layers of Figures 6A,C, respectively. It is obvious that the grain size of both the equiaxed crystals ranges from 5 to 30 nm. Fast Fourier transformations (FFT) were carried out according to the images marked by white squares in Figures 6B,D. The results show that these equiaxed crystals are m-ZrO2 oxides which are consistent with XRD results. In general, there is no difference in oxide morphology, crystalline structure, and grain size between the oxide films on the specimens after 300 days of the test in both B–Li and NH4OH solutions.
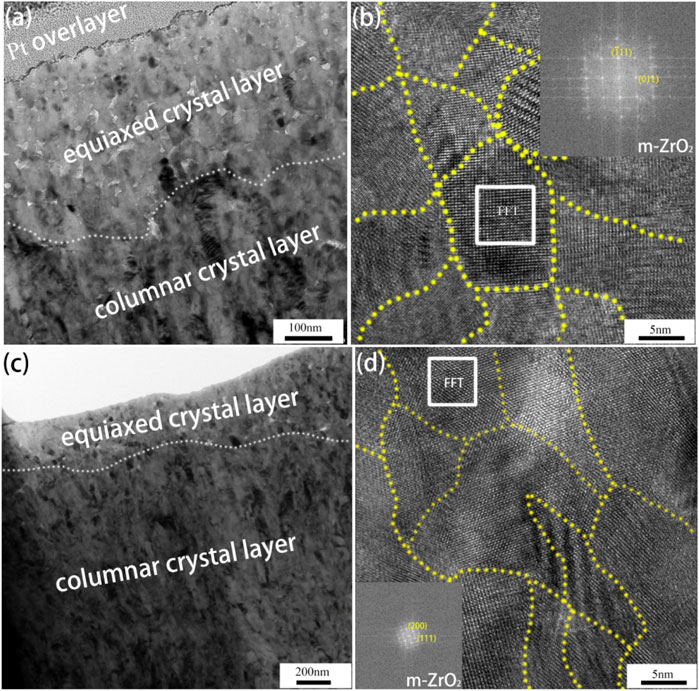
FIGURE 6. TEM images and HRTEM images of oxide films on the specimen tested in (A,B) B–Li and (C,D) NH4OH solutions after 300 days.
Figure 7 shows the hydrides precipitated in the matrix of the specimens after 30, 90, 150, 240, and 300 days of the test in the two types of solutions. Vermicular hydrides can be found randomly distributed in the matrix. The lengths of the hydrides increase with the experiment going on in both types of solutions. In the first 90 days of the experiment, the lengths of the hydrides are almost the same. After 150 days of the experiment, the hydrides in the specimens tested in NH4OH solution are much longer than those tested in B–Li solution. Especially in the specimens after 300 days tested in NH4OH solution, some of the hydrides seem interconnected.
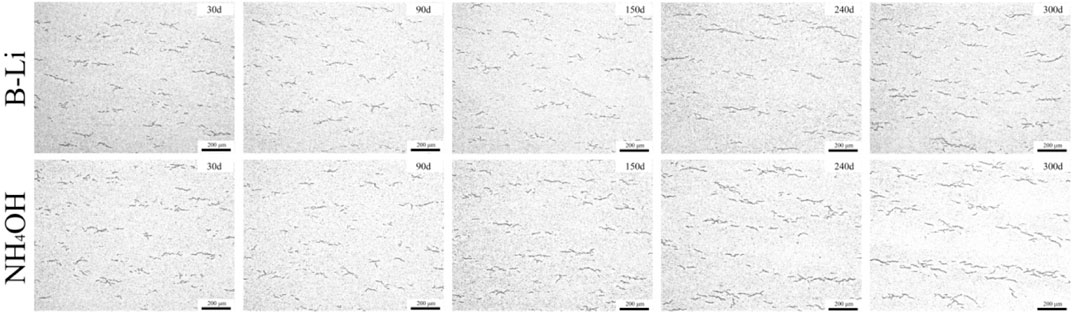
FIGURE 7. Hydrides in the matrix of the specimens after 30, 90, 150, 240, and 300 days of the test in the two types of solutions.
An oxygen/nitrogen/hydrogen determinator was used to measure the hydrogen absorption concentration in the specimens after the experiment, and the results are shown in Table.5. The hydrogen absorption concentrations in the specimens tested in both the two solutions increase as the experiments go on. After 150 days of the test, the hydrogen absorption concentration in specimens tested in NH4OH solution is relatively higher than that tested in B–Li solution.
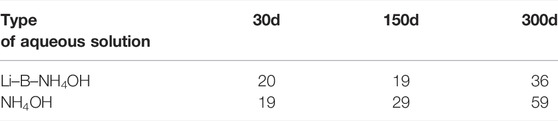
TABLE 5. Hydrogen absorption in the specimens in the two solutions after 30, 150, and 300 days of the test.
The distributions of B, Li, N, H, and O in oxide films along the depth direction on the specimens after 300 days test are shown in Figure 8. Taking elements’ diffusion into account, the middle points in the last segments of oxygen content trend curves are considered oxide/metal interfaces as marked in Figure 8. The thicknesses of the oxide films got through this method are very close to the results shown in Figure 4. It also can be found that the oxide film formed in NH4OH solution is a little thicker than that formed in B–Li solution which is consistent with Figure 4. It is apparent that nitrogen existed in the oxide film formed in the NH4OH solution, while there is no nitrogen in the oxide film formed in the B–Li solution. In the range where the depth is from 2 to 4μm, local enrichment of nitrogen can be found. In the matrix near the oxide/metal interface, a very small amount of nitrogen can also be found.
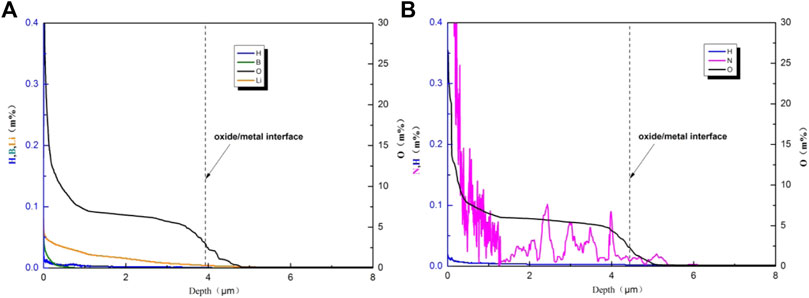
FIGURE 8. Distributions of elements in oxide films tested in (A) B–Li solution and (B) NH4OH solution along the depth direction.
Discussion
The weight gain of the Zr–Sn–Nb alloy tested in NH4OH solution is higher than that tested in B–Li solution throughout the whole 300 days of the experiment. It is consistent with the results of the thickness of the film, lengths of hydrides in the matrix, and hydrogen absorption. As the pH of the NH4OH solution is quite close to the pH of the B–Li solution at a high temperature, it can be inferred that the addition of ammonia leads to an increase in weight gain. Moreover, the XRD and TEM results showed that there were no differences in the morphologies, phases, and crystalline structures of the oxides on the specimens tested in the two types of solutions. It means that the addition of ammonia only increases the corrosion rate of the Zr–Sn–Nb alloy to some extent, but did not change the corrosion mechanism. In general, the corrosion behavior of the Zr–Sn–Nb alloy in 360°C aqueous solution shows no apparent difference with other Zr alloys (Han and Rheem, 1994; Dong et al., 2013; Lai et al., 2020).
However, the GDOES results showed the existence of nitrogen in the oxide film on the specimen tested in the NH4OH solution. As former studies show that when the concentration of nitrogen in the Zr alloy exceeds 0.004%, the corrosion rate will significantly increase (Lustman and Kerze, 1955). In this study, the nitrogen concentration of the oxide/metal interface is much higher than 0.004%, as shown in Figure 8.
The influence of traces of nitrogen on the corrosion rate of the Zr alloy can be explained as follows (Macdonald, 2012; Motta et al., 2015): oxygen in the water molecule first dissociates and is absorbed onto the oxide film surface. Then the oxygen ions move in the oxide film through oxygen vacancies of the oxide film and finally reach the oxide/metal interface. When they reach the oxide/metal interface, they react with zirconium cations to form new oxide. Meanwhile, electrons in the metal matrix move from the metal surface toward the oxide film, and finally, they were taken away by an oxidizing agent in the environment. The control mechanism of the corrosion rate is the movement velocity of oxygen, oxygen vacancies, and electrons. Therefore, the oxygen vacancy amount is one of the key factors that affect the corrosion rate of Zr alloys. In the ZrO2 oxide film, the chemical valences of oxygen ion, oxygen vacancy, and Zr are -2, +2, and +4, respectively. As interstitial cations in the environment move into the ZrO2 film, oxygen vacancy amount will decrease to maintain electric neutrality (Krausová et al., 2015; Wei et al., 2020a). However, when substantial cations whose chemical valence is lower than +4 or anions whose chemical valence is higher than -2 (-3, -4, etc.) move into the ZrO2 oxide film, oxygen vacancies amount will increase. N3- can easily substitute O2- in the ZrO2 film as their radiuses are very close (N3- 146p m and O2- is 132p m); therefore, the corrosion rate of Zr will increase when N3- moves into the ZrO2 oxide film.
The corrosion process of the Zr alloy briefly contains the following reactions:
1. The Zr atoms in the Zr alloy matrix lose electrons and become Zr cations at the oxide/metal interface. The electrons move toward the oxide/solution interface, that is, Zr→Zr4++4e−.
2. The Zr cations react with free oxygen to form ZrO2 oxides at the oxide/metal interface which leads to oxide front advance into metal. In the meantime, oxygen vacancies form, that is, Zr4++2O→ZrO2+2Vo2+(Vo oxygen vacancy).
3. The oxygen vacancies move to the oxide/solution interface and capture oxygen ions in the environment, and then oxygen atoms move toward the oxide/metal interface, that is, Vo2++O2-→O.
4. A total of four protons at the oxide/solution interface get electrons in the oxides and are reduced into hydrogen, that is 2H++2e−→H2.
It must be mentioned that the reactions above only generalize a simplified corrosion process. The actual corrosion process that may contain other reactions is more complicated.
The mechanism of NH3 accelerating the corrosion rate of the Zr alloy is shown in Figure 9. In an environment without NH3, the schematic of the ZrO2 lattice which contains Zr4+, O2-, and oxygen vacancies is shown in Figure 9A. The number ratio of Zr4+ to O2- is 1:2 in a perfect ZrO2. Considering the existence of a few O vacancies, the number ratio will be a little lower than 1:2. When NH4OH is present in the environment, N3- can easily occupy O vacancy in the ZrO2 lattice by the third reaction mentioned above. As N3- has one more negative charge than O2-, one oxygen vacancy will form to maintain electrical neutrality when two N3- get into the ZrO2 lattice, as shown in Figure 9B. Therefore, the more N3- gets into the ZrO2 lattice, the more O2- vacancies form, and the corrosion rate increases.
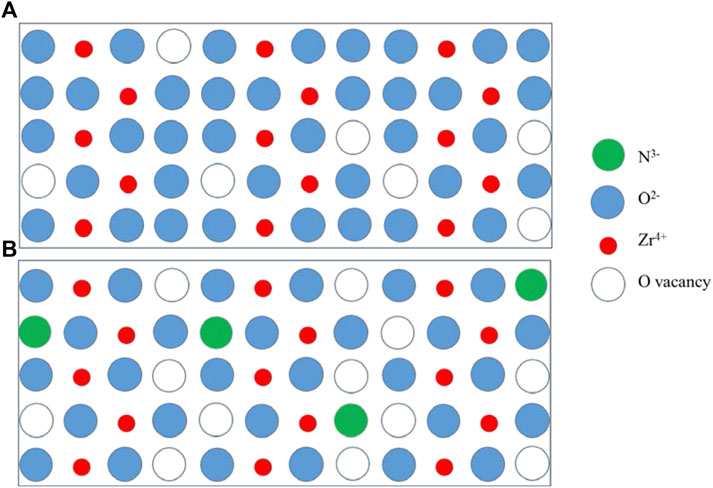
FIGURE 9. Schematic of mechanism of the NH3 accelerating corrosion rate of the Zr alloy. (A) in the environment without NH3 (B) in the environment with NH3.
One interesting result is that boron and lithium were also found in the oxide film on specimens tested in the B–Li solution as shown in Figure 8. According to the discussion above, the presence of Li+ and B3+ in the ZrO2 film will also increase the corrosion rate if they act as substantial ions. Actually high concentration of Li+ will significantly increase the corrosion rate of the Zr alloy as the ion radiuses of Li+ and Zr4+ are very close (Li+ is 76p m and Zr4+ is 72p m) (Cox and Wu, 1995; Wei et al., 2020b). It was found that lithium will segregate at grain boundaries of ZrO2 (Xie et al., 2020). However, lithium concentration in B–Li solution in this study is only 2.9 × 10⁻⁴ mol/L (2ppm), which is too low to result in acceleration of corrosion. For boron, maybe it is too difficult to substitute Zr4+ as its ion radius is only 23p m. In Figure 8A, it is found that the boron concentration is very low to cause an effect.
Conclusion
The corrosion behaviors of a Chinese domestic Zr–Sn–Nb alloy in ammonia solution and boron–lithium solution at 360 °C, 18.6 MPa are studied in this work. The weight gains, oxide morphologies, crystalline structures of oxide, hydrogen absorptions, hydride morphologies, and element distributions of oxide are compared. The conclusions are as follows:
1. There is no difference in microstructures and crystalline structures between oxide films formed in 6.7 × 10⁻³ mol/L ammonia solution and 2.9 × 10⁻⁴ mol/L LiOH+9.3 × 10⁻² mol/L H3BO3 solution after exposure for 300 days at 360°C, 18.6 MPa. The microstructures of both oxides consist of an equiaxed crystal layer with a thickness of 300–500 nm and a columnar crystal layer beneath it. The crystalline structures of both oxides consist of most monoclinic-ZrO2 and a few tetragonal-ZrO2.
2. The corrosion behavior of the Zr–Sn–Nb alloy in 360 °C aqueous solution shows no difference with other Zr alloys.
3. Based on the results of weight gains, oxide thickness, and hydrogen absorptions, the presence of ammonia will not significantly change the corrosion rate of the Zr–Sn–Nb alloy, but only cause a little bit increase in the corrosion rate. During pre-transition, the weight gain of the Zr–Sn–Nb alloy in the B–Li solution is only about 2 mg/dm2 than that in the NH4OH solution. During post-transition, the weight gain in the B–Li solution is about 8 mg/dm2 than that in the NH4OH solution.
4. Nitrogen in ammonia can move into ZrO2 oxide and segregate at local areas in a range of about 2 μm from the oxide/metal interface, which may be the reason for the acceleration of the corrosion rate.
Data Availability Statement
The datasets presented in this article are not readily available because they are currently under embargo, while the research findings are commercialized. Requests for data 12 months after publication of this article will be considered by the corresponding author. Requests to access the datasets should be directed to Chen Zirui, cmF5bWl4QGFsaXl1bi5jb20=.
Author Contributions
ZC: ideas, synthesize study data, original draft, and visualization/data presentation. YZ: oversight and leadership responsibility for the research activity planning and execution. MT, ZY, and ZW: provision of study materials and reagents. BG: review and editing the original draft.
Conflict of Interest
The authors declare that the research was conducted in the absence of any commercial or financial relationships that could be construed as a potential conflict of interest.
Publisher’s Note
All claims expressed in this article are solely those of the authors and do not necessarily represent those of their affiliated organizations, or those of the publisher, the editors and the reviewers. Any product that may be evaluated in this article, or claim that may be made by its manufacturer, is not guaranteed or endorsed by the publisher.
References
Balakrishnan, G., Sastikumar, D., Kuppusami, P., Babu, R. V., and Song, J. I. (2018). Microstructural and Mechanical Properties of Al2O3/ZrO2 Nanomultilayer Thin Films Prepared by Pulsed Laser Deposition. Appl. Phys. A 124, 158–165. doi:10.1007/s00339-018-1576-7
Cox, B. (2005). Some Thoughts on the Mechanisms of In-Reactor Corrosion of Zirconium Alloys[J]. J. Nucl. Mater. 336 (2-3), 331–368. doi:10.1016/j.jnucmat.2004.09.029
Cox, B., and Wu, C. (1995). Transient Effects of Lithium Hydroxide and Boric Acid on Zircaloy Corrosion. J. Nucl. Mater. 224, 169–178. doi:10.1016/0022-3115(95)00043-7
Dong, Y., Motta, A. T., and Marquis, E. A. (2013). Atom Probe Tomography Study of Alloying Element Distributions in Zr Alloys and Their Oxides. J. Nucl. Mater. 442, 270–281. doi:10.1016/j.jnucmat.2013.08.055
Duan, Z., Yang, H., Satoh, Y., Murakami, K., Kano, S., Zhao, Z., et al. (2017). Current Status of Materials Development of Nuclear Fuel Cladding Tubes for Light Water Reactors. Nucl. Eng. Des. 316, 131–150. doi:10.1016/j.nucengdes.2017.02.031
Garzarolli, F., Beck, W., and Fuchs, H. P. (1993). Recent Occurrences of Abnormal Increased Fuel Rod Corrosion in PWRs: Pro. Washington DC., USA: EPRI-PWR fuel rod corrosion workshop.
Garzarolli, F., Seidel, H., and Tricot, R. (1991). “Oxide Growth Mechanism on Zirconium Alloys,” in Proceedings of 9th International Symposium on zirconium in the nuclear industry, Kobe, Japan, November 5–8, 1990. (ASTM STP).
Gravie, R. C., and Nicholson, P. S. (1972). Phase Anlysis in Zirconia Systems[J]. J. Am. Ceram. Soc. 55 (6), 303–305. doi:10.1111/j.1151-2916.1972.tb11290.x
Gravie, R. C., and Nicholson, P. S. (2006). Structure and Thermomechanical Properties of Partially Stabilized Zirconia in CaO-ZrO2 System[M]. J. Am. Ceram. Soc. 55, 259–273. doi:10.1111/j.1151-2916.1972.tb11241.x
Han, J. H., and Rheem, K. S. (1994). The Corrosion Characteristics of Zircaloy-4 Fuel Cladding in LiOH-H3bo3 Solutions. J. Nucl. Mater. 217, 197–199. doi:10.1016/0022-3115(94)90321-2
Kim, T.-K., Choi, B.-S., Jeong, Y.-H., Lee, D.-J., and Chang, M.-H. (2002). Effects of Annealing on Tensile Property and Corrosion Behavior of Ti-Al-Zr Alloy. J. Nucl. Mater. 301, 81–89. doi:10.1016/s0022-3115(02)00710-9
Kim, T. K., Baek, J. H., Choi, B. K., and Jeong, Y. H. (2007). Influence of Ammonia on the Corrosion Behavior of Ti−Al−Zr Alloy in 360°C Water. Mater. Mat. Int. 13 (1), 47–52. doi:10.1007/bf03027822
Krausová, A., Macák, J., and Sajdl, P. (2015). In-situ Electrochemical Study of Zr1Nb Alloy Corrosion in High Temperature Li+ Containing Water[J]. J. Nucl. Mater. 467, 302–310. doi:10.1016/j.jnucmat.2015.10.005
Kritskii, V. G., Berezina, I. G., and Motkova, E. A. (2013). Simulating the Corrosion of Zirconium Alloys in the Water Coolant of VVER Reactors. Therm. Eng. 60, 457–464. doi:10.1134/s0040601513070057
Kysela, J., Zmítko, M., Yurmanov, V. A., and Tiapkov, V. F. (1996). Primary Coolant Chemistry in VVER Units. Nucl. Eng. Des. 160, 185–192. doi:10.1016/0029-5493(95)01096-3
Lai, P., Lu, J., Zhang, H., Liu, Q., Zeng, Q., Guo, X., et al. (2020). The Corrosion Behavior of M5 (Zr-1Nb-0.12O) Alloy in 360 °C Water with Dissolved Oxygen. J. Nucl. Mater. 532, 152079. doi:10.1016/j.jnucmat.2020.152079
Liu, J., Yu, H., Karamched, P., Hu, J., He, G., Goran, D., et al. (2019). Mechanism of the α-Zr to Hexagonal-ZrO Transformation and its Impact on the Corrosion Performance of Nuclear Zr Alloys. Acta Mater. 179, 328–341. doi:10.1016/j.actamat.2019.08.051
Lustman, B., and Kerze, F. (1955). The Metallurgy of zirconium[M]. New York, USA: McGraw-Hill book company inc.
Macdonald, D. D. (2012). Some Personal Adventures in Passivity-A Review of the Point Defect Model for Film Growth. Russ. J. Electrochem 48 (3), 235–258. doi:10.1134/s1023193512030068
Malinovschi, V., Martin, A., and Negrea, V. (2017). Tetragonal ZrO2 Phase Stabilization in Coating Layers Prepared on Zr-2.5%Nb Alloy during Plasma Electrolytic Oxidation in Sodium Aluminate Electrolytes[J]. Mater. Res. express 4, 95702. doi:10.1088/2053-1591/aa87c9
Motta, A. T., Couet, A., and Comstock, R. J. (2015). Corrosion of Zirconium Alloys Used for Nuclear Fuel Cladding. Annu. Rev. Mat. Res. 45, 311–343. doi:10.1146/annurev-matsci-070214-020951
Ni, N., Hudson, D., Wei, J., Wang, P., Lozano-Perez, S., Smith, G. D. W., et al. (2012). How the Crystallography and Nanoscale Chemistry of the Metal/oxide Interface Develops during the Aqueous Oxidation of Zirconium Cladding Alloys. Acta Mater. 60, 7132–7149. doi:10.1016/j.actamat.2012.09.021
Polatidis, E., Frankel, P., Wei, J., Klaus, M., Comstock, R. J., Ambard, A., et al. (2013). Residual Stresses and Tetragonal Phase Fraction Characterisation of Corrosion Tested Zircaloy-4 Using Energy Dispersive Synchrotron X-Ray Diffraction. J. Nucl. Mater. 432, 102–112. doi:10.1016/j.jnucmat.2012.07.025
Wei, K. J., Wang, X. P., Zhu, M. H., Chi, X. U., Xue, W., Zhang, J., et al. (2020). Effects of Li, B and H Elements on Corrosion Property of Oxide Films on ZIRLO Alloy in 300 null/14MPa Lithium Borate Buffer Solutions[J]. Corros. Sci. 107, 2411–2502. doi:10.1021/acsami.1c06204
Wei, K., Wang, X., and Li, J. (2020). In-situ Electrochemical Study of Plasma Electrolytic Oxidation Treated Zr3Al Based Alloy in 300°C/14 MPa Lithium Borate Buffer Solution[J]. Thin solid films 707, 138006. doi:10.1016/j.tsf.2020.138066
Xie, S., Zhou, B., Liang, X., Li, Q., Liu, W., Yao, M., et al. (2020). The Distribution of Li Ions in the Oxide Film Formed on Zircaloy-4 Corroded in Lithiated Water at 633 K. Materials 13 (4), 873–880. doi:10.3390/ma13040873
Keywords: Zr–Sn–Nb alloy, corrosion rate, ammonia, corrosion behavior, oxide film
Citation: Chen Z, Zhao Y, Tang M, Yin Z, Gong B and Wu Z (2022) Influence of Ammonia on the Corrosion Behavior of a Zr–Sn–Nb Alloy in High Temperature Water. Front. Mater. 9:910186. doi: 10.3389/fmats.2022.910186
Received: 01 April 2022; Accepted: 27 April 2022;
Published: 02 June 2022.
Edited by:
Long Xin, University of Science and Technology Beijing, ChinaCopyright © 2022 Chen, Zhao, Tang, Yin, Gong and Wu. This is an open-access article distributed under the terms of the Creative Commons Attribution License (CC BY). The use, distribution or reproduction in other forums is permitted, provided the original author(s) and the copyright owner(s) are credited and that the original publication in this journal is cited, in accordance with accepted academic practice. No use, distribution or reproduction is permitted which does not comply with these terms.
*Correspondence: Zirui Chen, cmF5bWl4QGFsaXl1bi5jb20=