 Yu-Lin Shen
94% of researchers rate our articles as excellent or good
Learn more about the work of our research integrity team to safeguard the quality of each article we publish.
Find out more
PERSPECTIVE article
Front. Mater., 28 April 2022
Sec. Thin Solid Films
Volume 9 - 2022 | https://doi.org/10.3389/fmats.2022.900088
This article is part of the Research Topic2022 Retrospective: Thin Solid FilmsView all 5 articles
Nanoindentation measurements frequently involve a hold period at the peak load to allow the material to reach a stabilized state. A dwell time is also commonly employed at a sufficiently low load after unloading, to quantify the thermal drift for correction of the raw load-displacement data. This communication presents numerical case studies of indentation loading on a viscoelastic thin film using the finite element method. We illustrate that a simple viscoelastic material can actually induce prominent drift even under a low indentation load. The drift is caused by the material itself, unrelated to the thermal drift of the instrument. The direction and magnitude of the viscoelastic drift are controlled by the prior loading/unloading history as well as the load-displacement response of the fully relaxed elastic state.
Instrumented nanoindentation has been widely used to probe mechanical properties of materials, especially for specimens with small dimensions such as thin films. The indentation load-displacement (penetration depth) data contains rich information about the materials behavior in response to mechanical stimulation. Techniques have been developed to extract quasi-static and time-dependent mechanical properties for various classes of materials (Doerner and Nix, 1986; Oliver and Pharr, 1992, 2004; Hay and Pharr, 2000; Fisher-Cripps, 2002; Gouldstone et al., 2007; Lawn and Cook, 2012; Shen, 2019). Various analytical studies on indentation behavior of viscoelastic materials have also been reported (Vandamme and Ulm, 2006; Jager et al., 2007; Argatov et al., 2013). A typical indentation load-displacement response is shown in Figure 1C as Case I (other details of Figure 1 will be discussed later in this communication). There is a horizontal segment at the peak load between the loading and unloading phases. This hold (dwell) period is commonly included in a load-controlled indentation measurement, since many materials display some time-dependency under high concentrated loads, and thus a dwell time at the peak load would allow the indenter to settle deeper as the material is reaching a stabilized state.
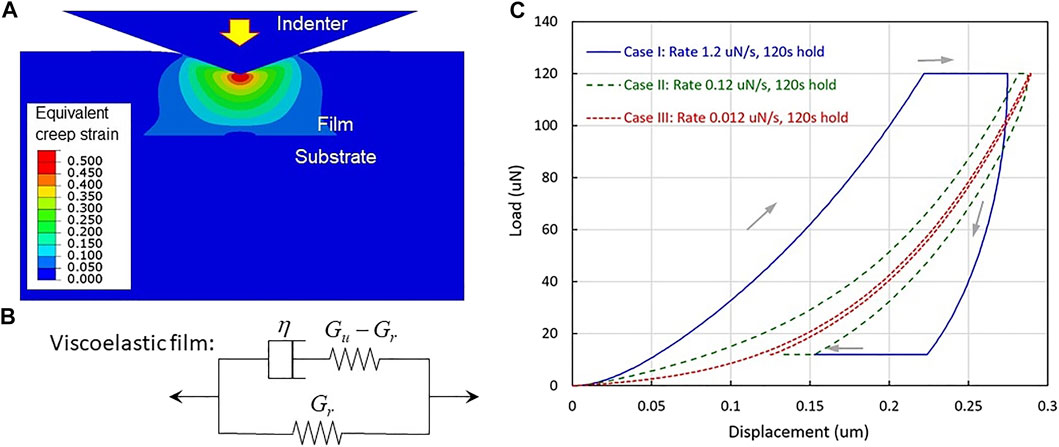
FIGURE 1. (A) Model configuration near the indentation site, and the contours of equivalent creep strain in the viscoelastic thin film during indentation (B) The three-element standard linear solid model used for the viscoelastic film (C) Simulated indentation load-displacement curves for Cases I, II and III. The finite element software ABAQUS (Version 2017; Dassault Systems Simulia Corp., Johnston, RI, United States) was used for the modeling.
During indentation testing a change in dimensions of the instrument may occur due to thermal expansion/contraction caused by environmental temperature fluctuations (Fisher-Cripps, 2002; Verma et al., 2021). This “thermal drift” phenomenon inevitably adds to the measured indentation displacement which needs to be corrected. A common practice thus calls for including a period near the end of unloading during which the load is held constant while the displacement is monitored. The load level is supposedly low enough to minimize possible creep deformation caused by the material itself. If, for example, the drift is toward increasing depth, then the raw load-displacement curve needs to be adjusted toward smaller depth following the measured thermal drift rate. While it is recognized that time-dependent material response itself can contribute to the drift (Fisher-Cripps, 2002), in this communication we illustrate, from a numerical modeling perspective, that a simple viscoelastic behavior can actually induce a large drift even under a low load. The combination of loading/unloading rate and the true relaxed material state will dictate the drift behavior.
The axisymmetric finite element model features a 1 μm-thick viscoelastic thin film bonded to a 200 μm-thick silicon substrate, along with a conical diamond indenter. Figure 1A shows the film being indented and the evolving equivalent creep strain contours. The semi-angle of the conical indenter is 70.3°, which results in the same contact area as the Berkovich indenter in typical nanoindentation experiments. The substrate and indenter materials are assumed to be linearly elastic, with the substrate Young’s modulus and Poisson’s ratio being 130 GPa and 0.28, respectively, and the indenter Young’s modulus and Poisson’s ratio being 1,141 GPa and 0.07, respectively. The thin film is taken as viscoelastic following a simple three-element standard linear solid model shown schematically in Figure 1B. The symbols η, Gu and Gr stand for the dashpot viscosity, unrelaxed (instantaneous) shear modulus and fully relaxed shear modulus, respectively. Their values are taken as
where t is time and
We now consider three different load-controlled indentation histories implemented through the finite element analysis, with the simulated load-displacement curves shown in Figure 1C.
Case I: Loading at 1.2 μN/s rate → 120 s hold period under constant peak load 120 μN → unloading at 1.2 μN/s rate → 120 s hold period under constant load 12 μN
Case II: Loading at 0.12 μN/s rate → 120 s hold period under constant peak load 120 μN → unloading at 0.12 μN/s rate → 120 s hold period under constant load 12 μN
Case III: Loading at 0.012 μN/s rate → 120 s hold period under constant peak load 120 μN → unloading at 0.012 μN/s rate → 120 s hold period under constant load 12 μN
The three cases have significantly different loading/unloading rates but the same constant-load hold history at the peak and final loads. It can be observed from Case I in Figure 1C that viscoelastic creep at the peak load 120 μN results in further penetration of the indenter. At the final low load of 12 μN, however, a significant drift backward occurs (pushing the indenter back up). The extent of drift is even greater compared to the peak load, and this is entirely due to the constitutive material behavior used in the numerical model. If an actual material being tested has the same viscoelastic properties, one can expect a large interference with the instrument’s thermal drift by the material itself.
If the loading/unloading rate is decreased by an order of magnitude, Case II in Figure 1C, the material experiences greater relaxation during deformation and thus becomes more compliant. A greater indentation depth is obtained upon reaching the same peak load of 120 μN. A same 120 s dwell time results in only a limited further displacement, as the material is now already close to a fully relaxed state. Upon unloading to 12 μN, the constant-load drift toward a smaller displacement is also much lessened. Case III shows the response when the loading/unloading rate is further reduced by another order of magnitude. The horizonal segments at both the 120 and 12 μN are almost nonexistent; the loading and unloading curves almost coincide, signifying a nearly fully relaxed elastic state even during loading and unloading. It is evident by comparing the three cases that, during the hold periods at the peak load and at the final load in Cases I and II, the deformation is simply drifting toward the fully relaxed state (Case III). The farther the starting dwell point from the relaxed load-displacement curve, the greater the drift movement during the 120 s hold period.
Attention is now turned to two other loading scenarios:
Case IV: Loading at 1.2 μN/s rate → 12,000 s hold period under constant peak load 120 μN → unloading at 1.2 μN/s rate → 12,000 s hold period under constant load 12 μN
Case V: Loading at 120 μN/s rate → no hold period at peak load 120 μN → unloading at 120 μN/s rate → 120 s hold period under constant load 12 μN
The simulated load-displacement curves are shown in Figure 2A. Case III is also included as a reference response for the relaxed state. The difference between Case IV and the previous Case I is that the dwell time is 100 times longer in Case IV. It is evident from Figure 2A that the 12,000 s hold at the peak load is sufficiently long to reach the fully relaxed condition. Upon unloading, the displacement for Case IV is to the right of Case III, and the 12,000 s dwell time under the final load of 12 μN allows a long drift back to the fully relaxed Case III curve again. Case V features a very fast loading and unloading without any dwell time at the peak load. The loading and unloading paths are close to one another since the material is generally in the instantaneous (unrelaxed) elastic state. Upon unloading to 12 μN, the displacement is to the left of the reference Case III. The final dwell therefore moves toward a greater depth, and, after 120 s, the displacement has nearly reached the relaxed state. Figure 2A demonstrates that the viscoelastic drift is not limited to only one direction; the drift behavior depends on prior history and where the drift starting point is relative to the fully relaxed state.
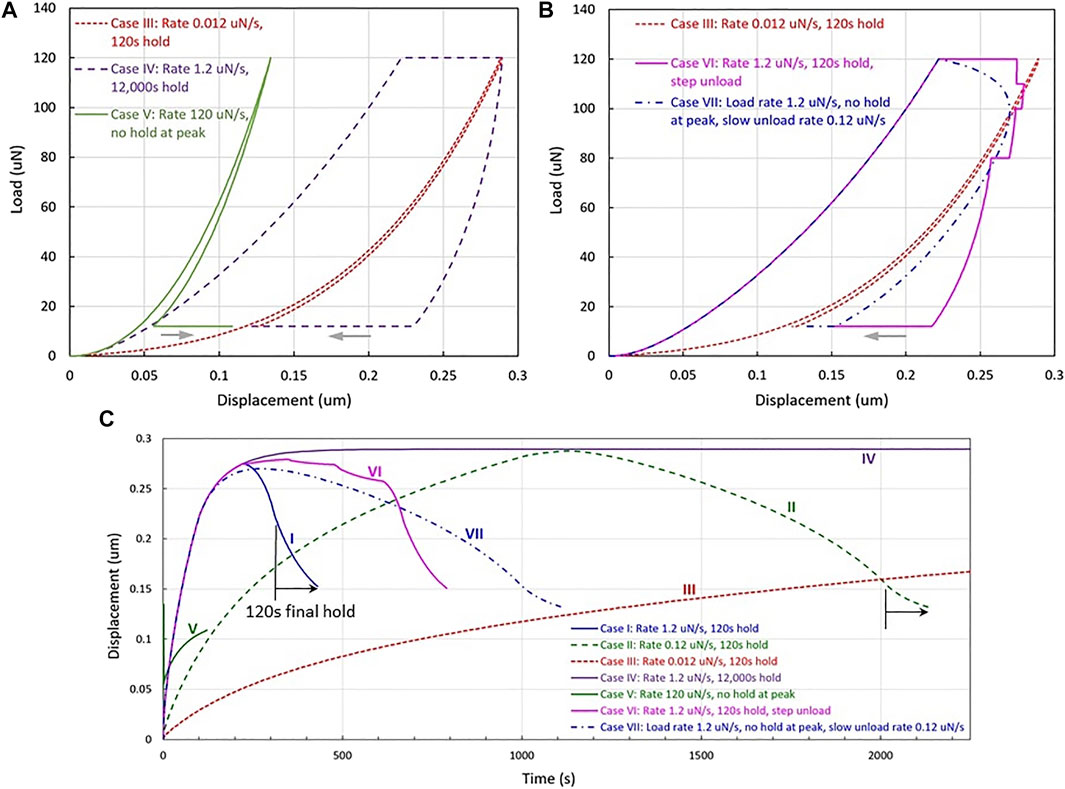
FIGURE 2. Simulated indentation load-displacement curves for (A) Cases III, IV and V, and (B) Cases III, VI and VII. Case III are included in both plots as a reference response (fully relaxed) (C) Simulated indentation displacement-time histories for all cases I through VII. The last 120 s of constant-load hold periods for Cases I and II are highlighted for reference.
Two additional loading histories are now considered:
Case VI: Loading at 1.2 μN/s rate → 120 s hold period under constant peak load 120 μN → stepwise unloading at 1.2 μN/s rate (interrupted by 120 s hold periods at loads 110 μN, 100 μN, 80 μN, and 12 μN)
Case VII: Loading at 1.2 μN/s rate → no hold period at peak load 120 μN → slow unloading at 0.12 μN/s rate → 120 s hold period under constant load 12 μN
Case VI is based on the previous Case I but with certain dwell periods added to the unloading phase. Case VII skips the hold period at the peak load and the imposed unloading rate is one order of magnitude slower. The simulated load-displacement curves are shown in Figure 2B, along with the reference response of Case III. The stepwise unloading in Case VI leads to interesting response–at higher constant loads the drift is toward a greater depth and at lower loads the drift is toward a smaller depth. Again, the direction of drift is a consequence of each starting position relative to the fully relaxed state. If the displacement is farther away from Case III, then the amount of drift is greater after the same period of 120 s. For Case VII, unloading commences immediately once the peak load of 120 μN is reached. The very slow unloading renders an increase in depth as the load is being reduced, since the material has the tendency toward the reference state. The unloading process overshoots the Case III curve, and at the final load it drifts back to near the reference state after 120 s.
The indentation curves in Figures 1C, 2A,B are presented in the typical load-displacement form. The time variations of displacement during the load-controlled indentation histories are shown in Figure 2C for Cases I through VII. Since the overall time span differs by more than two orders of magnitude for different cases, the figure includes a time scale up to about 2000 s for the purpose of displaying salient features. In particular, the hold period of 120 s at the final low load is labeled by the curves of Cases I and II as a reference. It can be seen that the final hold period results in significant displacement changes as were also demonstrated in the load-displacement curves. The rate of displacement change decreases as the hold time increases.
The numerical case studies presented above illustrated that a simple viscoelastic material can exhibit prominent drift even under a low indentation load, unrelated to the instrument-induced thermal drift. Depending on the deformation history and the exact relaxation state, the drift displacement can be toward either deeper or shallower indentations. It is worth noting that the current analysis only considers the three-element standard linear solid model with a relatively low viscosity. An actual material may follow a more complicated form of viscoelasticity in conjunction with viscoplasticity, leading to time-dependent permanent deformation and therefore different kinds of drift behavior. Nevertheless, this communication serves to raise awareness about the potential complexity of the drift response dictated by the material itself. Care must be taken when interpreting nanoindentation measurement results if one does not have sufficient knowledge about the specimen’s constitutive behavior.
The original contributions presented in the study are included in the article; further inquiries can be directed to the corresponding author.
The author confirms being the sole contributor of this work and has approved it for publication.
This work is partially sponsored by Air Force Research Laboratory, United States.
The author declares that the research was conducted in the absence of any commercial or financial relationships that could be construed as a potential conflict of interest.
All claims expressed in this article are solely those of the authors and do not necessarily represent those of their affiliated organizations, or those of the publisher, the editors and the reviewers. Any product that may be evaluated in this article, or claim that may be made by its manufacturer, is not guaranteed or endorsed by the publisher.
The author also acknowledges the endowment support from the PNM Resources Foundation, as the PNM Chair for Renewable Energy Research.
Argatov, I., Daniels, A. U., Mishuris, G., Ronken, S., and Wirz, D. (2013). Accounting for the Thickness Effect in Dynamic Spherical Indentation of a Viscoelastic Layer: Application to Non-destructive Testing of Articular Cartilage. Eur. J. Mech. - A/Solids 37, 304–317. doi:10.1016/j.euromechsol.2012.07.004
Doerner, M. F., and Nix, W. D. (1986). A Method for Interpreting the Data from Depth-Sensing Indentation Instruments. J. Mater. Res. 1, 601–609. doi:10.1557/JMR.1986.0601
Gouldstone, A., Chollacoop, N., Dao, M., Li, J., Minor, A., and Shen, Y.-L. (2007). Indentation across Size Scales and Disciplines: Recent Developments in Experimentation and Modeling. Acta Materialia 55, 4015–4039. doi:10.1016/j.actamat.2006.08.044
Hay, J. L., and Pharr, G. M. (2000). “Instrumented Indentation Testing,” in ASM Handbook, Volume 8: Mechanical Testing and Evaluation. Editors H. Kuhn, and D. Medlin (Materials Park, OH: ASM International).
Jäger, A., Lackner, R., and Eberhardsteiner, J. (2007). Identification of Viscoelastic Properties by Means of Nanoindentation Taking the Real Tip Geometry into Account. Meccanica 42, 293–306. doi:10.1007/s11012-006-9041-7
Lawn, B. R., and Cook, R. F. (2012). Probing Material Properties with Sharp Indenters: a Retrospective. J. Mater. Sci. 47, 1–22. doi:10.1007/s10853-011-5865-1
Oliver, W. C., and Pharr, G. M. (1992). An Improved Technique for Determining Hardness and Elastic Modulus Using Load and Displacement Sensing Indentation Experiments. J. Mater. Res. 7, 1564–1583. doi:10.1557/JMR.1992.1564
Oliver, W. C., and Pharr, G. M. (2004). Measurement of Hardness and Elastic Modulus by Instrumented Indentation: Advances in Understanding and Refinements to Methodology. J. Mater. Res. 19, 3–20. doi:10.1557/jmr.2004.19.1.3
Shen, Y.-L. (2019). “Nanoindentation for Testing Material Properties,” in Handbook of Mechanics of Materials. Editors C. H. Hsueh, S. Schmauder, C.-S. Chen, K. K. Chawla, N. Chawla, and W. Chen (Singapore: Springer), 1981–2012. doi:10.1007/978-981-10-6884-3_46
Vandamme, M., and Ulm, F.-J. (2006). Viscoelastic Solutions for Conical Indentation. Int. J. Sol. Structures 43, 3142–3165. doi:10.1016/j.ijsolstr.2005.05.043
Keywords: nanoindentation, viscoelasticity, thermal drift, modeling, deformation
Citation: Shen Y-L (2022) On the Viscoelastic Drift Behavior During Nanoindentation. Front. Mater. 9:900088. doi: 10.3389/fmats.2022.900088
Received: 19 March 2022; Accepted: 05 April 2022;
Published: 28 April 2022.
Edited by:
Jinn P. Chu, National Taiwan University of Science and Technology, TaiwanReviewed by:
Ivan Argatov, Technical University of Berlin, GermanyCopyright © 2022 Shen. This is an open-access article distributed under the terms of the Creative Commons Attribution License (CC BY). The use, distribution or reproduction in other forums is permitted, provided the original author(s) and the copyright owner(s) are credited and that the original publication in this journal is cited, in accordance with accepted academic practice. No use, distribution or reproduction is permitted which does not comply with these terms.
*Correspondence: Yu-Lin Shen, c2hlbnlsQHVubS5lZHU=
Disclaimer: All claims expressed in this article are solely those of the authors and do not necessarily represent those of their affiliated organizations, or those of the publisher, the editors and the reviewers. Any product that may be evaluated in this article or claim that may be made by its manufacturer is not guaranteed or endorsed by the publisher.
Research integrity at Frontiers
Learn more about the work of our research integrity team to safeguard the quality of each article we publish.