 Xiaoyu Zhang
 Yang Liu2
 Caglar Oskay
- 1Department of Civil and Environmental Engineering Department of Mechanical Engineering Vanderbilt University Nashville, Nashville, TN, United States
- 2Department of Materials Imperial College London, London, United Kingdom
Microstructure of polycrystalline materials has profound effects on fatigue crack initiation, and the inherent randomness in the material microstructure results in significant variability in fatigue life. This study investigates the effect of microstructural features on fatigue nucleation life of a polycrystalline material using an uncertainty quantification framework. Statistical volume elements (SVE) are constructed, where features are described as probability distributions and sampled using the Monte Carlo method. The concept of SVE serves as the tool for capturing the variability of microstructural features and consequent uncertainty in fatigue behavior. The response of each SVE under fatigue loading is predicted by the sparse dislocation density informed eigenstrain based reduced order homogenization model with high computational efficiency, and is further linked to the fatigue nucleation life through a fatigue indicator parameter (FIP). The aggregated FIP and its evolution are captured using a probabilistic description, and evolve as a function of time. The probability of fatigue nucleation is measured as the probability that the predicted FIP exceeds the local critical value which represents the ability of material to resist the fatigue load. The proposed framework is implemented and validated using the fatigue response of titanium alloy, Ti-6Al-2Sn-4Zr-2Mo (Ti-6242).
1 Introduction
Quantitative evaluation of fatigue failure is an important factor for material and structural design of aircraft components that bear cyclic loads. Fatigue failure process consists of micro-crack nucleation and short microstructure-sensitive crack growth (collectively referred to as fatigue initiation), long crack growth and final rupture. Experimental observations show that high cycle fatigue failure of polycrystalline materials could be dominated (up to 80–90% of life (Larsen et al., 2013)) by crack initiation which, in turn, is significantly influenced by material microstructural features. The microstructures exhibit significantly varying features depending on processing conditions, and this inherent randomness results in significant uncertainty in fatigue life (Lütjering, 1998; Bandyopadhyay et al., 2019; Waheed et al., 2019; Kotha et al., 2020). In the current study, we propose an uncertainty quantification framework to quantify the effect of microstructure on fatigue nucleation life from a probabilistic point of view.
Fatigue failure of polycrystalline materials is shown to be significantly affected by material microstructure in both experimental and modeling investigations (Dunne et al., 2007; McDowell and Dunne, 2010; Castelluccio et al., 2014). A large body of experimental work established aspects of the relationships between the fatigue crack formation and microstructural attributes (e.g., grain size (Miao et al., 2012), crystallographic orientation (Miao et al., 2012), grain interactions (Tschopp et al., 2009; Abuzaid et al., 2013), inclusion-matrix interaction (Jiang et al., 2015), twin boundaries (Carroll et al., 2013), surface topology/roughness (Ho et al., 2011), etc (Maruschak et al., 2020)) using imaging and characterization techniques such as electron backscatter diffraction, scanning electron microscopy, digital image correlation and others. The influence of microstructure attributes on the fatigue response of the polycrystalline materials has also been investigated numerically using the crystal plasticity finite element (CPFE) method (McDowell and Dunne, 2010; Castelluccio and McDowell, 2015; Wang et al., 2015; Castelluccio and McDowell, 2016; Yeratapally et al., 2016; Phan et al., 2017; Cruzado et al., 2018; Wilson and Dunne, 2019). For instance the influence of macrozones or microtextured regions results in significant lifetime reduction under dwell fatigue, which are widely observed in α and α + β titanium alloy. The macrozone in Ti-6Al-4V, which has aspect ratio larger than 4 and basal poles within 15° of remote loading direction, leads to much higher stress redistribution (Liu et al., 2020). Microstructural heterogeneity within neighboring α/β phases with specific orientation relationship plays a significant role in higher local creep resistance in basketweave structure compared to colony or Widmanstatten structure in α + β titanium alloys (Waheed et al., 2019; Zhang and Oskay, 2019).
Several sources of uncertainty contribute to the variability in fatigue initiation and consequently total fatigue lifetimes. These include the morphological features in the material microstructure (Kotha et al., 2020), residual stress (Hrabe et al., 2017), experimental conditions associated with the loading, boundary conditions and testing environment (Biallas et al., 2005), measurement techniques, among others. Probabilistic prediction of fatigue initiation based on computational modeling and simulation includes additional sources of uncertainty including digitized representation of microstructure, model parameters, model form, and the fatigue indicator parameter (FIP) used to assess initiation.
A number of recent studies focused on incorporation of statistics and uncertainty into computational fatigue initiation prediction in polycrystalline materials. About a decade earlier, McDowell and coworkers proposed a microstructure analysis based probabilistic prediction paradigm that forms the foundation for several studies (Owolabi et al., 2010; Przybyla and McDowell, 2010; Przybyla and McDowell, 2011; Bandyopadhyay et al., 2019). The primary means to quantifying uncertainty is the aggregation of spatial distributions of FIPs obtained from a collection of CPFE simulations on Statistical Volume Elements (SVEs). Compared with the representative volume element (RVE), SVE concept allows statistical variability of the response from one realization to another since the size of an SVE is taken to be much smaller than an RVE. Considering an ergodic process, the ensemble response of SVEs captures the RVE response. The FIP computations are often performed as a post-processing step, where volume averaged FIPs over grains (Castelluccio and McDowell, 2015; Liu et al., 2020) or sub-grain domains (Gu et al., 2020) provide the statistical data. Przybyla and McDowell (Przybyla and McDowell, 2010; Przybyla and McDowell, 2011) connected microstructure attributes with certain extreme value fatigue response parameters to study the driving force of fatigue nucleation in Ni-based superalloy IN100 (Przybyla and McDowell, 2010) and Ti-6Al-4V microstructures (Przybyla and McDowell, 2011). An important complicating factor in this regard is the very high computational cost of performing simulations over a sufficiently large SVE ensemble, that may be on the order of thousands or more (Whelan and McDowell, 2019). This cost could be reduced by replacing CPFE simulations with microstructurally-informed homogenized constitutive models (Kotha et al., 2020; Ozturk et al., 2021), reduced-order microstructure models (Zhang and Oskay, 2015; Zhang and Oskay, 2017), or machine learning models (Bock et al., 2019; Whelan and McDowell, 2020), by establishing scalable and efficient CPFE solvers (Yaghoobi et al., 2021), or by judiciously limiting uncertainty analysis to a subset of geometric features obtained based on sensitivity analysis (Zhang and Oskay, 2018).
In addition to the uncertainty induced by microstructure heterogeneity, numerical discretizations and the constitutive models used to idealize unresolved subscale behavior also introduce uncertainty and error into initiation predictions. Yeratapally et al. (Yeratapally et al., 2017) focused on the effect of model parameter uncertainty on the variability of fatigue initiation predictions. The number of parameters contributing to initiation variability is reduced by global sensitivity analysis (also employed in (Zhang and Oskay, 2018; Zhang and Oskay, 2019)). Local parametric sensitivity analyses also provide information on critical parameters that affect fatigue initiation (Whelan and McDowell, 2020). Anahid and Ghosh (Anahid and Ghosh, 2013) developed a probabilistic crack nucleation model which links time for macroscopic crack nucleation to the macroscopic stress state and microstructural characteristic parameters. Kotha et al. (Kotha et al., 2020) quantified model form uncertainty for a parametrically homogenized constitutive model and took the approach of SVE ensemble simulations to track FIP variability.
The aforementioned investigations (e.g. (Bandyopadhyay et al., 2020; Bandyopadhyay and Sangid, 2021)) have primarily focused on characterization of uncertainty in fatigue initiation parameters and their extreme value distributions since fatigue is expected to initiate at regions of high FIP. We refer to this as “uncertainty in fatigue forces” loosely indicating that uncertainty in the microstructure is propagated to the response fields such as stress, strain, plastic strain, dislocation density or a combination thereof. In this study, borrowing from reliability analysis, we posit the existence of “uncertainty in fatigue resistance” and assess microstructure sensitive fatigue failure using a risk-based approach. Fatigue resistance refers to an inherently stochastic property that quantifies the ability of the material to sustain the aforementioned fatigue forces. By this approach, the probability of fatigue failure is computed using both the uncertainties in microstructural fatigue forces and resistances.
In the current study, we devised an uncertainty quantification framework to elucidate the linkage between microstructure and fatigue nucleation life, and exercised this framework to study fatigue nucleation in titanium alloy, Ti-6Al-2Sn-4Zr-2Mo (Ti-6242). Fatigue nucleation is modeled using the concept of FIP. FIP distribution over an SVE is computed using a dislocation density informed eigenstrain based reduced order homogenization Model (DD-EHM) (Liu et al., 2020) combined with the Sparse EHM formulation (Zhang and Oskay, 2017). DD-EHM is a reduced order microstructure modeling approach that computes microstructure response at a fraction of the cost of a CPFE simulation. The SVEs are generated based on the probabilistic distributions of features, and the responses of these SVEs under cyclic loading are assembled to obtain the FIP distributions as a function of load cycles. The distribution of fatigue strength, i.e. the critical FIP distribution is taken as a material property, which is identified using experimental data. The probability of failure as a function of load cycles is then computed using the calibrated fatigue strength distribution and the predicted FIP distribution. Probability of fatigue nucleation for Ti-6242 are predicted at different stress levels as a validation of the proposed framework.
The remainder of this manuscript is organized as follows: Section 2 describes the proposed uncertainty quantification framework, including the parametric and probabilistic description of material microstructure, multiscale simulations and the probability of fatigue nucleation. Section 3 introduces the microstructure attributes of Ti-6242. Section 4 describes the DD-EHM formulation, the constitutive model employed in the forward simulations of the fatigue response, and the employed FIP. Section 5 discusses the uncertainties of microstructural attributes considered in this study. Detailed investigation and analysis for the relationship between microstructure and fatigue behavior are also presented in this section. Section 6 includes the summary and conclusions.
2 Overview of the Uncertainty Quantification Framework
The uncertainty quantification (UQ) framework used in this study is based on the idea that fatigue damage evolution at the scale of the material microstructure can be characterized by a fatigue indicator parameter, and that the probability of fatigue nucleation in the material microstructure is determined as the probability that the FIP exceeds a critical value after a prescribed number of load cycles. The probability of fatigue nucleation is therefore dictated by two distributions: 1) the spatial distribution of the FIP induced by microstructure heterogeneity under the applied loadings, which evolves as a function of load cycles; and 2) a random variable referred to as the critical FIP that represents the ability of the material to resist fatigue crack initiation at a given material point. Consider that both the FIP and critical FIP are random variables, where the uncertainties are expressed as probability density functions (PDF). We indicate the measure of risk as the probability of fatigue nucleation (PFN). The expression of PFN is given by (Mahadevan and Haldar, 2000):
where FR(ξ) is the cumulative distribution function (CDF) of the critical FIP, fR(r) is the PDF of the critical FIP, and fS(ξ) is the PDF of the FIP. The time dependency of the risk measure stems from the fact that increasing the number of load cycles increase the values of FIP, thereby shifting its evolving PDF as a function of time.
The overall structure of the UQ framework is schematically demonstrated in Figure 1. The SVE concept is employed in the current study to capture the variability in the mechanical response and the FIP as a function of loading. The framework utilizes two types of experimental data: 1) microstructure morphology and material properties; and 2) fatigue nucleation life curves. The statistical microstructure morphology data are used to create a parameterized representation of the microstructural features (e.g., grain orientation and size distributions, phase volume function, etc. measured from EBSD scans and imaging of physical specimens (Tschopp et al., 2009)). The SVEs are generated synthetically based on parametric and probabilistic descriptions of microstructural features. The inherent variability in these features are captured by the experimental data, and the probability distributions for the parameters associated with each feature are constructed. For each feature, realizations are sampled from these distribution functions using the Monte Carlo technique. Sampled features serve as inputs to the polycrystal generation software package Neper (Quey et al., 2011), which builds the SVE geometry.
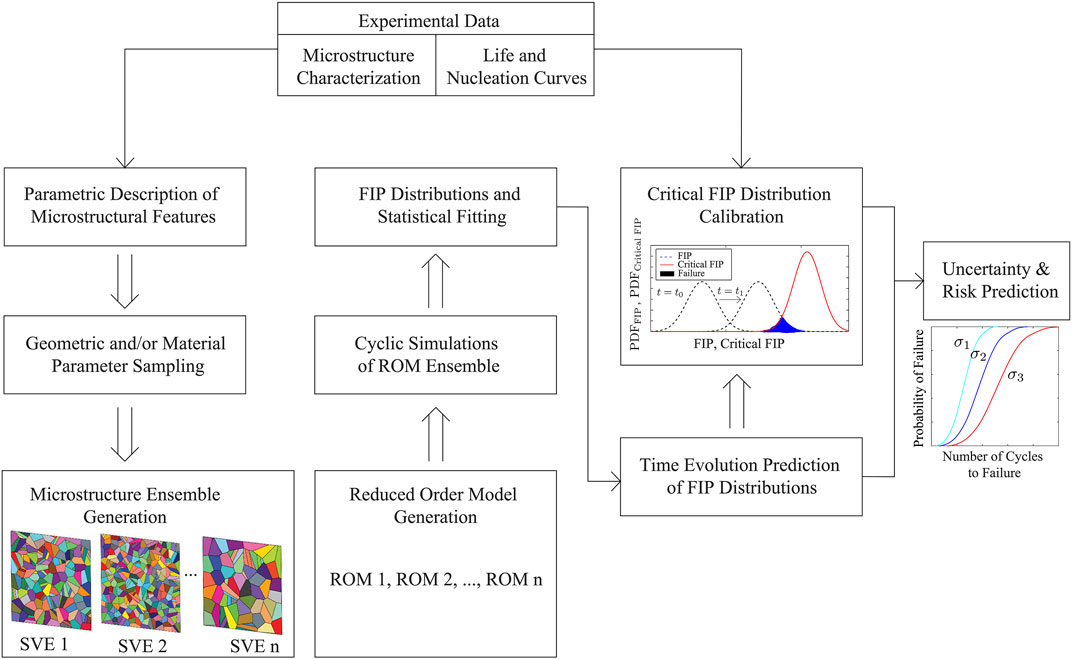
FIGURE 1. Overview of the proposed uncertainty quantification framework.
An important consideration is selecting the correlated values of SVE size (the physical dimension of the SVE) and the ensemble size (the number of SVEs simulated). When the computational cost of the model that predicts the mechanical response of an SVE is high, selection of the SVE size and the ensemble size may be limited by the practical consideration of computation and time resources. In the current study, the ensemble size is determined by the convergence of the statistics of the mechanical response for a prescribed SVE size. The convergence metric we employed in this study ensures that the discrepancy between FIP distributions computed using separately sampled SVE ensembles of the same size are within a prescribed tolerance.
The numerical simulations of the mechanical behavior of SVEs serve as the bridge between microstructure morphology and fatigue nucleation prediction under cyclic loading. While direct CPFE simulations of the SVEs provide highly accurate predictions of the local fields and stress risers within microstructures, computational costs of these simulations are typically too high to directly simulate the evolution of the response as a function of loading under high cycle regime and perform sufficient number of SVEs needed for probabilistic analysis. Instead we employ a sparse implementation (Zhang and Oskay, 2017) of the eigenstrain based homogenization method (EHM) (Zhang and Oskay, 2015). EHM is a reduced basis approximation of a CPFE simulation that allows accurate estimation of local and global response fields at a fraction of the cost of CPFE simulations (Liu et al., 2020). In EHM, the response fields are represented as a function of a series of influence functions, obtained by linear elastic analyses of the SVE. Coupled with a reduced basis approximation of inelastic strains and stresses, the equilibrium is approximated using a small system of nonlinear algebraic equations. This system is solved for a set of stress and inelastic strain fields averaged over SVE subdomains (or parts) in terms of coefficient tensors that retain the morphological information of the material. This approach has been shown to accurately describe small strain as well as large deformation response of polycrystals. A summary of the governing equations are provided in Section 4. For each SVE in the ensemble, the geometry is discretized, and the influence functions and coefficient tensors are computed to construct the reduced order model (ROM).
The ROMs are then exercised to simulate the spatio-temporal evolution of the response field within the SVEs. In view of the viscoplastic deformations within the microstructure, the microstructural response fields and hence FIPs continue to evolve as a function of load cycles. While the EHM approach allows for direct evaluation of several hundreds to thousands of cycles, evaluation of the high cycle fatigue response is computationally prohibitive in the context of a probabilistic framework. A time acceleration methodology (Crouch et al., 2013; Crouch and Oskay, 2015) is necessary to predict the long term evolution of the material response. In this study, the long term behavior is estimated in a statistical sense based on extrapolation of early (i.e., first few thousand cycles) evolution of the FIP probability densities. The FIP distribution computed from the SVE ensemble under the cyclic loading is fitted with an extreme value distribution (two parameter Weibull) and its evolution is extrapolated to predict the state of the distribution as a function of load cycles.
The critical FIP distribution refers to the uncertainty in the resistance of the material to fatigue nucleation. Direct experimental measurement of this critical distribution is not a trivial task. Instead, we identify this property based on experimental fatigue life measurements. The critical FIP distribution is obtained through numerical optimization, where the experimentally-observed and numerically simulated probability of fatigue nucleation is minimized for a prescribed load amplitude. The calibrated distribution along with the numerical simulation framework are exercised to predict nucleation life under different load conditions.
3 Titanium Alloy, Ti-6242
Ti-6242 is a near-α titanium alloy that has been widely used in aerospace and other engineering applications for its high specific strength, fracture toughness, high temperature capability and creep resistance. Fatigue life of near-α and α—β titanium alloys are well known to exhibit significant sensitivity to microstructural features (Leyens and Peters, 2003). Depending on the thermo-mechanical processing route, various types of microstructures are achieved, such as Widmanstatten, fully lamellar, bi-modal or duplex, and equiaxed α-dominated microstructures (Lütjering, 1998; Gockel et al., 2016). Colony grains consist of α-phase lamellae within large β-phase grains of several hundred microns in diameter. Increase in cooling rate leads to the reduction of colony grain size, α lamellae thickness, and the nucleation of new colonies, which produces the formation of “basket weave” or Widmanstatten microstructure (Sieniawski et al., 2013). In the current investigations, we incorporated both lamellar and pure α grains in the microstructure to model a wide range of morphology variations, and their effect on the probability of fatigue nucleation.
3.1 Microstructural Features
The effects of Ti-6242 microstructure have been investigated with respect to features (pure α grain size, colony grain, lamellae structure, micro-texture etc.) through experiments (e.g. (Lütjering, 1998; Sansoz and Ghonem, 2003; Collins et al., 2009)) and numerical simulations (e.g. (Deka et al., 2006; Ashton et al., 2017; Zhang and Dunne, 2017; Zhang and Dunne, 2018)). A schematic illustration of bi-modal Ti-6242 microstructure is shown in Figure 2. Two types of grains are considered: pure α grain and colony grain. A colony grain is made of a collection of fine laths of alternating α phase and β phase. Each pure α grain is idealized as a single crystal, while each colony grain contains multiple α variants with prescribed thickness (dα) and β lath with prescribed thickness (dβ). Particularly, four feature parameters of Ti-6242 are taken into account in this study: crystal orientation of prior β grain, colony grain volume fraction, α lath thickness and β lath thickness.
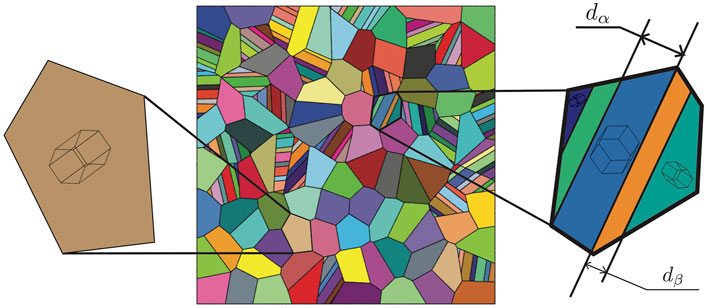
FIGURE 2. Schematic example of microstructure features.
Orientation of α phase at room temperature depends on the metallurgical high temperature state, i.e., the parent β phase. After a heat treatment in the parent β phase, the resulting α texture does not contain variant selection, i.e., all variations have equal chances to be generated. However, with a mechanical deformation in the parent β phase, the volumes of α phases at room temperature are unbalanced. Therefore, the mechanical deformation and orientation of the prior β grain influence the crystal orientations of the α phases in the microstructure. Notwithstanding various potential mechanical deformations (Lütjering, 1998), in the current manuscript, we consider the rolling induced mechanical deformation. In this study, we consider that a SVE domain is occupied by a single prior β grain, and the orientation of the β grain is random.
The prior β orientation is represented using three Euler angles
where bi is the BOR for the ith variant. The volume of the ith α phase related to the volume of the prior β grain fβ(gβ) by
and vi is the variant selection function defined by
where γi is the resolved shear strain for the ith variant, γ0 = X%γmax is the minimum resolved shear strain amplitude that corresponding α variant is possible to form, and γmax is the maximum resolved shear strain amplitude among all slip systems under given thermo-mechanical loading. The denominator sums the slip rates for which the amplitudes are larger than γ0. This equation is based on the assumption that the orientations of α grains are distributed according to the shear strains in the corresponding slip systems, and γ0 is the threshold shear strain. Following (Gey et al., 1997), X is selected as 50.
3.2 Uncertainty in Microstructure
The sources of the uncertainties in the parameters are two fold. First is the variability observed in microstructures built using identical thermo-mechanical processing (TMP) conditions. The second is the variability in samples built by different TMP conditions. While the latter source of uncertainty is reducible, access to precise TMP conditions of the experimental samples are not often readily available and well-documented. We therefore consider the presence of both sources of uncertainties.
Table 1 shows the summary of measured values and values used in numerical studies for the microstructure geometry parameters that were used to bound the uncertainties. Deka et al. (Deka et al., 2006) measured the volume fraction of the transformed β phase and primary α grain in the overall Ti-6242 microstructure to be 30 percent and 70 percent, respectively. Within the colony grains, α and β lamellae were experimentally observed to have volume fractions of approximately 88 and 12%, respectively. However, measured values for the volume fraction of α and β phases of Ti-6242 are 90 percent and 10 percent in the experiments by Jun et al. (Jun et al., 2016a) using secondary electron micrographs. Similarly, the volume fraction of α grains in the Ti-6242 specimens is approximately 90 percent in the experiments conducted by Qiu et al. (Qiu et al., 2014). The grain size of α grains is approximately 13.6 μm. Sansoz and Ghonem (Sansoz and Ghonem, 2003) performed scanning electron microscope examinations on the fracture surface of three microstructures in order to identify the relevant crack growth mechanisms with respect to the microstructure details. In these three microstructures, the average thicknesses of α laths are quite different (0.7, 2.0 and 5.9 mm), while the average thickness of the β lath is found to be similar in all produced microstructures (0.2 mm). Jun et al. (Jun et al., 2016b) studied local deformation mechanisms in Ti-6242 by performing in-situ micropillar compression tests on nine different pillars, and they concluded that, for the colony structures, the presence and morphology of the β phase can significantly alter the apparent yielding point and work hardening response. The widths of α and β lath in their specimens were approximately 2 and 0.5 mm, while the averaged thicknesses in the nine processed specimens were around 3.7 and 0.8 mm for α and β lath, respectively.
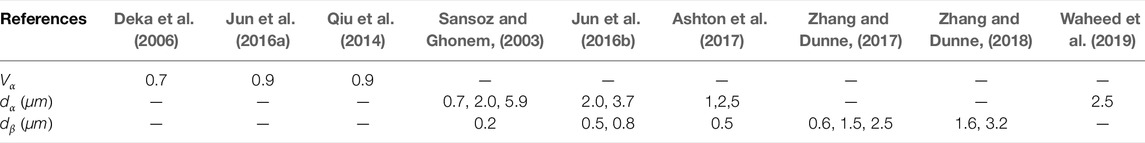
TABLE 1. Measured values of the microstructure geometry parameter for Ti-6242 available in the literature.
The range of values observed in the aforementioned experimental observations are used herein to bound the ranges of microstructure geometry model parameters. Table 2 summarizes the bounds used for all parameters. Since no distributional information is available, the parameters are considered to be uniformly distributed within these bounds.
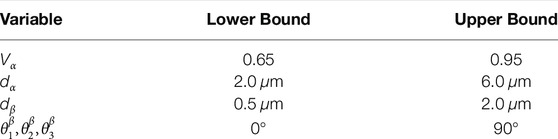
TABLE 2. Morphology parameters.
3.3 Uncertainty in Fatigue Life
To estimate the fatigue nucleation life based on total fatigue lives reported in experimental samples, the fatigue crack growth (FCG) model developed by Shen et al. (Shen et al., 2004) is used. Three stages of fatigue failure (crack initiation, crack propagation and final rupture) are all taken into account in the employed FCG equations. The fundamental idea is to solve for the cycle number of fatigue nucleation given the experimentally observed fatigue failure life, i.e., the inverse of problem of FCG. The initial crack length at fatigue nucleation is taken to be 0.1 mm following (McBagonluri et al., 2005). In the current manuscript, Paris’ parameters (C and m) and fracture toughness are the taken to be same as in Ref. (Shen et al., 2004), while the other model parameters are re-computed based on the values and continuity conditions provided in the reference. The model parameters used in this study are summarized in Table. 3 x0, x1, x2 and x3 are the transition points between fatigue regimes. x3 is computed from to the fracture toughness (47.1
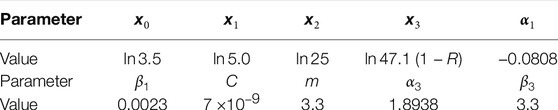
TABLE 3. Parameters of the FCG model.
Several studies report experimentally measured number of cycles to failure Nf for Ti-6242 at various stress levels. Fujishiro and Eylon (Fujishiro and Eylon, 1980) investigated the effect of Pt ion plating on the high cycle axial fatigue life of Ti-6242 specimens at room temperature and 455°C. Measured number of cycles to failure at room temperature without Pt coat are employed in this study. Yuan et al. (Yuan et al., 2019) studied the effects of surface roughness and residual stress induced by the mechanical polishing treatments (cold rolling polishing (CRP), sandpaper polishing (SP) andnylon cloth polishing (NCP)) on fatigue life. Sinha et al. (Sinha et al., 2004) presented the results of a study of the response of an β-forged Ti-6242 during static, normal-fatigue, and dwell-fatigue loading. Results under pure fatigue loading is employed in the current study. Ghosh et al. (Ghosh et al., 2007) conducted pure fatigue and dwell fatigue tests with different test conditions (load ratio, dwell time and peak stress to yield strength ratio) for the three α/β-forged and one β-forged Ti-6242. Ref (Mechanical Properties Data Center Traverse City Mich, 1972). provided the fatigue properties of duplex annealed sheet at room temperature and smooth rotating beam made of Ti-6242. However, available data points are limited to relative low stress level (
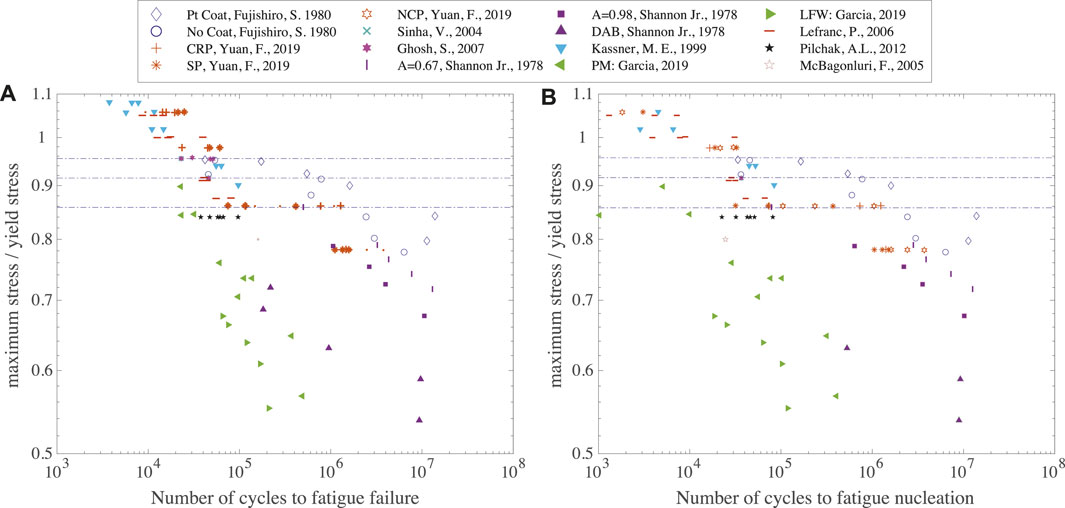
FIGURE 3. (A) Experimental fatigue failure data available in the open literature; and (B) nucleation life estimated based on the experimental life data and the FCG model. The dashed lines represent three stress levels investigated in the numerical analysis.
4 Methodology
4.1 DD-EHM Formulation
The domain of an SVE is denoted as
in which,
Equation 5 is evaluated alongside crystal plasticity models (detailed below) that describe the evolution of part-averaged plastic deformations. The constitutive laws are therefore expressed in terms of part-averaged quantities. Since the constitutive equations are nonlinear, the EHM formulation results in a nonlinear algebraic system of 6n equations to describe the SVE response. Since all
In simulations below, fatigue loading is defined in terms of stress rather than strain. In order to ensure that proper load amplitude is applied at each cycle, a stress-controlled incrementation scheme is implemented, where the strain rate is kept until a peak SVE-average stress is reached and then reversed to begin unloading. The SVE-averaged stress is computed as
where
4.2 Constitutive Model
A dislocation-mediated crystal plasticity model (Liu et al., 2018) has been adopted to describe the evolution of viscoplastic deformation within each subdomain,
where
where
The contributions by dislocation debris and forest dislocations to strength evolution are denoted as
where μ is the shear modulus, χ is the dislocation interaction parameter, bs is the Burgers vector.
The total forest dislocation density is expressed as:
where
where p is a reversibility parameter.
where
where
The evolution of the debris dislocation density is expressed as:
where q is the recovery rate coefficient.
4.3 Fatigue Indicator Parameter
The mechanical behavior of the Ti-6242 microstructure under repeated cyclic loading is predicted by the Sparse DD-EHM, while the onset of fatigue is indicated by the FIP which is a function of microscale information (plastic strain, energy etc). A number of FIPs have been previously proposed to predict fatigue initiation life of polycrystalline materials. Przybyla and McDowell (Przybyla and McDowell, 2011) employed the maximum plastic shear strain range (MPSS) and Fatemi-Socie (FS) damage parameter to investigate driving forces for fatigue crack formation at the scale of microstructure. Li et al. (Li et al., 2016) developed a fatigue parameter based on accumulated plastic strain accounting for triaxiality and temperature effects to predict thermo-mechanical fatigue. Sangid et al. (Sangid et al., 2011) proposed an energy-based failure criterion to link the variability in the microstructure to fatigue response.
In the context of titanium alloys, the nucleation process results in facet formation in a hard grain generally oriented along a direction near the basal plane. Liu et al. (Liu et al., 2020) proposed maximum relative dislocation density discrepancy (MD3) as a FIP for titanium alloys, considering that dislocation pile-ups at grain boundaries induce crack nucleation. The amount of pile-ups and the inability of the dislocations cross the grain boundary are collectively quantified by the relative dislocation density discrepancy (D3) across a grain boundary. MD3 indicates the maximum value of D3 across all grain boundaries within the SVE. Instead of focusing on a single extreme value (i.e., MD3) over entire microstructure and history, we aggregate the spatial distribution of D3 within each SVE of an SVE ensemble. The D3 distribution at peak load amplitude is tracked.
The D3 for grain i,
where
5 Fatigue Nucleation Prediction
5.1 Constitutive Model Parameters
The microstructure of Ti-6242 is modeled using two types of crystals: BCC β phase and HCP α phase. To ensure that the constitutive formulation captures the response of the alloy accurately, the constitutive parameters calibrated by Liu et al. (Liu et al., 2020) are employed. The constitutive model parameters are considered to be deterministic that are calibrated using a representative volume (i.e., representative for the purposes of viscoplastic response). Specimen to specimen variability in the static stress-strain response, which influences fatigue nucleation uncertainty (especially in low cycle fatigue), has been partially explained by the uncertainty in the model parameters (Sangid et al., 2011; Zhang and Oskay, 2018; Zhang and Oskay, 2019; Zhang and Oskay, 2021). Under high cycle fatigue conditions considered in this study, the effect of parameter uncertainty for elastic and viscoplastic properties is not explicitly incorporated.
The HCP model includes 30 slip systems including the basal, pyramidal and prismatic systems, and the BCC model includes 48 slip systems. All slips systems used in the model are summarized in Table. 5. The elastic parameters are listed in Table 4, and the flow and hardening parameters for both the HCP and BCC lattices are summarized in Table 6.
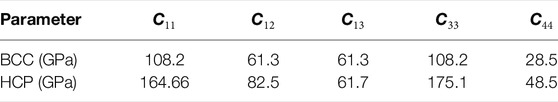
TABLE 4. Elastic constants for HCP and BCC crystals.
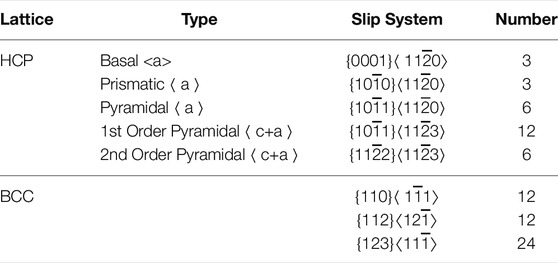
TABLE 5. Slip system of HCP and BCC.
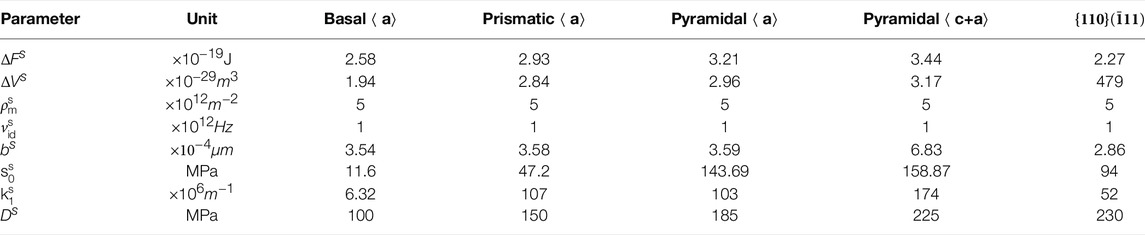
TABLE 6. Flow rule parameters for HCP and BCC crystals.
The strength hardening evolution in HCP dominated crystals is controlled by initial slip resistance, forest dislocation and debris dislocation, and corresponding parameters are summarized in Table 7. The dislocation interaction parameter χ is set as 0.9 to satisfy the Taylor relationship (Beyerlein and Tomé, 2008). The material independent factor kdeb is set as 0.086 (Madec et al., 2002). A small value of initial forest dislocation density is adopted, ρfor, 0 = 1 × 10¹² m−2, according to experimental observations (Mecking and Kocks, 1981; Naka et al., 1988; Viguier et al., 1995). The reversibility parameter p is chosen as 0.8 (Kitayama et al., 2013). The reference shear strain rate
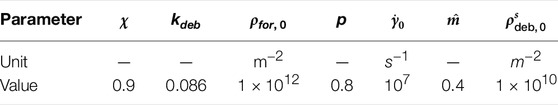
TABLE 7. Hardening parameters.
5.2 SVE Ensemble
The mechanical response of Ti-6242 SVEs under cyclic loading is obtained using the EHM approach. In order to facilitate uncertainty computations (i.e., reduce computational cost), SVEs are modeled as quasi 2D. The edge length of an SVE is set to 39 μm. Grain sizes are sampled from a bi-modal distribution function (lognormal distribution (sigma, mu) = (10.21, 0.16) and normal distribution with cutoff (sigma, mu) = (0.43, 1.74)) (Liu et al., 2020). Morphology parameters shown in Table 2 are randomly sampled, SVEs generated and discretized, and coefficient tensors are computed to build a ROM for each SVE.
The SVEs were subjected to stress controlled tensile loads with an R-ratio of 0.1 and load frequency of 1 Hz Viguier et al. (Viguier et al., 1995). For each SVE within the ensemble, the fatigue indicator parameter (i.e., D3) at every grain interface was computed as a function of load cycles. The D3 values were then aggregated across the ensemble to obtain the D3 distribution and its time evolution.
The effect of SVE ensemble size and the SVE size on predicted D3 distribution are determined through a numerical convergence study. In order to quantify the effect of ensemble size, we performed a pool of 10,258 SVE simulations. The size of the pool is selected large enough so that the D3 distribution for the entire pool could be considered representative and converged. All ensembles were then generated by random sampling from the SVE pool. All simulations were performed using NASA’s Pleiades supercomputer. Each SVE simulation in the pool was subjected to 10 cycles of loading with load amplitude of X%σy. D3 values were extracted from the end of the load cycle. The PDFs and CDFs of D3 distributions for ensemble sizes of 100, 250, 500, 750, 1,000 and 2,000 are shown in Figure 4. For each ensemble size s, s SVEs are randomly selected out of the simulation pool, and this process was repeated for 50 times. These 50 separate ensembles (referred to as ensemble samples) were used to quantify the variation in D3 distributions. The results demonstrate a clear narrowing trend in the variations with increasing ensemble size, which confirms the expectation that increased ensemble size allows a more thorough sampling leading to less ensemble-to-ensemble variation. We further contend that large ensemble sizes are necessary to achieve sufficient sampling of the extreme value statistics. It is possible to reduce the demand on the ensemble size by increasing the size of the SVE instead. However, larger ensembles of smaller SVEs are computationally less costly as SVE simulations in the ensemble can be performed in parallel with linear scalability, whereas evaluation of a single SVE simulation in parallel typically scales sublinearly with size. In the current manuscript, the SVE size with 150 grains is applied for each microstructure, and we aggregate the responses in the analyses.

FIGURE 4. Variability in the cumulative and probability distributions of D3 as a function of ensemble size (A) 100 SVEs, (B) 250 SVEs, (C) 500 SVEs, (D) 750 SVEs, (E) 1,000 SVEs and (F) 2,000 SVEs.
The ensemble-to-ensemble variability as a function of ensemble size is quantified using the Kolmogorov–Smirnov (KS) test. The Kolmogorov–Smirnov measure D* for two arbitrary sample cumulative distribution functions, F1(x) and F2(x), is defined as
D* is the largest absolute difference between two CDFs. For a given ensemble size, we computed the KS measure of every pair of CDF ensemble samples, resulting in 1,225 D* values. Figure 5A shows the PDFs of the KS statistics at different ensemble sizes and Figure 5B shows the histograms of maximum KS statistics as a function of ensemble size.
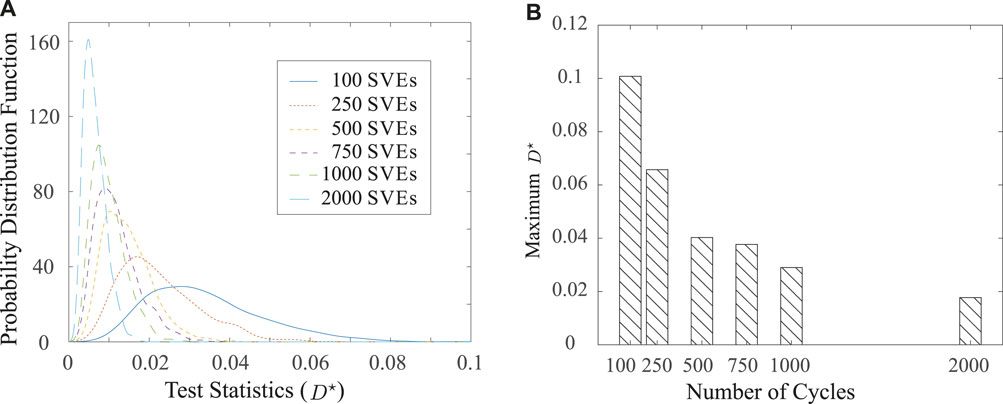
FIGURE 5. Kolmogorov–Smirnov measure D* (A) Distribution of D* with increasing number of SVEs, and convergence of max D* with increasing number of SVEs.
It is clear that increasing ensemble size monotonically reduces both the variance of D* and mean of D* distribution, confirming the converging trend of D3 distribution with ensemble size. The maximum values of D*, which correspond to the largest difference among all 50 ensemble samples for a given size, are extracted and plotted as a function of ensemble size in Figure 5B. Increasing the ensemble size from 100 to 2,000 significantly reduces the discrepancy between the aggregated D3 distribution (
5.3 Long Term Evolution of FIP Distributions
Tracking the evolution of the FIP distribution as a function of load cycles based on cycle-by-cycle simulation of an ensemble of SVEs is computationally prohibitive for high cycle fatigue. For instance, evaluation of a single SVE response over 1,000 load cycles using the sparse DD-EHM approach require approximately 1 CPU-day. Therefore, an extrapolation technique is employed to predict the long term evolution of FIP distribution. For the first 1,000–2,000 cycles, the distribution of FIP is predicted by the sparse DD-EHM approach for SVE ensembles. The particular number of cycles to simulate at a given load amplitude is chosen such that the rate of change of the FIP distribution is at a steady state. For response at larger cycle numbers, the FIP distributions are fitted to parameterized extreme value distributions with parameters extrapolated from the sparse DD-EHM predictions.
In the current study, five hundred SVEs are selected to represent the 10,258 SVE pool based on the selection criterion that the difference between maximum D* of the 500 SVE ensemble and maximum D* of the 10,258 SVE pool is smaller than the critical value (
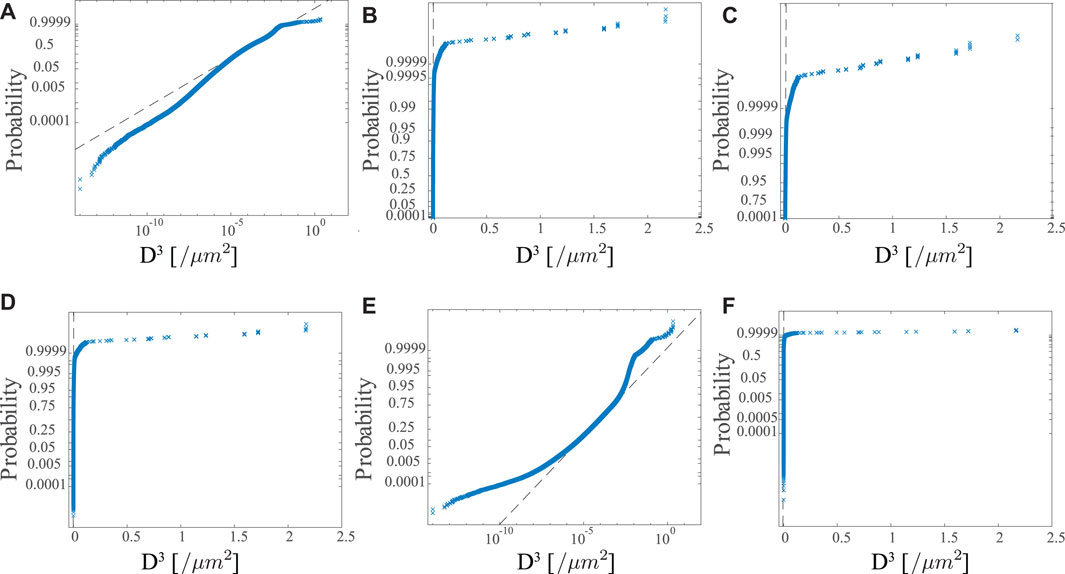
FIGURE 6. Distribution fits for (A) Weibull, (B) Rayleigh, (C) exponential, (D) normal, (D) lognormal and (F) extreme value models.
The probability distribution for a Weibull random variable is expressed as:
where k > 0 is the shape parameter, and λ > 0 is the scale parameter.
At 91.5% yield stress, the distributions at 100 cycles, 200 cycles, 500 cycles and 1000 cycles are shown in Figure 7. The Weibull distribution captures the tail of D3 distribution for D3 > 10–5 reasonably well for all time instances. The D3 distributions shift towards higher D3 with increasing number of load cycles. It may also be possible to obtain reasonable fits with other distributions such as Gumbel or Frechet distributions, which were suggested in some previous studies (Przybyla and McDowell, 2010).
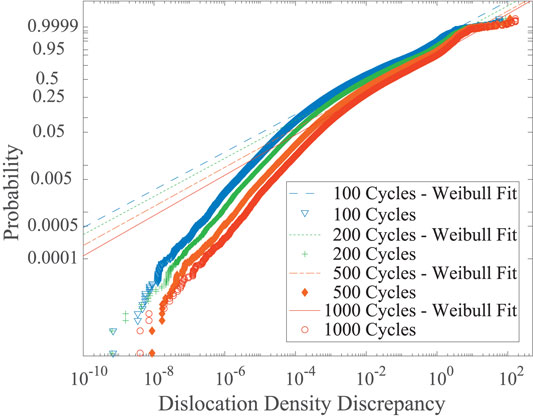
FIGURE 7. Motion of D3 distribution.
To estimate the evolution of D3 distribution between 1,000 cycles to 100,000 cycles or higher, the parameters of Weibull distribution are expressed in a function form that varies with the number of load cycles. The temporal evolution of the shape and scale parameters within the first 1,000 or 2,000 cycles as computed directly by the SVE simulations, and as fitted to a bilinear curve are shown in Figure 8. Figures 8A,B respectively shows the evolution of scale and shape parameters at three stress levels (85.8, 91.5 and 95.5% yield stress) as a function of cycle number. The time evolution of the scale and shape parameters obtained from SVE simulations are indicated by circle, triangle and diamond symbols. In these plots we observe, 1) the initial quick increase of local dislocation density mismatch, due to rapid dislocation density accumulation at the onset of plastic deformation followed by 2) stable dislocation accumulation due to strain hardening in CRSS, leading to a stable slip accumulation and dislocation density accumulation. Capturing the second stage (i.e., the slope of the curves in the second stage) is particularly important as it is projected to continue for a large number of cycles. A bilinear curve is the simplest curve that is able to fit the observed behavior. The bilinear fits capture the SVE data well particularly at large number of cycles, where the evolutions of the parameters stabilize. A change in the scale parameter affects on the distribution as a change of the abscissa scale. The reduction in the value of the scale parameter while keeping the shape parameter constant results in the narrowing of the distribution. As indicated in Figure 8A, higher stress level has larger scale parameter therefore larger variation in D3 distribution.
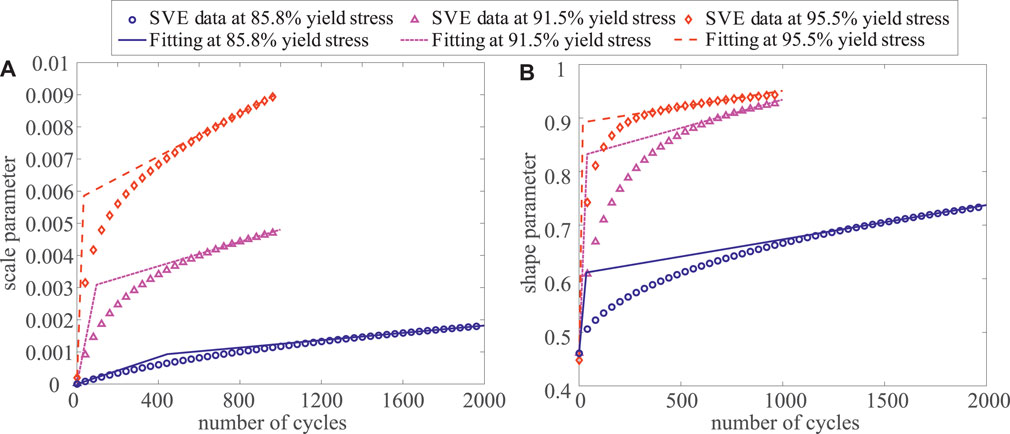
FIGURE 8. Temporal evolution of (A) the scale parameter and (B) the shape parameter.
5.4 Critical FIP Calibration and Model Validation
Direct experimental observations of the fatigue indicator parameter at fatigue nucleation are not available at the material microstructure scale. The calibration of the critical D3 distribution is performed by minimizing the discrepancy between the measurements of fatigue life and model predictions at a prescribed load amplitude (i.e., 91.5% of yield stress). The calibrated critical FIP distribution is then validated by comparing the model predictions and experimental life curves at other load amplitudes (i.e., 95.5 and 85.8% of yield stress). 91.5% of yield stress load amplitude was used in the calibration because larger number of experimental data points are available for this load level compared with the other load levels. The calibration was performed using numerical optimization by minimizing the discrepancy in the probability of fatigue nucleation expressed as:
where Ri is the difference between the predicted PFN and experimental PFN at the ith data point, and ncp is the number of calibration points. We note that since the number of experimental data points is relatively low, data were first fitted to a smooth distribution and the calibration was performed by minimizing the discrepancy between data points from the fitted distribution and the simulation results. The outcome of the calibration process is shown in Figure 9B. The calibrated strength distribution and predicted evolution of D3 distributions at 91.5% yield stress are plotted in Figure 10. The motion of D3 is represented every 5,000 cycles and up to 50,000 cycles.
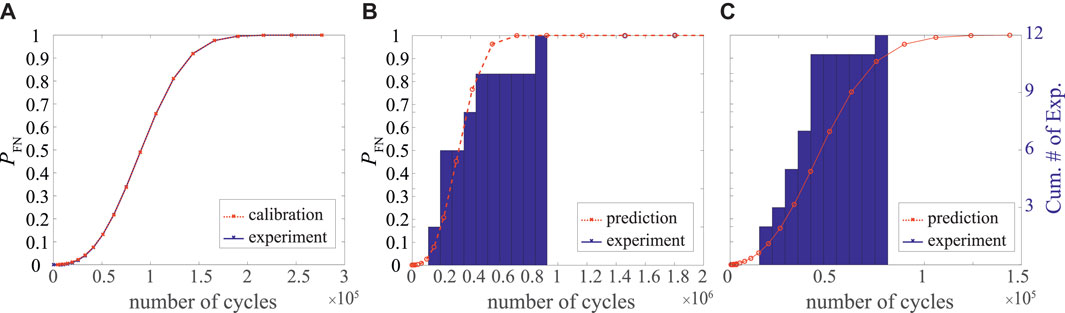
FIGURE 9. Probability of fatigue nucleation PFN as a function of load cycles: (A) calibration at 91.5% of yield stress; (B) prediction at 85.8% of yield stress and (C) prediction at 95.5% of yield stress.
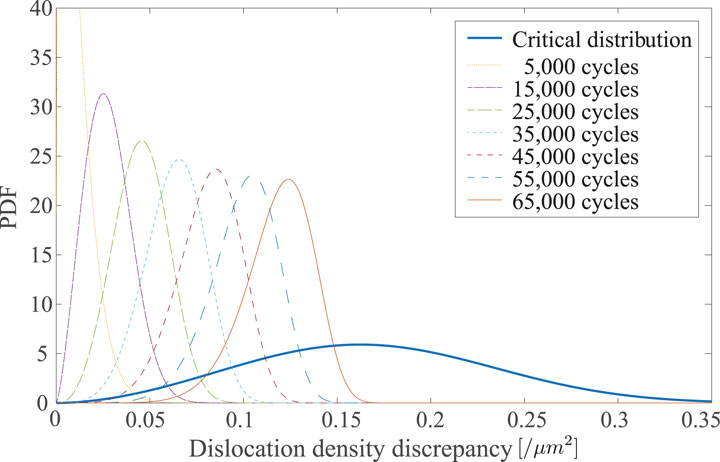
FIGURE 10. Distribution of D3 and critical D3.
Figure 9 illustrates the predicted probability of the fatigue nucleation curves are compared with those from experimental observations for load amplitudes of 85.8, 91.5 and 95.5% of yield stress, respectively. The simulated probability of fatigue nucleation at 91.5% yield stress is from calibration and therefore exhibits high accuracy. The fatigue nucleation probabilities are slightly underpredicted for the low amplitude loading, whereas they are slightly overpredicted for the high amplitude loading. It is important to note that the total number of cycles to failure varies significantly (e.g., more than an order of magnitude between 85.8 and 91.5% loading) across the narrow load amplitude range, and this variation is very well captured by the model predictions. One of the primary reasons for the discrepancy between the predicted results and the model observations is that the number of experimental data points employed to generate the experimental probabilities of fatigue nucleation is relatively low as shown in Figure 3.
6 Conclusion
This manuscript established a computational framework to predict fracture nucleation in polycrystalline microstructures under cyclic loading conditions. The proposed framework is probabilistic and considers the existence of an inherent property in the microstructure, i.e., a critical distribution of fatigue resistance that reflects the uncertainty induced by features that remain unresolved at the scale of the grains. In view of the results of the proposed investigations, we make the following observations and conclusions: 1) A large ensemble of SVEs, of approximately an order of magnitude larger than what most previous studies considered is necessary to resolve the extreme value statistics at the microstructural scale. This observation emphasizes the need to employ fast solution algorithms in space and in time (e.g., reduced order models, machine learning models, time acceleration schemes) that allow for response evaluation of such large ensembles of SVEs over large number of cycles. 2) Validation of a probabilistic computational framework such as the one proposed requires a large experimental dataset, since extreme value statistics drive the nucleation process. To the best of our knowledge, there is no such dataset available in the open literature. 3) Furthermore, a thorough validation of model predictions would need direct (and sufficient number of) experimental observations of where and when fatigue cracks nucleate. In view of the large variability of number of cycles that nucleate fatigue cracks and the role of the microstructural features in nucleating those cracks, the proposed probabilistic computational framework offers a pathway for robust assessment of fatigue life in polycrystalline materials.
Data Availability Statement
The raw data supporting the conclusions of this article will be made available by the authors, without undue reservation.
Author Contributions
XZ was responsible for executing the computational research and providing manuscript draft. YL supported the materials modeling aspects of the research. CO conceived the idea of the paper, oversaw the execution of the research and drafting of the manuscript and finalized the manuscript.
Conflict of Interest
The authors declare that the research was conducted in the absence of any commercial or financial relationships that could be construed as a potential conflict of interest.
Publisher’s Note
All claims expressed in this article are solely those of the authors and do not necessarily represent those of their affiliated organizations, or those of the publisher, the editors and the reviewers. Any product that may be evaluated in this article, or claim that may be made by its manufacturer, is not guaranteed or endorsed by the publisher.
Acknowledgments
The authors gratefully acknowledge the financial support from the National Aeronautics and Space Administration, Space Technology Research Grants (Early State Innovation Grant Nos.: 80NSSC20K0294).
References
Abuzaid, W., Sehitoglu, H., and Lambros, J. (2013). Plastic Strain Localization and Fatigue Micro-Crack Formation in Hastelloy X. Mater. Sci. Eng. A 561, 507–519. doi:10.1016/j.msea.2012.10.072
Anahid, M., and Ghosh, S. (2013). Homogenized Constitutive and Fatigue Nucleation Models from Crystal Plasticity Fe Simulations of Ti Alloys, Part 2: Macroscopic Probabilistic Crack Nucleation Model. Int. J. Plasticity 48, 111–124. doi:10.1016/j.ijplas.2013.02.008
Appel, F., Lorenz, U., Oehring, M., Sparka, U., and Wagner, R. J. M. S. (1997). Thermally Activated Deformation Mechanisms in Micro-Alloyed Two-phase Titanium Amminide Alloys. Mater. Sci. Eng. A 233 (1-2), 1–14. doi:10.1016/s0921-5093(97)00043-9
Ashton, P. J., Jun, T.-S., Zhang, Z., Britton, T. B., Harte, A. M., Leen, S. B., et al. (2017). The Effect of the Beta Phase on the Micromechanical Response of Dual-phase Titanium Alloys. Int. J. Fatigue 100, 377–387. doi:10.1016/j.ijfatigue.2017.03.020
Bandyopadhyay, R., Prithivirajan, V., Peralta, A. D., and Sangid, M. D. (2020). Microstructure-Sensitive Critical Plastic Strain Energy Density Criterion for Fatigue Life Prediction across Various Loading Regimes. Proc. R. Soc. A 476 (2236), 20190766. doi:10.1098/rspa.2019.0766
Bandyopadhyay, R., Prithivirajan, V., and Sangid, M. D. (2019). Uncertainty Quantification in the Mechanical Response of Crystal Plasticity Simulations. Jom 71 (8), 2612–2624. doi:10.1007/s11837-019-03551-3
Bandyopadhyay, R., and Sangid, M. D. (2021). A Probabilistic Fatigue Framework to Enable Location-specific Lifing for Critical Thermo-Mechanical Engineering Applications. Integr. Mater Manuf. Innov. 10 (1), 20–43. doi:10.1007/s40192-021-00198-4
Beyerlein, I. J., and Tomé, C. N. (2008). A Dislocation-Based Constitutive Law for Pure Zr Including Temperature Effects. Int. J. Plast. 24 (5), 867–895. doi:10.1016/j.ijplas.2007.07.017
Biallas, G., Essert, M., and Maier, H. J. (2005). Influence of Environment on Fatigue Mechanisms in High-Temperature Titanium Alloy Imi834. Int. J. Fatigue 27 (10-12), 1485–1493. doi:10.1016/j.ijfatigue.2005.06.009
Bock, F. E., Aydin, R. C., Cyron, C. J., Huber, N., Kalidindi, S. R., and Klusemann, B. (2019). A Review of the Application of Machine Learning and Data Mining Approaches in Continuum Materials Mechanics. Front. Mat. 6, 110. doi:10.3389/fmats.2019.00110
Carroll, J. D., Abuzaid, W., Lambros, J., and Sehitoglu, H. (2013). High Resolution Digital Image Correlation Measurements of Strain Accumulation in Fatigue Crack Growth. Int. J. Fatigue 57, 140–150. doi:10.1016/j.ijfatigue.2012.06.010
Castelluccio, G. M., and McDowell, D. L. (2015). Microstructure and Mesh Sensitivities of Mesoscale Surrogate Driving Force Measures for Transgranular Fatigue Cracks in Polycrystals. Mater. Sci. Eng. A 639, 626–639. doi:10.1016/j.msea.2015.05.048
Castelluccio, G. M., and McDowell, D. L. (2016). Microstructure-sensitive Small Fatigue Crack Growth Assessment: Effect of Strain Ratio, Multiaxial Strain State, and Geometric Discontinuities. Int. J. Fatigue 82, 521–529. doi:10.1016/j.ijfatigue.2015.09.007
Castelluccio, G. M., Musinski, W. D., and McDowell, D. L. (2014). Recent Developments in Assessing Microstructure-Sensitive Early Stage Fatigue of Polycrystals. Curr. Opin. Solid State Mater. Sci. 18 (4), 180–187. doi:10.1016/j.cossms.2014.03.001
Collins, P. C., Welk, B., Searles, T., Tiley, J., Russ, J. C., and Fraser, H. L. (2009). Development of Methods for the Quantification of Microstructural Features in α+ β-processed α/β Titanium Alloys. Mater. Sci. Eng. A 508 (1-2), 174–182. doi:10.1016/j.msea.2008.12.038
Crouch, R., and Oskay, C. (2015). Accelerated Time Integrator for Multiple Time Scale Homogenization. Int. J. Numer. Meth. Engng. 101 (13), 1019–1042. doi:10.1002/nme.4863
Crouch, R., Oskay, C., and Clay, S. (2013). Multiple Spatio-Temporal Scale Modeling of Composites Subjected to Cyclic Loading. Comput. Mech. 51 (1), 93–107. doi:10.1007/s00466-012-0707-9
Cruzado, A., Lucarini, S., LLorca, J., and Segurado, J. (2018). Crystal Plasticity Simulation of the Effect of Grain Size on the Fatigue Behavior of Polycrystalline Inconel 718. Int. J. Fatigue 113, 236–245. doi:10.1016/j.ijfatigue.2018.04.018
Deka, D., Joseph, D. S., Ghosh, S., and Mills, M. J. (2006). Crystal Plasticity Modeling of Deformation and Creep in Polycrystalline Ti-6242. Metall. Mat. Trans. A 37 (5), 1371–1388. doi:10.1007/s11661-006-0082-2
Dunne, F. P. E., Wilkinson, A. J., and Allen, R. (2007). Experimental and Computational Studies of Low Cycle Fatigue Crack Nucleation in a Polycrystal. Int. J. Plast. 23 (2), 273–295. doi:10.1016/j.ijplas.2006.07.001
Forest, S. (2008). Some Links between Cosserat, Strain Gradient Crystal Plasticity and the Statistical Theory of Dislocations. Philos. Mag. 88 (30-32), 3549–3563. doi:10.1080/14786430802154815
Fujishiro, S., and Eylon, D. (1980). Improvement of Ti Alloy Fatigue Properties by Pt Ion Plating. Mta 11 (8), 1259–1263. doi:10.1007/bf02653479
García, J. M., and Morgeneyer, T. F. (2019). Strength and Fatigue Strength of a Similar Ti‐6Al‐2Sn‐4Zr‐2Mo‐0.1Si Linear Friction Welded Joint. Fatigue Fract. Eng. Mater Struct. 42 (5), 1100–1117. doi:10.1111/ffe.12973
Gey, N., Humbert, M., Philippe, M. J., and Combres, Y. (1997). Modeling the Transformation Texture of Ti-64 Sheets after Rolling in the β-field. Mater. Sci. Eng. A 230 (1-2), 68–74. doi:10.1016/s0921-5093(97)80111-6
Ghosh, S., Mills, M., Rokhlin, S., Sinha, V., Soboyejo, W., and Williams, J. (2007). The Evaluation of Cold Dwell Fatigue in Ti-6242. Federal Aviation Authority report, DOT/FAA/AR-06/24. NJ, United States: US Dept. of Transportation.
Gockel, J., Klingbeil, N., and Bontha, S. (2016). A Closed-form Solution for the Effect of Free Edges on Melt Pool Geometry and Solidification Microstructure in Additive Manufacturing of Thin-Wall Geometries. Metall Materi Trans B 47 (2), 1400–1408. doi:10.1007/s11663-015-0547-z
Gu, T., Stopka, K. S., Xu, C., and McDowell, D. L. (2020). Prediction of Maximum Fatigue Indicator Parameters for Duplex Ti-6Al-4V Using Extreme Value Theory. Acta Mater. 188, 504–516. doi:10.1016/j.actamat.2020.02.009
Ho, H. S., Risbet, M., Feaugas, X., and Moulin, G. (2011). The Effect of Grain Size on the Localization of Plastic Deformation in Shear Bands. Scr. Mater. 65 (11), 998–1001. doi:10.1016/j.scriptamat.2011.09.001
Hrabe, N., Gnäupel-Herold, T., and Quinn, T. (2017). Fatigue Properties of a Titanium Alloy (Ti-6Al-4V) Fabricated via Electron Beam Melting (EBM): Effects of Internal Defects and Residual Stress. Int. J. Fatigue 94, 202–210. doi:10.1016/j.ijfatigue.2016.04.022
Jiang, J., Yang, J., Zhang, T., Dunne, F. P. E., and Britton, T. B. (2015). On the Mechanistic Basis of Fatigue Crack Nucleation in Ni Superalloy Containing Inclusions Using High Resolution Electron Backscatter Diffraction. Acta Mater. 97, 367–379. doi:10.1016/j.actamat.2015.06.035
Jun, T.-S., Armstrong, D. E. J., and Britton, T. B. (2016a). A Nanoindentation Investigation of Local Strain Rate Sensitivity in Dual-phase Ti Alloys. J. Alloys Compd. 672, 282–291. doi:10.1016/j.jallcom.2016.02.146
Jun, T.-S., Sernicola, G., Dunne, F. P. E., and Britton, T. B. (2016b). Local Deformation Mechanisms of Two-phase Ti Alloy. Mater. Sci. Eng. A 649, 39–47. doi:10.1016/j.msea.2015.09.016
Kassner, M. E., Kosaka, Y., and Hall, J. S. (1999). Low-cycle Dwell-Time Fatigue in Ti-6242. Metall Mat Trans A 30 (9), 2383–2389. doi:10.1007/s11661-999-0246-y
Kitayama, K., Tomé, C. N., Rauch, E. F., Gracio, J. J., and Barlat, F. (2013). A Crystallographic Dislocation Model for Describing Hardening of Polycrystals during Strain Path Changes. Application to Low Carbon Steels. Int. J. Plast. 46, 54–69. doi:10.1016/j.ijplas.2012.09.004
Kotha, S., Ozturk, D., and Ghosh, S. (2020). Uncertainty-quantified Parametrically Homogenized Constitutive Models (Uq-phcms) for Dual-phase α/β Titanium Alloys. Npj Comput. Mater. 6 (1), 1–20. doi:10.1038/s41524-020-00379-3
Larsen, J. M., Jha, S. K., Szczepanski, C. J., Caton, M. J., John, R., Rosenberger, A. H., et al. (2013). Reducing Uncertainty in Fatigue Life Limits of Turbine Engine Alloys. Int. J. Fatigue 57, 103–112. doi:10.1016/j.ijfatigue.2013.01.012
Lefranc, P., Sarrazin-Baudoux, C., and Doquet, V. (2006). “Dwell-fatigue Behaviour of a Beta-Forged Ti 6242 Alloy,” in Fracture of Nano and Engineering Materials and Structures (Springer), 171–172.
Leyens, C., and Peters, M. (2003). Titanium and Titanium Alloys: Fundamentals and Applications. Weinheim, Germany: John Wiley & Sons.
Li, D.-F., Barrett, R. A., O’Donoghue, P. E., Hyde, C. J., O’Dowd, N. P., and Leen, S. B. (2016). Micromechanical Finite Element Modelling of Thermo-Mechanical Fatigue for P91 Steels. Int. J. Fatigue 87, 192–202. doi:10.1016/j.ijfatigue.2015.11.025
Liu, Y., Zhang, X., Zhu, Y., Hu, P., and Oskay, C. (2020). Dislocation Density Informed Eigenstrain Based Reduced Order Homogenization Modeling: Verification and Application on a Titanium Alloy Structure Subjected to Cyclic Loading. Model. Simul. Mat. Sci. Eng. 28 (2), 025004. doi:10.1088/1361-651x/ab602e
Liu, Y., Zhu, Y., Oskay, C., Hu, P., Ying, L., and Wang, D. (2018). Experimental and Computational Study of Microstructural Effect on Ductile Fracture of Hot-Forming Materials. Mater. Sci. Eng. A 724, 298–323. doi:10.1016/j.msea.2018.03.049
Lütjering, G. E. R. D. (1998). Influence of Processing on Microstructure and Mechanical Properties of (α+ β) Titanium Alloys. Mater. Sci. Eng. A 243 (1-2), 32–45. doi:10.1016/s0921-5093(97)00778-8
Madec, R., Devincre, B., and Kubin, L. P. (2002). From Dislocation Junctions to Forest Hardening. Phys. Rev. Lett. 89 (25), 255508. doi:10.1103/physrevlett.89.255508
Mahadevan, S., and Haldar, A. (2000). Probability, Reliability and Statistical Method in Engineering Design. New York, United States: John Wiley & Sons.
Maruschak, P. O., Chausov, M. G., Konovalenko, I. V., Yasnii, O. P., Panin, S. V., and Vlasov, I. V. (2020). Effect of Shock and Vibration Loading on the Fracture Mechanisms of a Vt23 Titanium Alloy. Strength Mater. 52 (2), 252–261. doi:10.1007/s11223-020-00172-z
McBagonluri, F., Akpan, E., Mercer, C., Shen, W., and Soboyejo, W. O. (2005). An Investigation of the Effects of Microstructure on Dwell Fatigue Crack Growth in Ti-6242. Mater. Sci. Eng. A 405 (1-2), 111–134. doi:10.1016/j.msea.2005.05.097
McDowell, D. L., and Dunne, F. P. E. (2010). Microstructure-sensitive Computational Modeling of Fatigue Crack Formation. Int. J. fatigue 32 (9), 1521–1542. doi:10.1016/j.ijfatigue.2010.01.003
Mechanical Properties Data Center Traverse City Mich (1972). Aerospace Structural Metals Handbook, Vol. III. Columbus, OH: Defense Technical Information Center. URL: https://books.google.com/books?id=Y45vSwAACAAJ.
Mecking, H., and Kocks, U. F. (1981). Kinetics of Flow and Strain-Hardening. Acta metall. 29 (11), 1865–1875. doi:10.1016/0001-6160(81)90112-7
Miao, J., Pollock, T. M., and Jones, J. W. (2012). Microstructural Extremes and the Transition from Fatigue Crack Initiation to Small Crack Growth in a Polycrystalline Nickel-Base Superalloy. Acta Mater. 60 (6-7), 2840–2854. doi:10.1016/j.actamat.2012.01.049
Naka, S., Lasalmonie, A., Costa, P., and Kubin, L. P. (1988). The Low-Temperature Plastic Deformation of α-titanium and the Core Structure of A-type Screw Dislocations. Philos. Mag. A 57 (5), 717–740. doi:10.1080/01418618808209916
Owolabi, G. M., Prasannavenkatesan, R., and McDowell, D. L. (2010). Probabilistic Framework for a Microstructure-Sensitive Fatigue Notch Factor. Int. J. Fatigue 32 (8), 1378–1388. doi:10.1016/j.ijfatigue.2010.02.003
Ozturk, D., Kotha, S., and Ghosh, S. (2021). An Uncertainty Quantification Framework for Multiscale Parametrically Homogenized Constitutive Models (Phcms) of Polycrystalline Ti Alloys. J. Mech. Phys. Solids 148, 104294. doi:10.1016/j.jmps.2021.104294
Phan, V.-T., Zhang, X., Li, Y., and Oskay, C. (2017). Microscale Modeling of Creep Deformation and Rupture in Nickel-Based Superalloy IN 617 at High Temperature. Mech. Mater. 114, 215–227. doi:10.1016/j.mechmat.2017.08.008
Pilchak, A. L., Porter, W. J., and John, R. (2012). Room Temperature Fracture Processes of a Near-α Titanium Alloy Following Elevated Temperature Exposure. J. Mater Sci. 47 (20), 7235–7253. doi:10.1007/s10853-012-6673-y
Przybyla, C. P., and McDowell, D. L. (2010). Microstructure-Sensitive Extreme Value Probabilities for High Cycle Fatigue of Ni-Base Superalloy In100. Int. J. Plast. 26 (3), 372–394. doi:10.1016/j.ijplas.2009.08.001
Przybyla, C. P., and McDowell, D. L. (2011). Simulated Microstructure-Sensitive Extreme Value Probabilities for High Cycle Fatigue of Duplex Ti-6Al-4V. Int. J. Plast. 27 (12), 1871–1895. doi:10.1016/j.ijplas.2011.01.006
Qiu, J., Ma, Y., Lei, J., Liu, Y., Huang, A., Rugg, D., et al. (2014). A Comparative Study on Dwell Fatigue of Ti-6Al-2Sn-4Zr-xMo (X = 2 to 6) Alloys on a Microstructure-Normalized Basis. Metall Mat Trans A 45 (13), 6075–6087. doi:10.1007/s11661-014-2541-5
Quey, R., Dawson, P. R., and Barbe, F. (2011). Large-scale 3d Random Polycrystals for the Finite Element Method: Generation, Meshing and Remeshing. Comput. Methods Appl. Mech. Eng. 200 (17-20), 1729–1745. doi:10.1016/j.cma.2011.01.002
Sangid, M. D., Maier, H. J., and Sehitoglu, H. (2011). An Energy-Based Microstructure Model to Account for Fatigue Scatter in Polycrystals. J. Mech. Phys. Solids 59 (3), 595–609. doi:10.1016/j.jmps.2010.12.014
Sansoz, F., and Ghonem, H. (2003). Effects of Loading Frequency on Fatigue Crack Growth Mechanisms in α/β Ti Microstructure with Large Colony Size. Mater. Sci. Eng. A 356 (1-2), 81–92. doi:10.1016/s0921-5093(03)00112-6
Shen, W., Soboyejo, W. O., and Soboyejo, A. B. O. (2004). An investigation on fatigue and dwell-fatigue crack growth in ti–6al–2sn–4zr–2mo–0.1 si. Mech. Mater. 36 (1-2), 117–140. doi:10.1016/s0167-6636(03)00035-8
Sieniawski, J., Ziaja, W., Kubiak, K., and Motyka, M. (2013). “Microstructure and Mechanical Properties of High Strength Two-phase Titanium Alloys,” in Titanium Alloys-Advances in Properties Control, 69–80. doi:10.5772/56197
Sinha, V., Mills, M. J., and Williams, J. C. (2004). Understanding the Contributions of Normal-Fatigue and Static Loading to the Dwell Fatigue in a Near-Alpha Titanium Alloy. Metall Mat Trans A 35 (10), 3141–3148. doi:10.1007/s11661-004-0058-z
Tong, V., Joseph, S., Ackerman, A. K., Dye, D., and Britton, T. B. (2017). Using Transmission Kikuchi Diffraction to Characterise α Variants in an α+β Titanium Alloy. J. Microsc. 267 (3), 318–329. doi:10.1111/jmi.12569
Tschopp, M. A., Bartha, B. B., Porter, W. J., Murray, P. T., and Fairchild, S. B. (2009). Microstructure-dependent Local Strain Behavior in Polycrystals through In-Situ Scanning Electron Microscope Tensile Experiments. Metall Mat Trans A 40 (10), 2363–2368. doi:10.1007/s11661-009-9938-6
Viguier, B., Hemker, K. J., Bonneville, J., Louchet, F., and Martin, J.-L. (1995). Modelling the Flow Stress Anomaly in γ-TiAl I. Experimental Observations of Dislocation Mechanisms. Philos. Mag. A 71 (6), 1295–1312. doi:10.1080/01418619508244375
Waheed, S., Zheng, Z., Balint, D. S., and Dunne, F. P. E. (2019). Microstructural Effects on Strain Rate and Dwell Sensitivity in Dual-phase Titanium Alloys. Acta Mater. 162, 136–148. doi:10.1016/j.actamat.2018.09.035
Wang, X. G., Crupi, V., Jiang, C., and Guglielmino, E. (2015). Quantitative Thermographic Methodology for Fatigue Life Assessment in a Multiscale Energy Dissipation Framework. Int. J. Fatigue 81, 249–256. doi:10.1016/j.ijfatigue.2015.08.015
Whelan, G., and McDowell, D. L. (2020). Machine Learning-Enabled Uncertainty Quantification for Modeling Structure-Property Linkages for Fatigue Critical Engineering Alloys Using an ICME Workflow. Integr. Mater Manuf. Innov. 9 (4), 376–393. doi:10.1007/s40192-020-00192-2
Whelan, G., and McDowell, D. L. (2019). Uncertainty Quantification in Icme Workflows for Fatigue Critical Computational Modeling. Eng. Fract. Mech. 220, 106673. doi:10.1016/j.engfracmech.2019.106673
Wilson, D., and Dunne, F. P. E. (2019). A Mechanistic Modelling Methodology for Microstructure-Sensitive Fatigue Crack Growth. J. Mech. Phys. Solids 124, 827–848. doi:10.1016/j.jmps.2018.11.023
Yaghoobi, M., Stopka, K. S., Lakshmanan, A., Sundararaghavan, V., Allison, J. E., and McDowell, D. L. (2021). Prisms-fatigue Computational Framework for Fatigue Analysis in Polycrystalline Metals and Alloys. Npj Comput. Mater. 7 (1), 1–12. doi:10.1038/s41524-021-00506-8
Yeratapally, S. R., Glavicic, M. G., Argyrakis, C., and Sangid, M. D. (2017). Bayesian Uncertainty Quantification and Propagation for Validation of a Microstructure Sensitive Model for Prediction of Fatigue Crack Initiation. Reliab. Eng. Syst. Saf. 164, 110–123. doi:10.1016/j.ress.2017.03.006
Yeratapally, S. R., Glavicic, M. G., Hardy, M., and Sangid, M. D. (2016). Microstructure Based Fatigue Life Prediction Framework for Polycrystalline Nickel-Base Superalloys with Emphasis on the Role Played by Twin Boundaries in Crack Initiation. Acta Mater. 107, 152–167. doi:10.1016/j.actamat.2016.01.038
Yuan, F., Liu, C., Gu, H., Han, F., Zhang, Y., Ali, M., et al. (2019). Effects of Mechanical Polishing Treatments on High Cycle Fatigue Behavior of Ti-6al-2sn-4zr-2mo Alloy. Int. J. Fatigue 121, 55–62. doi:10.1016/j.ijfatigue.2018.12.003
Zecevic, M., and Knezevic, M. (2015). A Dislocation Density Based Elasto-Plastic Self-Consistent Model for the Prediction of Cyclic Deformation: Application to Aa6022-T4. Int. J. Plast. 72, 200–217. doi:10.1016/j.ijplas.2015.05.018
Zhang, X., and Oskay, C. (2015). Eigenstrain Based Reduced Order Homogenization for Polycrystalline Materials. Comput. Methods Appl. Mech. Eng. 297, 408–436. doi:10.1016/j.cma.2015.09.006
Zhang, X., and Oskay, C. (2018). Material and Morphology Parameter Sensitivity Analysis in Particulate Composite Materials. Comput. Mech. 62 (3), 543–561. doi:10.1007/s00466-017-1512-2
Zhang, X., and Oskay, C. (2021). Modeling and Numerical Investigation of Mechanical Twinning in β-HMX Crystals Subjected to Shock Loading. Model. Simul. Mat. Sci. Eng. 29 (7), 075009. doi:10.1088/1361-651x/ac21a6
Zhang, X., and Oskay, C. (2019). Plastic Dissipation Sensitivity to Mechanical Properties in Polycrystalline β-HMX Subjected to Impact Loading. Mech. Mater. 138, 103079. doi:10.1016/j.mechmat.2019.103079
Zhang, X., and Oskay, C. (2017). Sparse and Scalable Eigenstrain-Based Reduced Order Homogenization Models for Polycrystal Plasticity. Comput. Methods Appl. Mech. Eng. 326, 241–269. doi:10.1016/j.cma.2017.07.027
Zhang, Z., and Dunne, F. P. E. (2017). Microstructural Heterogeneity in Rate-dependent Plasticity of Multiphase Titanium Alloys. J. Mech. Phys. Solids 103, 199–220. doi:10.1016/j.jmps.2017.03.012
Keywords: titanium alloy, lamellar structure, fatigue nucleation, reduced order model, uncertainty quantification
Citation: Zhang X, Liu Y and Oskay C (2022) Uncertainty Quantification for Microstructure-Sensitive Fatigue Nucleation and Application to Titanium Alloy, Ti6242. Front. Mater. 9:897998. doi: 10.3389/fmats.2022.897998
Received: 16 March 2022; Accepted: 19 April 2022;
Published: 11 May 2022.
Edited by:
Anh Tran, Sandia National Laboratories (DOE), United StatesReviewed by:
Krzysztof Stopka, Purdue University, United StatesPavlo Maruschak, Ternopil Ivan Pului National Technical University, Ukraine
Copyright © 2022 Zhang, Liu and Oskay. This is an open-access article distributed under the terms of the Creative Commons Attribution License (CC BY). The use, distribution or reproduction in other forums is permitted, provided the original author(s) and the copyright owner(s) are credited and that the original publication in this journal is cited, in accordance with accepted academic practice. No use, distribution or reproduction is permitted which does not comply with these terms.
*Correspondence: Caglar Oskay, Y2FnbGFyLm9za2F5QHZhbmRlcmJpbHQuZWR1