 Pedro Sousa
 Stepan V. Lomov
 Jan Ivens2
95% of researchers rate our articles as excellent or good
Learn more about the work of our research integrity team to safeguard the quality of each article we publish.
Find out more
ORIGINAL RESEARCH article
Front. Mater. , 20 September 2022
Sec. Mechanics of Materials
Volume 9 - 2022 | https://doi.org/10.3389/fmats.2022.871235
This article is part of the Research Topic Mechanical Testing of Composite Precursors View all 7 articles
Experimental permeability measurements saw a considerable increase in accuracy when recommendations and guidelines were imposed upon the realization of two international benchmarks. Such requirements aid the design stage and experimental validation of a permeameter rig however, systematic errors in the measurements still compromise the comparability of measurements obtained by different radial permeameter rigs. Owing to hurdles and limitations in the data acquisition system, validation of the mold cavity and fluid injection system, optical errors in the visual tracking of a flow front, and uncertainties in the measurement of the fluid viscosity, the measurement’s accuracy is yet lower than the required for a standardized process. In this study, the detailed study and calibration of such parameters was able to identify and minimize error sources that would otherwise result in undetected systematic deviations from the expected results. In conclusion, the verification proposed by the radial benchmark does not guarantee the accuracy of the measurement, as the error in the instruments proposed for the verification is comparable to the requirements themselves. This creates a certain uncertainty in the verification that needs to be tackled with more detailed measurement protocols to ensure not only the compliance with the measurement requirements but also to set the limits of the attainable accuracy. The rig was validated by measuring the permeability of the fabric reinforcements used in the radial benchmark exercise. Due to the scattering in the results reported in the benchmark exercise, 13 out of the 19 reported values were excluded to obtain a good estimation of the expected permeability for each volume fraction. Although the rig complied with all recommendations currently in place, the obtained permeability showed a 20% deviation in the K1 direction, while the K2 was within the expected range for the average value. The observed deviation was later found to be caused by an optical distortion, which affected the measurement of the real-world flow front dimensions. A correction for this deviation needs further systematic investigation, also a possible revision of the future standard since a correction for optical distortions is yet not included in the measurement guidelines.
Liquid Composite Molding (LCM) is a widely popular technique for the manufacturing of composite materials. It comprises a large number of manufacturing processes with a common link: the impregnation of a fabric reinforcement. In all these processes, a textile reinforcement structure is placed inside a mold cavity in a defined orientation, compacted up to a pressure characteristic of the process, and impregnated with a thermoset resin, such as polyester or epoxy, or a reactive thermoplastic prepolymer. When injecting into a closed mold, such as in resin transfer molding (RTM), it is essential to place the inlet and outlet vents in the correct location according to the resin flow inside the mold to prevent the occurrence of dry spots. It is also important to inject with enough pressure to ensure the reinforcement impregnation without fiber washing. Numerical flow simulations based on finite elements can aid in the determination of these parameters; however, limitations in addressing the multi-scale flow during impregnation, capturing realistic fiber architectures, or the fabric stack deformation associated with compaction results in unrealistic permeability estimations and a wide scattering between permeability values derived from analytical models, numerical simulations, and experimental measurements (Karaki et al., 2017). Predicted permeability values are commonly validated by comparison with experimental results since experimentally measured permeability reflects the unpredictability of the real environment conditions, namely the characteristic variability of the fibrous reinforcements that are difficult to simulate. For that reason, the accuracy of a validation depends on the quality of the input parameters such as the fabrics compaction response or the preform permeability in a real process (Siddig et al., 2018). While accurate experimental permeability data is relevant for the achievement of satisfactory simulation results, this is also difficult to obtain. The literature is filled with permeability measurement methods and experimental results, however, misconceptions about the measurement procedure allied with parameters measured with a low precision create a mixture of human and systematic errors in the experimental results. These types of errors and experimental uncertainties, contrarily to random errors that are by definition uncontrollable, hence being eliminated by averaging a series of measurements, human errors and systematic errors can either increase variability compromising the measurement accuracy or create an uncontested bias in a systematic direction. The existence of such errors in experimentally measured permeability was made evident in 2011 with the first international permeability benchmark (Arbter et al., 2011). In this benchmark, permeability values from a total of 16 different experimental procedures, combining mainly linear and radial methods, showed a scatter between participants higher than one order of magnitude for the principal permeability values. This scatter level could not be explained by the natural variability in these types of measurements, but more importantly, it made it impossible to know the expected permeability values for the tested fabric. Years later the second and third benchmark exercises on linear unsaturated permeability (Vernet et al., 2014) and radial unsaturated permeability (May et al., 2019), respectively, tried to tackle the experimental errors with the elaboration of measurement guidelines. These guidelines were intended to solve misconceptions about the measurement procedure or inconsistencies in the specimen preparation, however the coefficient of variation (cv) in permeability values reported by different systems was 28% higher than the cv obtained by individual systems. The average individual cv is comparable to the characteristic variability found in textiles, which proves the guideline’s efficiency in improving reproducibility. However, the same guidelines cannot ensure the measurement’s accuracy and the comparability of results obtained by different systems, something essential for the future standardization of these tests. This happens because each input parameter in the permeability calculation has the potential to create a systematic deviation if not properly calibrated. For that reason, ensuring that the real cavity thickness corresponds to the desired cavity thickness, ensuring that the measured fluid viscosity is indeed correct, or the injection pressure corresponds to the required value remains the reason for under/overestimation permeability measurements. With accurate instrumentation and a robust methodology, the influence of experimental errors can be accounted for and minimized to a point where different systems produce comparable results under the same test method. This is an essential requirement for the elaboration of the measurement standard “ISO/CD 4410 Experimental characterization of in-plane permeability of fibrous reinforcements for liquid composite molding,” which is currently under development (ISO/CD “4410 Experimental characterization of in-plane permeability of fibrous reinforcements for liquid composite moulding” [Internet], 2022). As shown in this paper, when developing a radial permeameter rig (RPR) a calibration process is vital to ensure not only the compliance with the measurement requirements but also to determine the attainable accuracy with a certain configuration. The development stages of the RPR are presented with all error sources that were detected and how they affected the measurement’s precision.
The radial permeameter rig (RPR) in the KU Leuven was originally designed by the University of Auckland in New Zealand (Swery et al., 2016), and manufactured in Belgium based on the provided technical drawings. The RPR measures unsaturated in-plane permeability of any fabric reinforcement textile at any volume fraction up to a compaction pressure of 0.61 MPa. In this design, the thickness control is achieved by measuring the distance between compaction plates with laser sensors and automatically stopping the compaction process at the desired thickness.
The fabric reinforcements are compacted in a mold cavity constituted by a round aluminum plate, 250 mm in diameter, and a square glass plate (Herasil 102), with dimensions 300 × 300 mm. Both plates are 30 mm thick. The glass plate is placed on a supporting aluminum frame with a cavity 250 × 250 mm in its center, allowing to visualize and record the flow front progression through the glass plate. A digital camera, a Fujifilm xf10, is placed 160 mm below the glass plate visualizing an area of 200 × 140 mm. The alignment between plates is made by a self-alignment ball joint attached to the round plate. The ball joint allows free rotation, preventing translation in any direction. The plates align when pressed against each other without fabrics in the cavity. The alignment is then secured by locking the ball joint by means of a threaded clamp that compresses the bolt joint. Figure 1 shows a cut-out of the compaction plate with the ball joint connection and the placement of the glass plate in the supporting frame with the camera cavity below the plate. In terms of injection system, the round plate has an 11.5 mm injection hole drilled in the center. This hole is connected to the fluid inlet by a channel drilled inside the plate, also 11.5 mm in diameter. Close to the fluid inlet, in a T-junction, a temperature transducer from KA Sensors® measures the fluid temperature with an accuracy of ±0.02%. The injection system works with a constant and regulated pressure up to 5 bar (±1%), measured at the pressure pot with a calibrated manometer. As mentioned, the cavity thickness is not determined by a spacer frame, but by adjusting the position of the compaction plate in relation to the glass plate. The compaction plate is connected to a Universal testing machine (UTM) allowing to adjust the mold clearance at a constant displacement rate up to a pre-set pressure or thickness. The installation of a permeability rig in a UTM has the advantage of replicating the thickness-controlled nature of resin transfer molding (RTM), where the closing force of a mold is determined by the compaction response of a fabric stack. The combination between compressibility and permeability in a single test is relevant in simulations combining both processes, such as vacuum infusion (VI), because changes in the compaction response can easily be correlate with the measured permeability (Swery et al., 2016; Yenilmez et al., 2017; George et al., 2019). The UTM, an Instron 4,467, has a load cell capacity of 30 kN (±0.5%), and the cavity thickness is measured by three laser sensors, model CP08MHT80 with a resolution of 8 μm, linearity of 0.1% and a temperature drift <5 μm/°C. The laser sensors are installed in a half ring above the compaction plate, arranged in a circular disposition as shown in Figure 2. The arrangement with three laser sensors allows to define a plane on the compaction plate surface and monitor its parallelism with the glass plate within the allowable deflection tolerance of 2%. The zero-thickness point is set by registering the measured displacement when the compaction plates are pressed together at a pressure of 0.6 MPa. The machine compliance is registered in the full load range thus the zero-thickness point can be selected across the displacement range and subtracted from the measured displacement. The measured thickness is registered in function of load by a program written in LabVIEW®. The program is also responsible for thickness control by automatically stopping the compaction process when the pre-set cavity is detected by 2 of the three sensors.
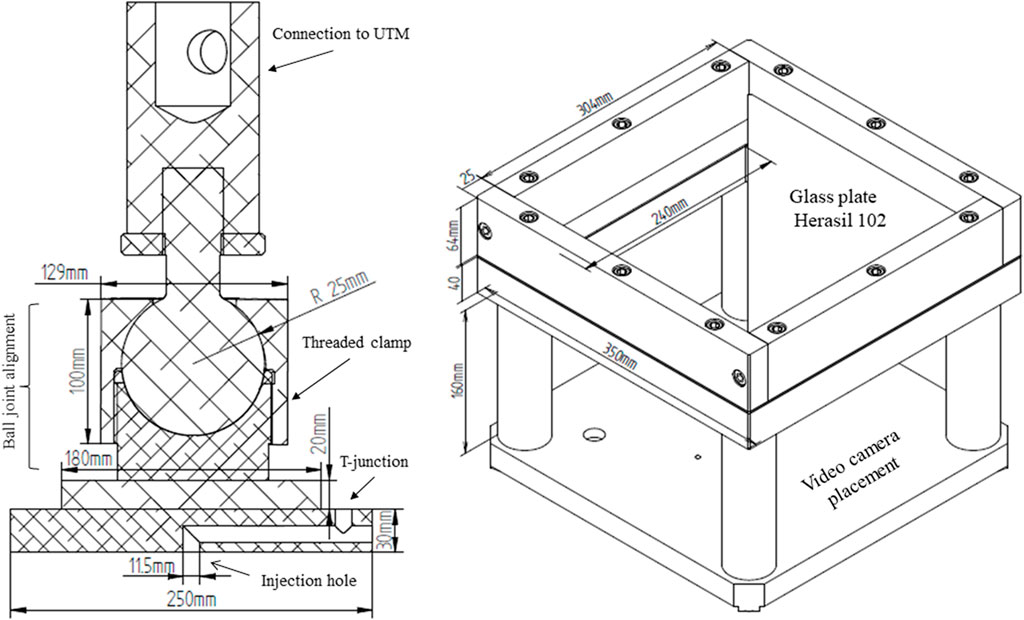
FIGURE 1. Upper assembly: Cut-out in the center of the compaction plate and ball join alignment. The compaction plate, a round plate 250 mm wide, 30 mm thick, contains the injection hole drilled in the center of the plate and a channel drilled inside the plate to connect with the injection system. Lower assembly: The glass plate is placed on a supporting frame with dimensions 350 × 350 mm, with a cut-out of dimensions 250 × 250 mm in the center to visualize the flow front progression with a digital camera. The glass plate is held in place by aluminum plates 25 mm wide screwed intro the supporting frame.
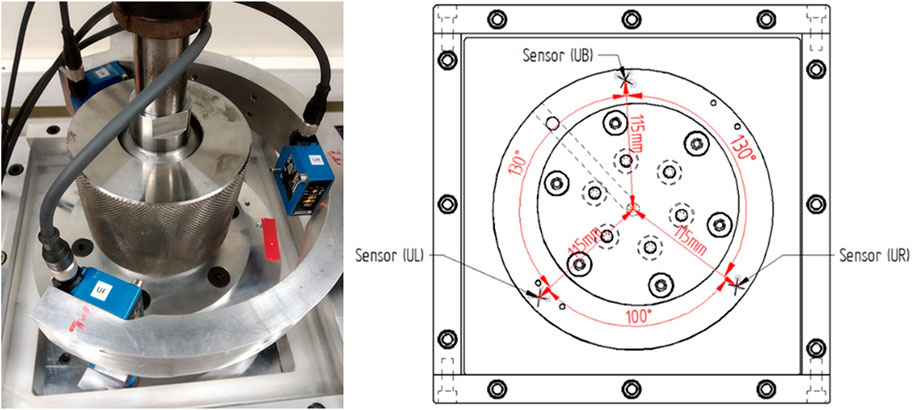
FIGURE 2. The cavity thickness is controlled by three laser sensors placed above the compaction plate.
While considerable preparatory work is required to meet all benchmark requirements, it is known that participants who did not follow all recommendations measured permeability values with higher variability and clearly deviated from the group results. These requirements are practical aspects related to the injection system, mold geometry and deflection limit, as well as the accuracy of data capture and sample preparation. Overall, all parameters with a direct influence in the permeability estimation must be verified to ensure not only the compliance with the current measurement requirements but also to set the limits of the attainable accuracy. This section presents the experimental methods used to test the radial benchmark requirements (May et al., 2019) and the limitations that were encountered in the fulfillment of these requirements.
The requirements concerning the injection at constant pressure are as follows: [1] constant and regulated inlet pressure with a deviation of not more than 2% of the nominal inlet pressure [2] The pressure vessel must be free of air leaks [3] A pressure sensor should be located as close as possible to the inlet and the injection pressure has to be recorded throughout the experiment with a sensor of accuracy <0.5% FS (full scale). In terms of fluid temperature, the requirement is [4] a continuous measurement with a sensor in the mold or in the tubing. The alternative is a temperature measurement in the reservoir before and after each test.
Requirements [1] and [2] were met by the assembly of the injection system. In this system, the pressure inside the pot is regulated and kept constant by a pressure regulator valve. The pressure inside the pot is measured with a calibrated manometer (±1%) connected to the air pressure tubing, see Figure 3. The pressure inside the pot was tested for air leaks by pressurizing the pot to 5 bar and monitored in the manometer for 15 min with the air inlet valve closed. No noise or pressure decrease was detected during this time. Also, during injection a small pressure decrease is easily compensated by the regulator valve. Thus, a constant pressure and regulated can be kept in the pressure pot within an accuracy of 1%.
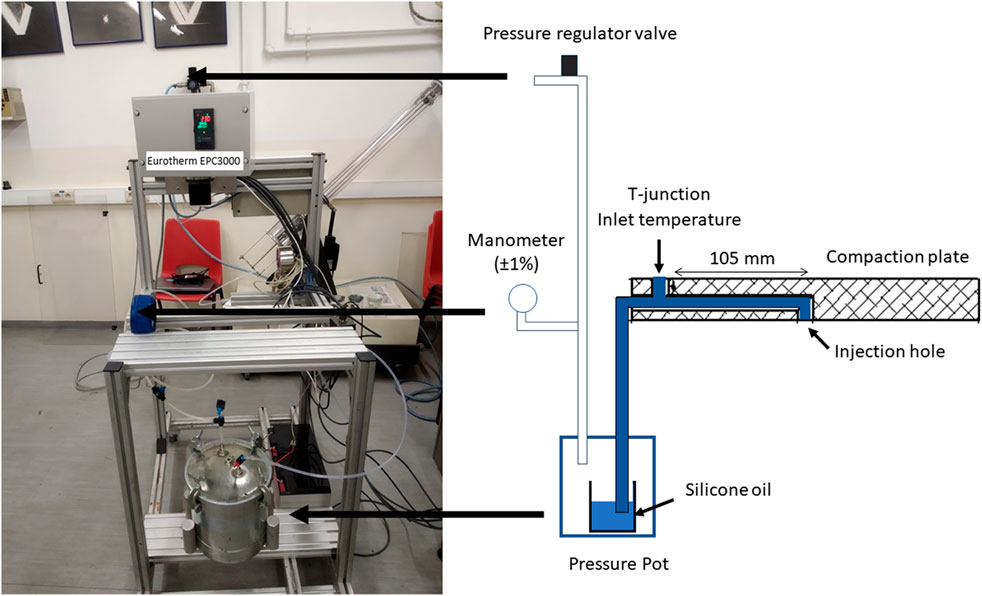
FIGURE 3. Fluid injection system. A pressure valve regulator allows to set the pressure inside the pressure pot with the aid of a calibrated manometer in the pressure tubing. This valve also keeps the set pressure constant by compensating small pressure decreases. In terms of temperature, a measurement is made at the compaction plate with a temperature sensor (2-Wire PT1000) at a T-junction in the compaction plate. The resistance value is converted into temperature by a Eurotherm EPC3000 programmable controller that also displays the temperature.
Requirement [3] was not achieved fully. A pressure measurement at the inlet measurement was not possible at this stage. In this study the fluid pressure used in the permeability calculation was assumed to be equal to the air pressure inside the pot, which might not be true due to pressure losses in the fluid tubing. In a further study a pressure measurement was added in the T-junction to track variations in the fluid pressure during injection.
For requirement [4] a temperature sensor (2-Wire PT1000) was installed in the compaction plate to measure the fluid temperature near the injection hole. The resistance (Ω) value is converted into temperature by a Eurotherm EPC3000 programmable controller that also displays the temperature. The temperature measured by the temperature sensor was checked by flushing silicone oil in the injection system. A recipient with silicone oil was placed inside the pressure pot and the pot was pressurized to 5 bar. The injection valve was open, and the fluid flowed towards the injection hole where it was collected in another recipient. Inside that recipient, a thermocouple type-k connected to a Fluke 50 Series II thermometer measured the oil temperature below the injection hole. The room temperature was measured in the vicinity of the mold before each measurement also with the thermocouple. Once the fluid ran out, the oil collected at the injection hole was returned to the pressure pot and the measurement repeated a total of four times.
In conclusion, the average oil temperature at the inlet and injection hole are in good agreement, see Figure 4. Both temperatures are also within the range of the room temperature. However, the thermocouple is 10 times less accurate than the sensor which does not allow to draw a strong conclusion regarding the agreement between temperatures or the temperature variations from one experiment to another. For that reason, the room temperature and the fluid temperature measured below the plate could be 0.56°C apart instead of 0.21°C if the extremes of the error bars are considered. The temperature sensor measured a stable temperature measurement over the four runs which proved the thermal stability of the fluid when circulating in the system.
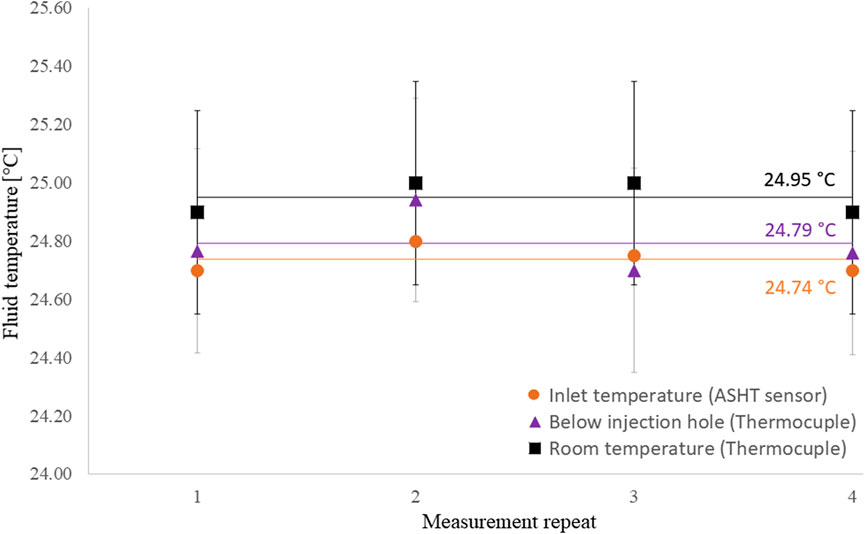
FIGURE 4. Verification of the temperature measured by the temperature sensor. The silicone oil temperature was measured at the inlet by the temperature sensors and below the injection hole by a thermocouple. The error bars represent the thermocouple accuracy (±0.002 x measured temp. + 0.3°C). Though the thermocouple is not as accurate as the sensor, the average temperature in both measurements (shown by the horizontal lines and values) is not significantly different and close to the room temperature value. The same silicone oil ran in the injection system a total of four times to assess if the fluid remains at room temperature.
Having a good measurement of the injection temperature is only half-way as the correspondent fluid viscosity also needs to be determined. The dynamic viscosity of the silicon oil was measured with an ARES-G2 rheometer from TA Instruments in a temperature range of +15°C to +40°C, rate of 1°C/min and a shear rate of 100 s−1. Three oil samples from the same production batch were tested to assess the consistency of the measurements.
The measured viscosity curves were compared with the viscosity/temperature curves obtained by other benchmark participants. The obtained curves, in dashed lines, are in good agreement with five out of the nine provided curves, see Figure 5. All measurements are carried out with oil from the same batch, however each curve was obtained by a different operator in a different institution. For that reason, the differences between curves might be related to differences in the device’s calibration or slight differences in the measurement procedures. Considering a temperature of 25°C, the average viscosity of the 3 measurements is 94.2 ± 0.5 mPa s which is in the same range as the average of the five curves 93.9 ± 0.5 mPa s, but considerably different for the remaining 4 curves average 90.9 ± 1.1 mPa s.
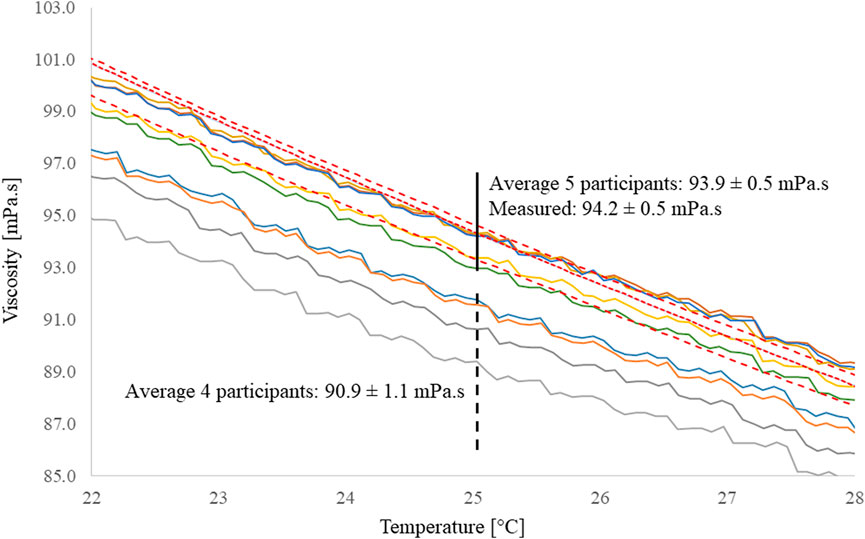
FIGURE 5. Viscosity curves for the silicone oil used in the measurements. The three curves in dashed line were obtained in this study, while the other nine curves were provided by the benchmark participants. At a temperature of 25°C, the average viscosity of the obtained measurements is 94.2 ± 0.5 mPa s which is in good agreement with the viscosity reported in five of the provided curves, 93.9 ± 0.5 mPa s, but considerably different for the remaining four curves average 90.9 ± 1.1 mPa s. The differences between curves are most likely due to different measurement protocols as the silicone oil is from the same batch.
The differences between curves obtained with different systems was also noticed in the benchmark exercise. These differences are not negligible, and they directly add to the permeability scatter between institutions. For that reason, the viscosity values used to calculate the permeability tensor should also be reported in addition to other test parameters to account for these differences.
Concerning the mold geometry, the guidelines require: [1] two rigid molding surfaces (metal, glass, PMMA, or similar), [2] maximum deflection during test <2% of nominal thickness, a fixed and uniform mold thickness validated using plasticine blocks. The nominal thickness refers to the cavity height at the start of the injection which must correspond to the target thickness within a tolerance of 2%. The mold surfaces are aluminum and glass; thus requirement [1] is fulfilled. The second requirement [2] was tested with plasticine blocks according to method proposed in the benchmark guidelines.
The method consists in placing plasticine blocks, liquid metal filler (metal epoxy), or a similar material in the tool cavity at five different locations, and then measuring the thickness of each block to determine the local cavity height. The test is performed first without fabrics in the cavity to assess the thickness accuracy, then with fabrics to account for the cavity deflection due to a compaction pressure. In this study, both tests were repeated five times. The proposed method does not take into account the deflection caused by the injection of a pressurized fluid during measurements. However, if the deviation from the target thickness is well below the 2% limit when the cavity is verified with fabrics, then the additional pressure of lower magnitude in relation to the compaction force is unlike to drive the deflection outside the allowable tolerance.
The placement of plasticine blocks in the cavity depends on the geometry and dimensions of the compaction plate. The RPR’s compaction plate has a diameter (D) of 250 mm, thus four of the blocks are placed 63 mm (D/4) from the injection hole in a square cross shape and block five is placed on the lower right-hand side of the injection hole. In the tests with and without fabrics, the average thickness measured at the five locations must be less than 2% of the target thickness to comply with the deflection requirement. Also, the thickness measured in each location cannot vary more than 2% in order to comply with the uniform mold thickness requirement. In the test with fabrics, holes 20 mm in diameter were punched into a 16-layer stack of the Twill fabric to create cavities where the plasticine blocks could be placed and easily removed from. The compaction to a thickness of 3 mm results in a fiber volume fraction of 61.7%, higher than the encountered in the permeability measurements since more fabric layers were compacted.
Before placing the blocks in the cavity, each block was rounded into an approximate diameter of 10 mm and wrapped in a layer of plastic film of thickness 8 µm to prevent the sticking to the compaction plates. After the spheres were placed on the glass plate, the cavity was closed at a constant displacement rate of 0.5 mm/min until a thickness of 3 mm was reached. At this moment, the plate movement is stopped, and it reverses at the same speed until the load cell registers no load. This process is done automatically using with the Instron’s crosshead actions. The signal to stop and revert the compression process is given by the DAQ when the target thickness is detected by the laser sensors. Finally, the height of each plasticine sphere was measured three times with an electronic caliper of accuracy ±20 µm without removing the plastic film. The caliper was closed with minimal force to avoid deforming the block, but at the same time ensuring full contact of the caliper jaws with the surface. However, this process is very dependent on the force used to close the caliper as it is difficult to have a good sensing. The average of the three measurements was registered in each of the five locations and the average block thickness was calculated for the overall cavity thickness. The same methodology was used in the measurement with fabrics; however, the plasticine spheres were placed inside the pre-cut holes in the fabric.
The average thickness in the five locations and the thickness measured in each location is in both cases within the permissible variation of ±60 µm for a cavity height of 3 mm. In the case of an empty cavity, the average of the five locations was 3.015 mm and with fabrics 3.034 mm, see Figure 6. The difference of 19 µm is contained within the accuracy of the measurement, and location five in the center of the mold does not show a thickness significantly higher than the average, thus the differences between both cases can be related with the accuracy of the thickness control method and not due to deflection. The error bars represent the caliper error (±20 µm) as the difference between the five measurements (average cv 0.3%) is less than the caliper error. The thickness measured in each of the 5-locations did not show any significant difference, thus only the average thickness is representative of the cavity accuracy. The cavity deflection lead to a deviation from the target thickness twice the normal deviation, however still within the permissible variation.
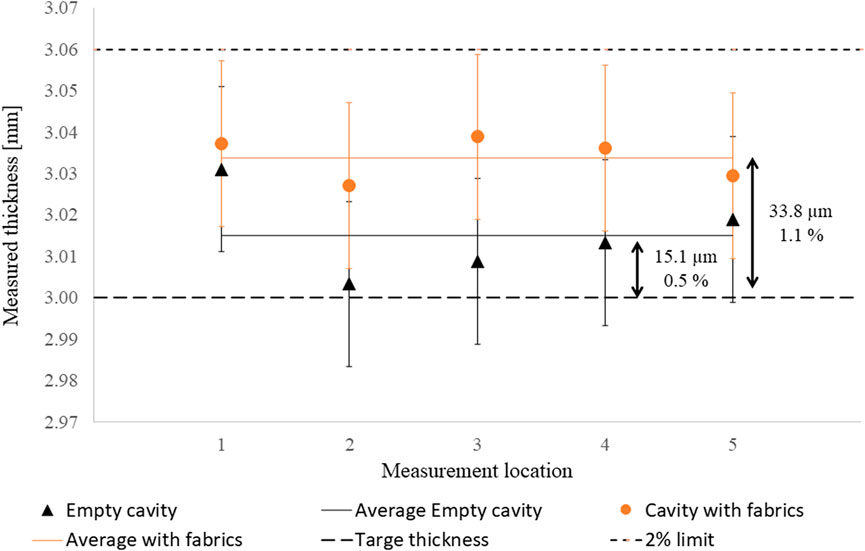
FIGURE 6. Thickness of the plasticine blocks in the five locations with an empty cavity and fabrics in the cavity. The average of the five location is represented by a horizontal line. The error bars represent the caliper error (±20 µm) as this error is larger than the difference between the five measurements (average cv 0.3%).
The cavity measurement with plasticine blocks has shown to be imprecise in the measurement of parallelism between plates as no significant differences were found between the five locations. However, the measurement is effective in detecting gross deviations from target cavity thickness. On the top of the uncertainty due to the instrumentation’s accuracy, other sources of error were found to affect the accuracy of the measurement. For instance, if the plastic film is not well stretched over the plasticine or if it overlaps, all imperfections in the plastic film will be imprinted on the plasticine surface. All these irregularities will make the caliper measurement less precise. Also, when the blocks were wrapped with a 150 µm thick paper, a lack of adhesion between the paper and the plasticine was observed, resulting in an overestimation of the block’s thickness. In average, each block was 161 ± 37 µm thicker when wrapped in paper than without paper. For that reason, the adhesion of the wrapping material with the plastic film has shown to have an influence in the measured thickness. When plastic film was used the same thickness was measured when the film was removed. With all the reservations on the measurement precision, the errors are well below the maximum deviation of 60 μm, stipulated by the 2% requirement.
When the cavity thickness was initially checked, the measured average thickness without fabrics was 3.15 ± 0.02 mm. This result could be interpreted as excessive plate deformation, however upon a closer examination of the thickness detection by the laser sensors, a relatively high AC content in the DC signal was noticed. An AC content in a DC signal causes the measured thickness to change in a per second basis making a reliable thickness measurement impossible.
A common strategy to deal with such signal fluctuations is the application of a running average. In a running average, a continuous signal is averaged in subset sizes of k elements resulting in a “new” averaged continuous signal. This method is commonly used in time series data, such as the voltage output of a sensor to smoothen short-term fluctuations and cancel out randomly distributed noise (Converter and Note, 2005). However, when a running average with a sub-set size of 800 was applied to a signal acquired with a sampling rate of 1,200 points/s, it was not effective in decreasing the noise below the rejection level, the sensor resolution, where it would not interfere with the thickness measurement.
The ripple of a power supply is one of the causes for an AC interference, however the linear power supply used in this setup, a E3620A from HP, has a ripple and noise lower than 1.5 mVpp (“peak-to-peak”). The interference source could then be external. After some investigation it was found that in the laboratory where the RPR is installed there are several heavy electrical equipment that “pollute” the power line with a non-sinusoidal voltage when switched on or off. When this voltage travels in the power line were the power supply is connected, it introduces voltage spikes in the DC output of the laser sensors since the quality of the output voltage is directly affected by the quality of the input voltage. When the amplitude of these interferences surpasses the noise rejection level, defined where at the sensor’s resolution level (1.6 mV), the measured thickness will show aperiodic fluctuations over a finite period of time, see Figure 7A. These interferences were detected by registering the sensor’s output voltage with the compaction plate held in place. On the other hand, if the noise levels are low enough to not cause interferences, the DC output, thus the measured thickness, will remain stable over time, see Figure 7B. This shows that the sensor’s output can be affected by external noise sources through the power supply, affecting the thickness measurement.
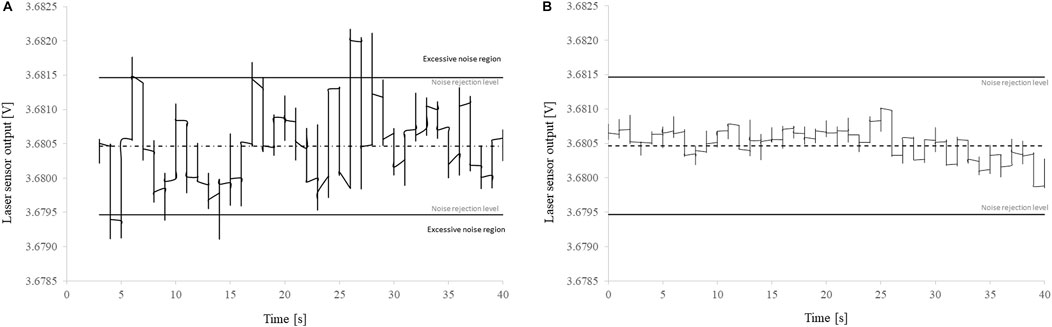
FIGURE 7. Laser sensor output. Both signals were averaged with a running average of sub-set size 800. The signal average is represented by a dashed line and the sensor’s resolution limit by a continuous line. (A) Without other electrical equipment’s working in the proximity, the noise level is effectively averaged below the sensor’s resolution. (B) With other equipment’s working in the proximity the existence of power surges and harmonics in the electrical power network affects the DC output of the laser sensors making the distance measurement oscillate with time.
Such results show the necessity to isolate the sensor’s power supply from the electrical power network by powering the sensors with batteries. This solution ensures the system stability trough the remotion of aperiodic voltage fluctuations caused by external electrical interferences. With a constant noise level, a running average can effectively reduce the noise to a level where it will not interfere with the thickness measurement. There are other ways to achieve isolation from external interferences, but this is the quickest way of doing it without increasing the complexity of electronic system.
It can be concluded that the RPR complies with all test requirements except the measurement pressure in the fluid line. The compliance with the measurement requirements has proved to be essential in obtaining reproducible results since they cover essential aspects for permeability measurements. However, it can be noticed that the errors in the measurement instruments proposed for the verification are almost as high as the requirements themselves creating a certain uncertainty in the verification. Also, the lack of a measurement protocol for the fluid viscosity measurement and cavity validation with plasticine blocks can further increase the uncertainty and lead to an erroneous validation. The proposed requirements can be further extended with the verification of interferences in the sensors output voltage. The existence of electrical interferences that surpass the admissible noise level has proved to undermine the performance of a sensor independently of its accuracy. The verification of these parameters must also be conducted on a regular basis to ensure the device’s stability.
The radial benchmark exercise (May et al., 2019) provides a set of reference permeability values for commercially available fabrics, obtained under specific guidelines tailored to minimize error sources and achieve maximum repeatability between measurement rigs. This allows to test the same materials and compare the obtained permeability values with the results obtained by other institutions. Such comparison with reference measurements is the most practical way to validate a measurement since deviations from the expected permeability can easily be identified. However, when testing a fabric from a different batch, the roving process will cause variability in the fiber structure which will be reflected in the measured permeability. The magnitude of these differences has not yet been reported in literature. In this case, the validation was conducted using one of the fabrics from the radial benchmark exercise in addition to the same injection fluid. These materials were received during the benchmark exercise, thus from the same batch as the materials tested by other benchmark participants. The preparation of materials and the test methodology followed the guidelines proposed in the radial permeability benchmark.
The fabrics used in the radial benchmark were a twill weave (2/2) glass fiber from Hexcel (01,102) with a nominal areal density of 295 g/m2, and a multi-axial non-crimp E-glass (NCF) woven fabric (+45°/−45°) with a nominal areal density of 444 g/m2. The fabrics geometry is described in detail in the benchmark publication (May et al., 2019). In this validation test only the twill (2/2) fabric was tested. Squared fabric samples with dimensions 270 × 270 mm (±2 mm) were cut from the fabric roll with fabric scissors and the production direction marked as the 0° direction. The manual cutting of a fabric might induce shearing to the textile structure and consequently affect permeability, thus other cutting methods such as stamping or cutting in a CNC might be preferable. The layers were carefully stacked with the same surface facing upwards and the 0° direction coincident. The number of layers in each stack followed the test procedure proposed by the benchmark organizers, see Table 1. Each fiber volume fraction was tested five times. The fabric stacks were placed on a 10 mm cardboard to minimize the handling in the next stages, mainly the fringe-out of fibers at the edges which affects the estimation of area density. The benchmark guidelines only require weighing each stack to determine the areal density based on the nominal sample areal. In this case the areal density was also calculated on a per layer basis by randomly selecting 30 fabric samples from each fabric type and measuring the surface area with a ruler and the weight of each layer with a Mettler AE 24 scale (accuracy ±0.1 g). An areal density of 290.0 ± 0.2 g/m2 was determined for the twill fabric and 451.0 ± 2.0 g/m2 were determined for the NCF. Both areal densities are within the expected deviation for an industrially manufactured textile and in good agreement with values reported by other benchmark participants.
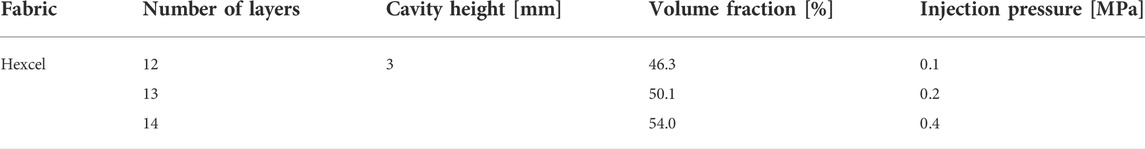
TABLE 1. Test procedure, adhering to the benchmark requirements (May et al., 2019).
The preparation of the injection system and the rig involves ensuring that all components are in thermal equilibrium, so that the fluid viscosity will remain constant when flowing from the pressure pot to the cavity. The injection fluid, silicon oil Xiameter® PMX-200 100cS from Dow Corning, is placed in the vicinity of the mold 24 h prior to testing and the injection system is moved into the testing room to equilibrate the temperature inside the pressure pot to room temperature. For that same reason, the assembly with the compaction plates is also installed in the Instron the day prior the tests.
The test method is divided into 8 stages:
The compaction plates are pressed together at a constant displacement rate of 0.5 mm/min up to a load of 25 kN (0.51 MPa). When the maximum pressure is reached, the crosshead stops, and the ball joint is locked by rotating the threaded clamp that compresses it. The parallelism between compaction plates is maintained under the condition that the compaction load during tests does not surpasses the ball joint locking force. However, this procedure bares the risk of calibrating the setup at a higher deformation level since the zero-thickness point is also registered at this moment. To avoid an erroneous calibration, the displacement measured by the laser sensors is registered over the continuous loading up to 25 kN. This displacement is usually in the microns range since both compaction plates move at the same relative speed rate when pressed together. For this reason, the stack thickness can be directly with the laser sensors independently of the load level. The thickness measurement and calibration are performed accordingly to the most recent guidelines for compressibility of fabric reinforcements. After calibration the cavity is opened at the same displacement rate of 0.5 mm/min.
With the plates aligned and fixed, the compliance curves are registered. A compliance curve is a displacement versus load curve obtained prior to testing by pressing the compression plates together similar to the alignment process, however, the crosshead movement is reverted when the maximum load is reached. A new compliance curve starts when the load cell no longer detects load. A total of 10 compliance curves are obtained consecutively. The load is measured by the Instron’s load cell, but the displacement is measured both by the Intron’s crosshead and the laser sensors. From the set of 10 curves, at least the five last curves must overlap without noticeable difference. If the Instron compliance curves do not overlap the ball joint must be unscrewed and the alignment process repeated. However, if the Instron compliance are repeatable, but the laser sensors compliance curves not, then it is only necessary to replace the red tape where the sensors light is reflected from and clean the sensor lens. A stable and repeatable compliance is essential for the determination of a precise cavity height and to minimize the error in compression tests as it was shown in a previous publication (Sousa et al., 2020).
Silicon oil is placed in a plastic beaker cup and the oil temperature is measured with a thermocouple type k connected to a Fluke 50 Series II. The room temperature near the mold and the temperature inside the pot are also registered. The pressure pot is then closed with the plastic beaker inside and the air pressure inside the pot set accordingly to the injection pressures in the test procedure, see Table 1. A valve in the fluid injection line holds the fluid flow until the injection starts. Once the air pressure is set, the air inlet is closed, and the pressure inside the pot is monitored with the manometer to ensure that the pot is well sealed. If no air leaks can be heard or visualized in the manometer during a period of 10 min the injection system is ready.
The last step in the fabric’s preparation is the punching of a 12 mm cut-out for injection in the center of the fabric stack with a circular punch and a hammer. The stack is only removed from the cardboard sheet when placed in the cavity, at that moment the sheet is weighed and subtracted from the stack weight. The stack is manually placed in the center of the mold cavity and the compaction plate moved closer to the stack so that the cut-out in the fabric stack can be aligned with the injection hole in the compaction plate. This process is facilitated by the camera placed below the glass plate which allows to visualize the alignment of the injection hole and the fabric cut-out on a computer screen. The fabrics are 20 mm wider than the compaction plate to move the stack and align the injection holes more easily. The alignment of the injection holes is a very delicate process because the fabric layers can easily shift, distorting the injection hole. After aligned, the stack is compacted at a displacement rate of 0.5 mm/min until a thickness of 3 mm is achieved. The Instron will automatically stop when the target thickness is detected in two out of the three laser sensors. A relaxation time of 10 min is allowed and the temperature inside the fabric stack is measured.
The camera takes photos every 2 seconds, providing on average 15 flow front positions. The valve in the injection line is open and the saturation of the fabric stack begins. While oil flows in the stack, the injection temperature at the inlet sensor is registered every 10 s. The injection pressure is monitored with the manometer in the pressure pot to ensure that the pressure remains constant throughout the injection. The fluid flows inside the fabric stack until it reaches the edges of the area viewed by the camera. At that moment the injection valve is closed, and the cavity is opened at a displacement rate of 0.5 mm/min. The load and displacement measured by the Instron are recorded from the moment fabrics are compressed up to the decompression moment. After injection, the fluid temperature inside the saturated stack is measured with the thermocouple and compared with the temperature measured by the inlet sensor during injection.
After the injection, the pressure pot is depressurized, and the remaining oil is placed again in the vicinity of the mold. The pressure pot is closed and pressurized to flush any leftover oil from the injection tubes. Finally, the fabric stack is removed, and the cavity is clean with paper and ethanol to remove the fibers left behind.
The compliance measurements are repeated with a clean cavity. These curves must precisely overlap with the previous 10 curves to ensure that the plates remain aligned. If the compliance curves does not align with the previous, the error must be accounted for in the thickness measurement.
The in-plane permeability tensor is calculated with the Weitzenböck et al. algorithm, using a global method (Weitzenböck et al., 1999; Weitzenbock* and Shenoi PAW, 1998). The minor and major ellipse axis, the 45° with respect to the major axis, and the orientation angle of K1 (β) were measured with ImageJ considering a fixed ellipse-center at the injection point since the injection pressure is maximum at this point. The data points along the flow front are extracted are extracted accordingly to the method cited in (Fauster et al., 2019). The target injection pressure is considered for the calculations, and the fluid viscosity is determined based on the average temperature measured at the fluid inlet and calculated from the average measured viscosity curves.
The radial benchmark gathered permeability values (K1 and K2) and orientation angles of K1 (β) from a total of 19 participants using 20 systems. The results of the 19 participants comprise a dataset from which a group average and a standard deviation can be estimated for each fiber volumetric fraction. The commercial availability of the fabric materials used in the radial benchmark exercise allows to compare the obtained permeability values to those reported in the benchmark. The comparison allows to determine the accuracy of the measurements similarly to a calibration process. However, the relatively high variability in the group results makes difficult to identify the expected permeability for each fiber volume fraction. In the K1 direction the group’s average showed a coefficient of variation around 32 and 37%, for the lowest and highest volume fractions, respectively. In the K2 direction the coefficient of variation is 20% higher than the previous at the same fiber volume fractions. These values already exclude the one outlier measurement. Such coefficients of variation are in average 2.5 times higher than the average individual coefficient of variation, thus not representative of the actual fabric induced variability. For that reason, all measurements in the group cannot be considered equally valid when estimating the expected permeability at each volume fraction.
To lower the variability between results and narrow the region of interest, some results were excluded from the average calculation under certain criterions. The first exclusion criterion was the noncompliance with the 2% deflection requirement. The removal of these data points halved the number of valid measurements, however it had little effect on the group’s average. In the K1 direction the average only decreased by 7% for the lowest volume fraction and 10% for the highest. Some of the removed data points were within the cluster of results, particularly for the lower fiber volume fractions, while other values that complied with the cavity requirement are more than 30% below the average. To narrow even further the region of interest and arrive at the reference permeability values, the measurements that differ more than 30% from the average value were also removed. Finally, an average of seven measurements is considered and the average permeability is estimated. Table 2 summarizes the obtained average permeability values, the group average with the 18 participants without exclusions and the average of the measurements considered in the comparison with the reference permeability values. After stablishing the expected permeability value for each volume fraction and permeability direction, the measured average can be compared with the group average.
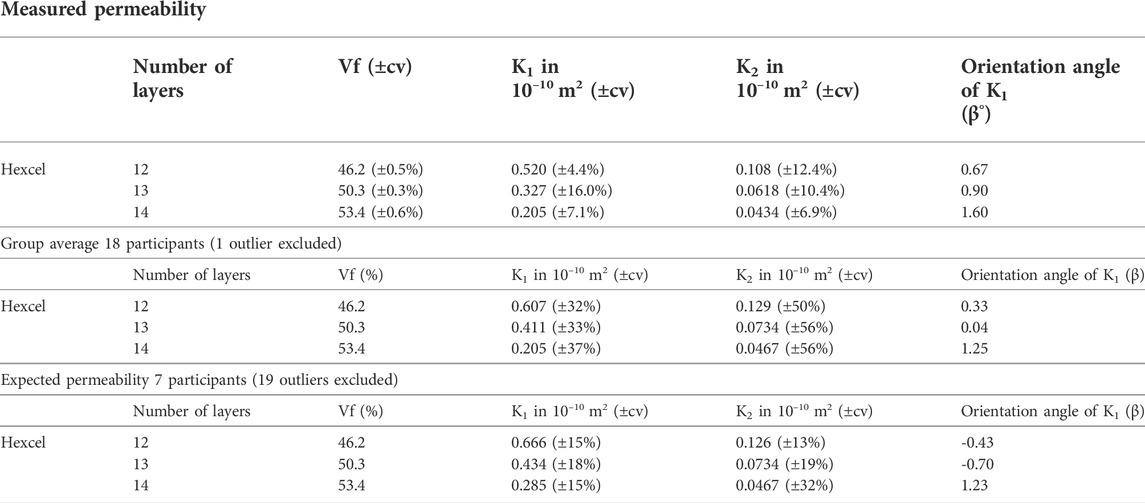
TABLE 2. Obtained K1 and K2 permeability directions and orientation angle of K1 for the measurements performed, average of the 18 participants and the expected permeability after removing all outlier measurements.
The comparison of results showed a measured K1 permeability 25% lower than the average for all volume fractions, while K2 is in good agreement with the average, see Figure 8. The reason for this deviation was correlated to an optical error in the measurement of the flow front positions. Optical distortions of some degree are present in all cameras lenses, either due to the shape of the lens or the alignment between lens and the camera sensor (Zhang, 2000). The camera lens was calibrated by measuring the length of physically straight lines in a graph paper. Both lines across the horizontal and vertical directions were measured to quantify the magnitude of the optical distortions caused by the camera lens, see Figure 9. The measured length in pixels was divided by the real-world length of the vertical and horizontal lines, 110 and 180 mm, respectively. The lines in the vertical direction, coincident with the main permeability direction (K1), showed an increasing pixels length when measured along the horizontal axis of the graph paper. When the flow front was initially measured, a constant conversion factor (pixel/mm) was used, however the observed differences in both directions do not allow to use a constant value in entirety of the image. The position changed camera throughout the measurements, thus it was not possible to apply a correction to the measured length posterior to the measurements or quantify its influence in the measured permeability. For that reason, it is advisable to fix the camera in a stable position throughout the measurements.
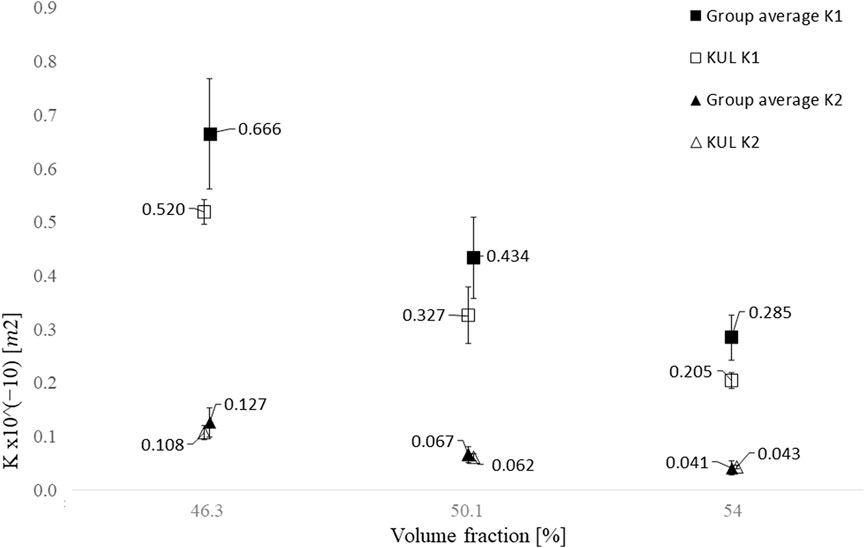
FIGURE 8. Comparison between the average K1 and K2 obtained in the measurements (KUL) and the group average estimated from the benchmark results (group average). Before calculating the group average, the results from participants who did not comply with the cavity deflection limit of 2% or reported permeability values that differ more than 30% from the average value were excluded. The error bars represent the results standard deviation. It is noticeable a good agreement for the K2 direction, less than 4%, however the difference in the K1 direction is 8 and 20% at the highest and lowest volume fractions, respectively. The differences in the K1 direction were attributed to an optical distortion in the flow front measurement.
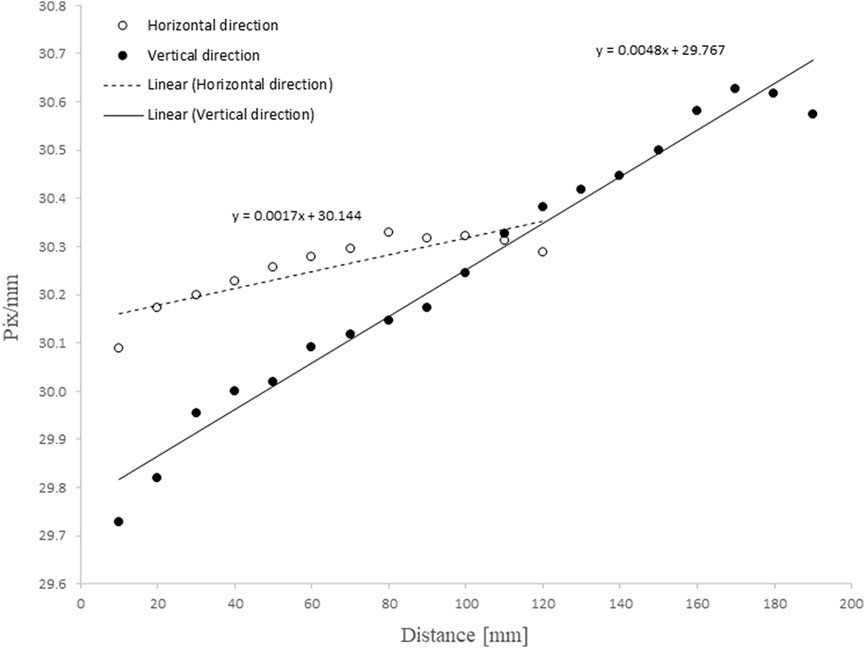
FIGURE 9. Physically straight lines in a graph paper were measured across the horizontal and vertical directions to quantify the magnitude of the optical distortions caused by the camera lens. The lines in the vertical direction, coincident with the main permeability direction (K1), showed an increasing pixels length when measured along the horizontal axis of the graph paper. These differences do not allow to use a constant conversion factor (pixel/mm) to the entirety of the image.
In terms of injection system, a temperature measurement in the oil reservoir before and after each measurement is mentioned in the measurement requirements as an alternative to a temperature sensor in the mold or in the tubing. However, during the measurements no differences were noticed when measuring these temperatures. On the other hand, the temperature measured in the saturated fabric stack immediately after opening the mold closely matched the temperature measured by the sensor in the fluid line. Thus, measuring the temperature of the saturated fabric stack is a better replacement for a temperature measurement in the fluid tubing.
It was also noticed that the laser sensors placement in the half rig compromises the thickness accuracy. This is because the half rig vibrates and moves slightly when the compaction plate moves. For that reason, the zero-thickness measurement had to be repeated multiple time between the measurements. On top of that, the fact that the sensors are placed at 50 mm from the compaction plate causes a linearity error of 50 µm which further increases the uncertainty in the thickness measurement. The combination of these situations caused the thickness accuracy to vary over time, see Figure 10. The thickness in each test was also calculated with an indirect thickness measurement method based on the measured machine’s displacement before and during compaction (Sousa et al., 2020). The measured thickness was always within the 2% limit, except for some laser sensors measurements, but relocating the sensors to a more stable position on the top of the compaction plate will result in a more stable thickness measurement.
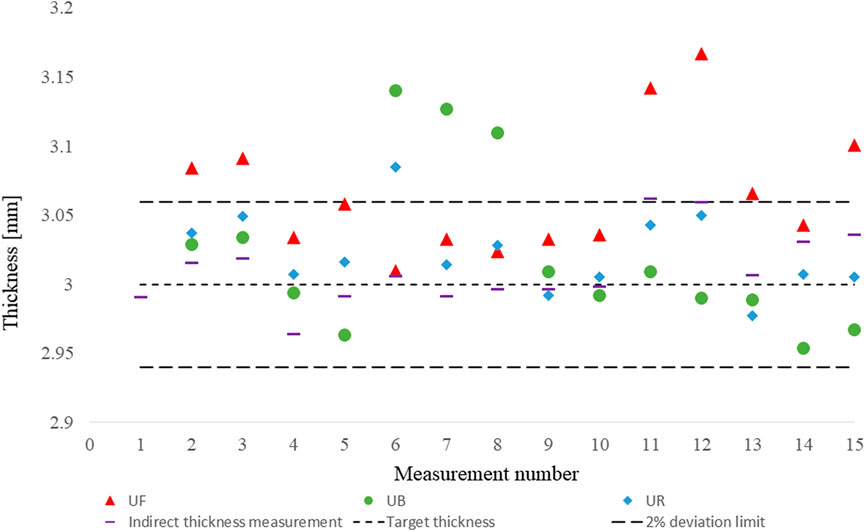
FIGURE 10. Recorded thicknesses during tests. UF(front), UR (right), and UB(back) are measured by the three laser sensors. The positions refer to the sensor’s location above the compaction plate. The indirect thickness measurement method uses the displacement measured by the Instron to calculate the distance between plates. The dashed lines represent the target thickness and the 2% deviation limit.
In conclusion, the obtained permeability values showed a relatively low coefficient of variation compared to the results reported by the benchmark participants. Such results prove the accuracy of the measuring device, however, the desired accuracy has not yet been achieved, since some improvements can still be made in the measurement of the stack thickness, flow front and injection pressure.
The realization of two international benchmarks on linear and radial unsaturated permeability allowed the elaboration of measurement guidelines and test requirements that effectively reduced the measurement error and improved the comparability between different systems. However, a robust measurement protocol with specific guidelines on equipment, measurement procedure and data analysis did not ensure the measurements accuracy. In this study, a radial permeability rig (RPR) was developed and tested accordingly to the most recent measurement requirements. Regarding the requirements checking prior to the testing, all requirements were complied with, except the requirement of a pressure measurement at the fluid inlet. It was found that the lack of a specific protocols regarding the instrumentation and measurement procedure can lead to certain uncertainty in the requirements verification. These guidelines will in the future be integrated into the measurement standard, thus their robustness can still be improved. Particularly the cavity measurement with plasticine blocks proved to not be a robust method since the measurement of the plasticine blocks thickness is dependent on the operator skill. Also, the method does allow to measure the additional deflection induced by the injection pressure during a measurement, which might be influential when the deflection under a compaction pressure is close to the 2% limit. For that reason, the usage of 3D Digital Image Correlation (DIC) in the measurement of the plate’s deflection will certainly improve the robustness of the method. The existence of sporadic electrical noise in the data acquisition system has shown to compromise the precision of the thickness measurement. Therefore, a verification of the sensors output should be included in the requirements prior to testing.
Following the verification of the measurement requirements, the permeameter rig was validated by testing the twill fabric reinforcement used in the benchmark exercise. The fabric and the injection fluid used were from the same batch as the tested by the radial benchmark participants. The same guidelines were followed to directly compare the obtained results with the benchmark reference. It is known that fabrics from different batches might not yield the exact same permeability due to differences in the roving process and fiber structure. Additional studies are necessary to quantify these differences. The comparison of the obtained permeability values with those reported by other benchmark participants allowed to detect a K1 permeability 25% lower than the average in all tested volume fractions, while K2 is in good agreement with the calculated average. Though the measurements precision is in good agreement with the precision reported by other participants, the accuracy was still compromised by an optical distortion in the camera lens not accounted for in the requirements. Given the fact that most cameras lens show optical distortion up to some degree, such verification must be included in the requirements for optical flow front measurements. Optical errors in flow front measurements were not yet mentioned in the literature, however they proved to significantly impact the measurement’s accuracy.
Overall, the benchmark guidelines and respective validation by repeating the benchmark measurements was successfully achieved with some limitations. The results report in the permeability benchmark clearly shows that certain parameters with a direct influence in the permeability measurement can lead to systematic errors in the permeability measurements. The validation process with benchmark guidelines and the comparison of permeability values obtained with the reference allowed the detection of an inaccuracy in the K1 direction that would be difficult to perceive without a reference for comparison. A better understanding of the scatter sources in a permeability measurement and their impact on the measurement’s accuracy is essential for the study of phenomena associated with fabric reinforcements, such as fabrics-induced variability, since the experimental induced variability can be considerably higher.
The datasets presented in this study can be found in online repositories. The names of the repository/repositories and accession number(s) can be found in the article/Supplementary Material.
PS: Methodology, Data analysis, Visualization Writing—original draft, and editing. SL: Project administration, Investigation, Writing—review, and editing. JI: Project administration, Investigation, Writing—review, and editing.
The work is part of a PhD funded by project PERMEA C2/16/24 accredited by the KU Leuven Research Council.
The authors express their gratitude to David May from IVW for the realization of the radial permeability benchmark and for supporting the benchmark participants. The contribution of Jurgen Daenen in obtaining a substantial part of the results presented is this paper is greatly acknowledge. The guidance and technical support provided by the Technology Campus De Nayer (KU Leuven)—Wouter Sas, Jie Zhang, Gonçalo Ferraz—and TU München—Kalle Kind, Maximilian Steinhardt, Mario Vollmer - was essential in the development stages and functioning of this permeameter rig.
The authors declare that the research was conducted in the absence of any commercial or financial relationships that could be construed as a potential conflict of interest.
All claims expressed in this article are solely those of the authors and do not necessarily represent those of their affiliated organizations, or those of the publisher, the editors and the reviewers. Any product that may be evaluated in this article, or claim that may be made by its manufacturer, is not guaranteed or endorsed by the publisher.
Arbter, R., Beraud, J. M., Binetruy, C., Bizet, L., Bréard, J., Comas-Cardona, S., et al. (2011). Experimental determination of the permeability of textiles: A benchmark exercise. Compos. Part A Appl. Sci. Manuf. 42 (9), 1157–1168. doi:10.1016/j.compositesa.2011.04.021
Converter, D., and Note, T. A. (2005). AVR121: Enhancing ADC resolution by oversampling microcontrollers [internet]. Available at: http://ww1.microchip.com/downloads/en/AppNotes/doc8003.pdf.
Fauster, E., Berg, D. C., Abliz, D., Grössing, H., Meiners, D., Ziegmann, G., et al. (2019). Image processing and data evaluation algorithms for reproducible optical in-plane permeability characterization by radial flow experiments. J. Compos. Mat. 53 (1), 45–63. doi:10.1177/0021998318780209
George, A., Hannibal, P., Morgan, M., Hoagland, D., and Stapleton, S. E. (2019). Compressibility measurement of composite reinforcements for flow simulation of vacuum infusion. Polym. Compos. 40 (3), 961–973. doi:10.1002/pc.24770
ISO/CD “4410 Experimental characterization of in-plane permeability of fibrous reinforcements for liquid composite moulding” [Internet] (2022). [cited 2022 Feb 6]. Available at: https://www.iso.org/standard/79944.html.
Karaki, M., Hallal, A., Younes, R., Trochu, F., Lafon, P., Hayek, A., et al. (2017). A comparative analytical, numerical and experimental analysis of the microscopic permeability of fiber bundles in composite materials. Int. J. Compos Mater [Internet 7 (3), 82–102. Available from: https://www.researchgate.net/publication/317603743.
May, D., Aktas, A., Advani, S. G., Berg, D. C., Endruweit, A., Fauster, E., et al. (2019). In-plane permeability characterization of engineering textiles based on radial flow experiments: A benchmark exercise. Compos. Part A Appl. Sci. Manuf. 121, 100–114. doi:10.1016/j.compositesa.2019.03.006
Siddig, N. A., Binetruy, C., Syerko, E., Simacek, P., and Advani, S. (2018). A new methodology for race-tracking detection and criticality in resin transfer molding process using pressure sensors. J. Compos. Mat. 52 (29), 4087–4103. doi:10.1177/0021998318774829
Sousa, P., Lomov, S. V., and Ivens, J. (2020). Methodology of dry and wet compressibility measurement. Compos. Part A Appl. Sci. Manuf. 128, 105672. doi:10.1016/j.compositesa.2019.105672
Swery, E. E., Allen, T., Comas-Cardona, S., Govignon, Q., Hickey, C., Timms, J., et al. (2016). Efficient experimental characterisation of the permeability of fibrous textiles. J. Compos. Mat. 50 (28), 4023–4038. doi:10.1177/0021998316630801
Vernet, N., Ruiz, E., Advani, S., Alms, J. B., Aubert, M., Barburski, M., et al. (2014). Experimental determination of the permeability of engineering textiles: Benchmark II. Compos. Part A Appl. Sci. Manuf. 61, 172–184. doi:10.1016/j.compositesa.2014.02.010
Weitzenbock*, J. R., and Shenoi Paw, R. A. (1998). Radial flow permeability measurement. Part B: Application. Compos Part A [Internet], 30, 797–813. Available at: https://www.reuters.com/article/us-saudi-oil-tax/saudi-arabia-sweetens-huge-aramco-ipo-with-tax-cut-idUSKBN16Y1AG.
Weitzenböck, J. R., Shenoi, R. A., and Wilson, P. A. (1999). Radial flow permeability measurement. Part A: Theory. Compos. Part A Appl. Sci. Manuf. 30 (6), 781–796. doi:10.1016/s1359-835x(98)00183-3
Yenilmez, B., Caglar, B., and Sozer, E. M. (2017). Pressure-controlled compaction characterization of fiber preforms suitable for viscoelastic modeling in the vacuum infusion process. J. Compos. Mat. 51 (9), 1209–1224. doi:10.1177/0021998316685164
Keywords: in-plane permeability, fabrics/textiles, liquid composite molding (LCM), resin infusion molding, unsaturated flow, radial benchmark exercise
Citation: Sousa P, Lomov SV and Ivens J (2022) Hurdles and limitations for design of a radial permeameter conforming to the benchmark requirements. Front. Mater. 9:871235. doi: 10.3389/fmats.2022.871235
Received: 07 February 2022; Accepted: 05 September 2022;
Published: 20 September 2022.
Edited by:
Stephen Hallett, University of Bristol, United KingdomReviewed by:
Ralf Schledjewski, University of Leoben, AustriaCopyright © 2022 Sousa, Lomov and Ivens. This is an open-access article distributed under the terms of the Creative Commons Attribution License (CC BY). The use, distribution or reproduction in other forums is permitted, provided the original author(s) and the copyright owner(s) are credited and that the original publication in this journal is cited, in accordance with accepted academic practice. No use, distribution or reproduction is permitted which does not comply with these terms.
*Correspondence: Pedro Sousa, cGVkcm8uc291c2FAa3VsZXV2ZW4uYmU=
Disclaimer: All claims expressed in this article are solely those of the authors and do not necessarily represent those of their affiliated organizations, or those of the publisher, the editors and the reviewers. Any product that may be evaluated in this article or claim that may be made by its manufacturer is not guaranteed or endorsed by the publisher.
Research integrity at Frontiers
Learn more about the work of our research integrity team to safeguard the quality of each article we publish.