 Liancong Wang
 Weizhao Hu
 Yuan Hu*
94% of researchers rate our articles as excellent or good
Learn more about the work of our research integrity team to safeguard the quality of each article we publish.
Find out more
ORIGINAL RESEARCH article
Front. Mater. , 11 March 2022
Sec. Polymeric and Composite Materials
Volume 9 - 2022 | https://doi.org/10.3389/fmats.2022.865248
This article is part of the Research Topic Fire Risk and Prevention Technologies of Polymeric and Composite Materials View all 5 articles
As the coal with the highest degree of coalification, anthracite is usually regarded as a mixture composed of organic and inorganic substances, with the characteristics of polymers and composites. It is very important to study the oxidation and spontaneous combustion characteristics of anthracite for the thermal properties of coal-based polymers and composites. Anthracite exhibits varying oxidation and spontaneous combustion characteristics at various stages of the oxidation and spontaneous combustion process, which cannot be fully demonstrated by the coal temperature alone. As a result, this paper develops an online method for characterizing the RGB values of infrared thermal images. The variation of the RGB value of an infrared thermal image during the oxidation and spontaneous combustion of anthracite was investigated. The findings show that there is a clear relationship between R (red), G (green), B (blue), RGB (red/green/blue) values, and coal temperature during the oxidation and spontaneous combustion of anthracite. The R and the G value curves each have one characteristic peak and two characteristic valleys in the experiment. However, the overall change range of the G value curve is relatively small; the B value curve has two characteristic peaks and one characteristic valley. There are no characteristic peaks and valleys in the RGB value curve, despite the influence of experimental instruments and the experimental environment.
From the perspective of polymer material science, anthracite, as the coal with the highest degree of coalification, is a natural blend composed of many complex polymers and inorganic minerals, and is an organic polymer hydrocarbon source which is difficult to be prepared by synthetic method. This determines that anthracite has great potential advantages in the development of coal based polymers and composites with unique properties (Ki and Wang, 2002; Wang, 2002; Wang et al., 2003; Jiang et al., 2004). The organic macromolecules in anthracite are composed of many structural units with similar structures. The core of these structural units are aromatic hydrocarbons with different degrees of condensation and some alicyclic and heterocyclic rings. The structural units are connected by oxygen bridge and methylene bridge, and they also have side chain alkyl, hydroxyl, carboxyl, methoxyl and other groups. Macromolecules are cross-linked into a network-like structure in three-dimensional space, and some small molecules are connected to it by hydrogen bonds or van der Waals forces (Yang et al., 2015; Qu et al., 2018; Chen et al., 2021; Zhang et al., 2021). In the study of coal-based polymers and composites, it is very important to study the oxidation and spontaneous combustion characteristics of anthracite. Relevant researchers have carried out some research work in this area (Zhang et al., 2015; Fan et al., 2019; Li et al., 2020; Vershinina et al., 2020; Xi et al., 2021).
Researchers usually use thermal analysis technology or self-built experimental heating devices to test the process and characteristics of coal oxidation and spontaneous combustion and to obtain macro-parameter information, such as temperature, products, and oxygen consumption (Qi et al., 2017; Huang et al., 2018; Li Jinhu et al., 2019a; Pan et al., 2020; Lu et al., 2021; Ma et al., 2021; Zhou et al., 2021). In recent years, with the development of new testing technologies, infrared spectroscopy, nuclear magnetic resonance, electron paramagnetic resonance, and quantum chemistry calculations have been gradually applied to various studies, and certain microscopic parameters have been obtained, such as the structure and distribution characteristics of functional groups, the species and concentration of free radicals in the process of coal oxidation, and spontaneous combustion (Tang et al., 2013; Li et al., 2016; Onifade and Genc, 2018; Li Qing-Wei et al., 2019; Chen et al., 2019; Wu et al., 2020; Liu et al., 2021a; Zhao et al., 2021). However, these technologies are still in their initial stages and need to be developed and improved. When studying the mechanism of coal oxidation and spontaneous combustion, offline testing methods and static testing methods can be used. However, to further study the critical transition characteristics of coal oxidation and spontaneous combustion, we must rely on online testing methods or in situ testing methods.
Consequently, an online infrared thermal imaging method was developed to characterize the critical transition characteristics of anthracite oxidation and spontaneous combustion. In this method, online infrared thermal imaging video information in the process of anthracite oxidation and spontaneous combustion is collected in real time to study the critical transition characteristics of coal oxidation and spontaneous combustion. The method does not directly analyze the collected online infrared thermal image video or image because only qualitative data can be obtained by analyzing the online infrared thermal image video or image. Quantitative data information cannot be accurately obtained, and the experimental requirements cannot be fulfilled. Also, if only the temperature information is analyzed, it is impossible to directly obtain the key data information, such as stage division and critical transition conditions of the coal oxidation spontaneous combustion process. Therefore, the online infrared thermal imaging video data, such as R-value, G-value, B-value, and RGB- value in the process of oxidation and spontaneous combustion of anthracite were collected simultaneously. These values are the three primary color values of the infrared thermal image. By analyzing the variations in the R-value, G-value, B-value, and RGB-value with the temperature or time, the critical transition process and transition characteristics of coal oxidation and spontaneous combustion are characterized. This method uses an online thermal infrared imager with the RGB acquisition function and an open heating device. The acquisition of all the related information, such as the R-value, the G-value, the B-value, the RGB-value, and temperature, can be completed using one experiment. The steps are simple, and the operation is convenient. The repeatability of the experimental data is good, and the data include the in situ information of coal from the room temperature to the end of the combustion process. The critical transition characteristics of anthracite oxidation and spontaneous combustion can be more accurately characterized.
The anthracite was acquired from Jincheng Lanyan Coal Mime Co. Ltd. The detailed information of anthracite were summarized in Tables 1–3.

TABLE 1. The data of industrial analysis of the coal sample.

TABLE 2. Ultimate analysis data of the coal sample.
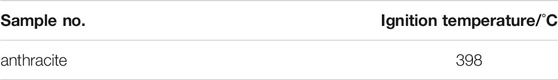
TABLE 3. The data of ignition temperature of the coal sample.
The composition analysis of the anthracite sample was performed by a 5E- SDLA618 Automatic Industrial Analyzer (Sande Instruments, China). The ultimate analysis of the anthracite sample was performed by using an Elemental Analyzer (Kaiyuan Instrument, China). The Infrared thermal imaging data of anthracite sample was investigated via a T650sc thermal infrared imager (Teledyne FLIR, Wilsonville, OR, United States). The ignition temperature of the coal sample was tested by a RD-6000 Ignition Point Tester (Hongke Instrument, China).
All these procedures were performed three times for the specimen.
Figure 1 shows the change law and fitting curves of the coal temperature with time.
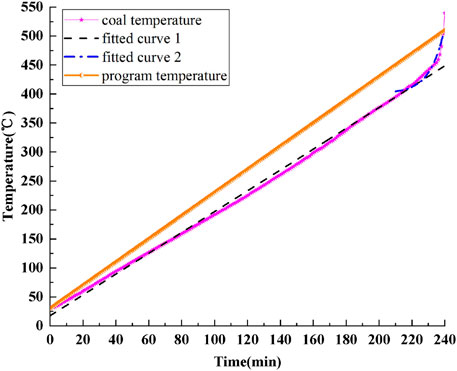
FIGURE 1. Program temperature, coal temperature and its fitting curves.
The program temperature was increased at an increase rate of 2°C/min. In the range of 30–454.2°C, the coal temperature has a linear relationship with the heating time (30–315°C) and an exponential function relationship (315–454.2°C).
(1) 30–315°C
The functional relationship corresponding to the fitting curve for the coal temperature is obtained as follows:
where y is the coal temperature (°C); x is the heating time of coal (min); A and B are dimensionless constants. For the anthracite sample selected in this experiment, A = 19.56621, and B = 1.77045. Therefore, the functional relationship between the coal temperature and time is given as follows:
Correlation coefficient: R = 0.99887.
(2) 315–454.2°C
The functional relationship corresponding to the fitting curve for the coal temperature is obtained as follows:
where y is the coal temperature (°C); x is the heating time of coal (min); A1 and t1 are dimensionless constants; and y0 is the initial temperature of the coal (°C). For the anthracite sample selected in this experiment, A1 = 8.46606 × 10⁻¹¹, t1 = 8.59127, and y0 = 400.97887. Therefore, the functional relationship between the coal temperature and time is given as follows:
Correlation coefficient: R = 0.97059.
Figure 2A is a curve showing the variations in coal temperature and R value with time. Figure 2B shows the changes in the coal temperature rise time and R value with coal temperature. Figure 2 clearly shows that the R value fluctuates in the process of coal oxidation and spontaneous combustion and shows obvious regularity.
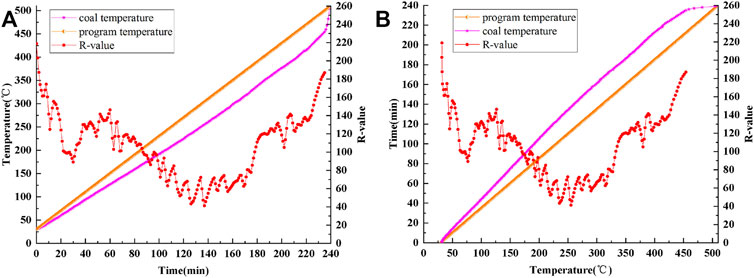
FIGURE 2. Curves of program temperature, coal temperature and R-value: (A) time-varying, (B) temperature-varying.
To intuitively analyze the corresponding relationship between the coal temperature and R value, the coal temperature is taken as the independent variable for analyzing the R value.
In the process of coal oxidation and spontaneous combustion, there is a certain corresponding relationship between the R value and coal temperature. Through polynomial fitting, the changes in the fitting curve of the R value with the coal temperature are obtained for the process of coal oxidation and spontaneous combustion (see Figure 3).
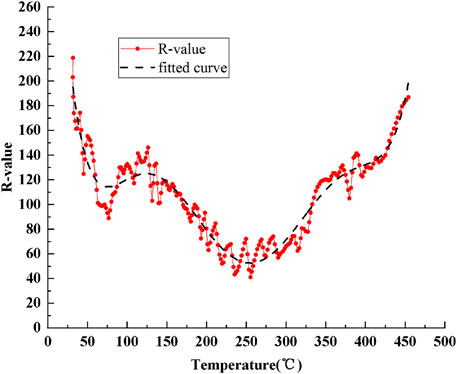
FIGURE 3. R-value curve and its fitting curve with temperature change.
The functional relationship between the R value and coal temperature is obtained as follows:
where y is the dimensionless R-value; x is the coal temperature (°C); A is a constant term; and B1, B2, B3, B4, B5, and B6 are coefficients.
For the anthracite sample selected in the experiment, the constant term is A = 497.3787; the coefficients are B1 = −15.47135, B2 = 0.2338, B3 = −0.00166, B4 = 5.90953 × 10⁻⁶, B5 = −1.01624 × 10⁻⁸, and B6 = 6.75969 × 10⁻¹². The R-value as a function of temperature is given as follows:
Correlation coefficient: R = 0.95807.
In summary, the change trend of the R value with the coal temperature can be divided into the following four stages:
Stage 1: 31.8–76.7°C.
In this stage, the R value decreases with the increase of coal temperature, from 218.82 to 88.99, thus reaching the first characteristic valley value, at which the corresponding temperature is 76.7°C.
Stage 2: 76.7–126.4°C.
In the 76.7–126.4°C range, the R value increases slightly and reaches the first characteristic peak value of 146.1 at 126.4°C.
Stage 3: 126.4–255.2°C.
In this stage, the R value shows a downward trend, from 146.1 to 41.11, thus reaching the second characteristic valley value, at which the corresponding temperature is 255.2°C.
Stage 4: 255.2–454.2°C.
The ignition temperature of the experimental coal sample is 398°C, which is within the 255.2–454.2°C range. In this stage, the R value shows an overall upward trend, but fluctuates slightly around 398°C. In other words, the R value first decreases from 131.62 (371.3°C) to 105.03 (379.8°C), then rapidly increases to 141.36 (389°C), then decreases to 129.47 (396.4°C), and finally rises to 186.86.
Figure 4A is a curve showing the variations in coal temperature and G value with time. Figure 4B shows the changes in the coal temperature rise time and G value with coal temperature.
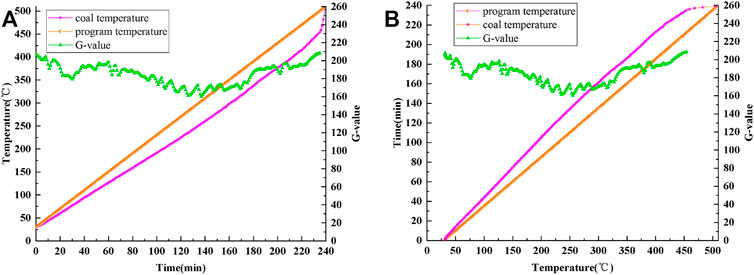
FIGURE 4. Curves of program temperature, coal temperature and G-value: (A) time-varying, (B) temperature-varying.
During the whole experiment, the maximum, minimum, average and median values of G are 208.43, 160.36, 184.83 and 87.29, respectively. The maximum, minimum, mean and median values of R are 218.82, 41.11, 106.92 and 110.82, respectively. G value shows a similar change pattern to R value, but the change amplitude of G value curve is smaller than that of R value curve, and the average and median values of G are also higher than that of R.
Figure 5A is a curve showing the variations in coal temperature and B value with time. Figure 5B shows the changes in the coal temperature rise time and B value with coal temperature. Figure 5 clearly shows that the B value fluctuates in the process of coal oxidation and spontaneous combustion and shows obvious regularity.
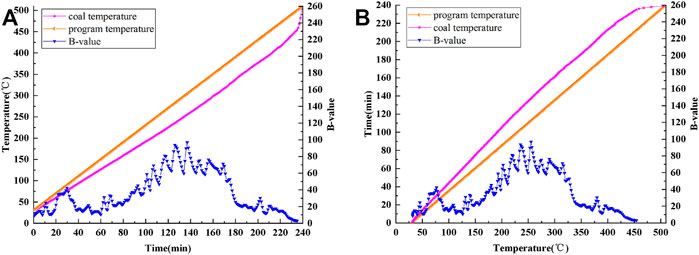
FIGURE 5. Curves of program temperature, coal temperature and B-value: (A) time-varying, (B) temperature-varying.
To intuitively analyze the corresponding relationship between the coal temperature and B value, the coal temperature is taken as the independent variable for analyzing the B value.
In the process of coal oxidation and spontaneous combustion, there is a certain corresponding relationship between the B value and coal temperature. Through polynomial fitting, the changes in the fitting curve of the B value with the coal temperature are obtained for the process of coal oxidation and spontaneous combustion (see Figure 6).
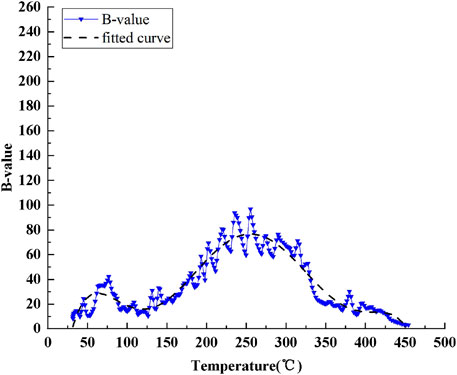
FIGURE 6. B-value curve and its fitting curve with temperature change.
The functional relationship between the B value and coal temperature is obtained as follows:
where y is the dimensionless B-value; x is the coal temperature (°C); A is a constant term; and B1, B2, B3, B4, B5, and B6 are coefficients.
For the coal sample selected in the experiment, the constant term is A = −146.85447; the coefficients are B1 = 8.00494, B2 = −0.13249, B3 = 9.92327 × 10⁻⁴, B4 = −3.60555 × 10⁻⁶, B5 = 6.23451 × 10⁻⁹, and B6 = −4.12402 × 10⁻¹². The B-value as a function of temperature is given as follows:
Correlation coefficient: R = 0.9489.
In summary, the change trend of the B value with the coal temperature can be divided into the following four stages:
Stage 1: 31.8–76.7°C.
In this stage, the B value increases with the increase of coal temperature, from 8.31 to 42.29, thus reaching the first characteristic peak value, at which the corresponding temperature is 76.7°C.
Stage 2: 76.7–126.4°C.
In the 76.7–126.4°C range, the B value decreases slightly and reaches the first characteristic valley value of 10.52 at 126.4°C.
Stage 3: 126.4–255.2°C.
In this stage, the B value shows an upward trend, from 10.52 to 96.81, thus reaching the second characteristic peak value, at which the corresponding temperature is 255.2°C.
Stage 4: 255.2–454.2°C.
The ignition temperature of the experimental coal sample is 398°C, which is within the 255.2–454.2°C range. In this stage, the B value shows an overall downward trend, but fluctuates slightly around 398°C. In other words, the B value first increases from 15.32 (371.3°C) to 30.27 (379.8°C), then rapidly decreases to 11.76 (389°C), then increases to 20.89 (396.4°C), and finally drops to 3.04.
To sum up, B value basically shows a change rule contrary to R value.
Figure 7A is a curve showing the variations in coal temperature and RGB value with time. Figure 7B shows the changes in the coal temperature rise time and RGB value with coal temperature. Figure 7 clearly shows that the RGB value fluctuates in the process of coal oxidation and spontaneous combustion and shows some regularity.
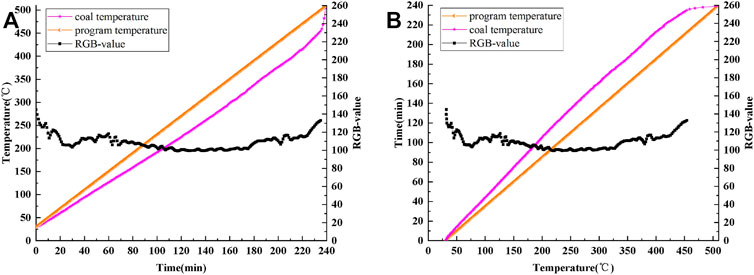
FIGURE 7. Curves of program temperature, coal temperature and RGB-value: (A) time-varying, (B) temperature-varying.
During the whole experiment, the maximum, minimum, average and median values of RGB are 132.78, 99.30, 108.88, and 107.91, respectively. The maximum, minimum, mean and median values of G are 208.43, 160.36, 184.83, and 187.29, respectively. RGB value shows a similar change pattern to G value, but the change amplitude of RGB value curve is smaller than that of G value curve, and the average and median values of RGB are also higher than that of G.
Figure 8A shows a curve of the coal temperature and the R value, G value, B value, and RGB value changing with time. Figure 8B shows a curve of the coal reaction time and the R value, G value, B value, and RGB value changing with the coal temperature. From Figure 8, it is clear that the R value, G value, B value, and RGB value have obvious change rules.
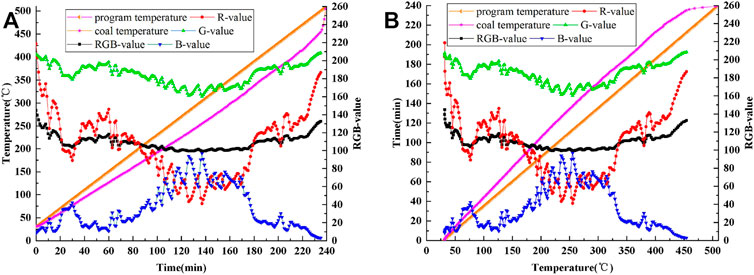
FIGURE 8. Curves of program temperature, coal temperature and R, G, B, RGB values: (A) time-varying, (B) temperature-varying.
In the whole experiment, from the viewpoint of temperature, there are one characteristic peak and two characteristic valleys in the R-value curve and G-value curve, respectively. However, the overall variation range of G-value curve is smaller than that of R-value. The B-value curve has two characteristic peaks and one characteristic valley. Considering the influence of the experimental instrument and environment, the RGB-value curve is deemed to have no peaks and valleys.
According to the characteristics of the R value, G value, B value, and RGB value changing with the coal temperature, the oxidation and spontaneous combustion process of anthracite is divided into the following five stages:
(1) Heat storage period: 30–92.2°C
The heat storage period is the initial preparation stage of coal oxidation and self-heating. The heat storage period of anthracite is longer. In the early stages of the heat storage, physical adsorption is the primary method, with chemical adsorption and chemical reaction serving as auxiliary methods. The gradual increase in temperature in the middle stage destroyed the van der Waals force between anthracite and the adsorbed gases, with some gases desorbed and released from the coal body. The chemisorption is obviously enhanced at a later stage, and unstable peroxides are produced (Wang and Liang, 2017; An et al., 2021). The experiment’s initial temperature is 30°C, so the corresponding temperature range of anthracite’s heat storage period is 30–92.2°C, and the critical characteristic temperature from the heat storage period to the self-heating critical period is 92.2°C.
(2) Critical period of heat storage and self-heating: 92.2–202.5°C
The critical period of heat storage and self-heating is the transition stage from the heat storage period to the self-heating period. The anthracite accelerates heat storage and self-heating during the critical period, and the R, G, and B values all change noticeably. (Wang et al., 2019; Wang et al., 2020a. The R value indicates a rapid decline, the G value indicates a slow decline, and the B value indicates a rapid upward trend. And then, at 202.5°C, the R and the B value curves intersect, and the system becomes self-heating. As a result, the temperature range corresponding to the critical period of anthracite heat storage and self-heating is 92.2–202.5°C. From the heat storage period to the heat storage-self-heating critical period, the critical characteristic temperature is 202.5°C.
(3) Self-heating period: 202.5–314.6°C
The self-heating period is a process in which the heat production of coal changes from being lower than the heat dissipation of the coal self-heating environment to being higher than the heat dissipation of the coal self-heating environment. This process can be regarded as an equilibrium process in which there is an overlap between the heat production process of coal and the heat dissipation process of the coal self-heating environment. Therefore, take the two intersection points of anthracite’s R and B value curves (corresponding to 202.5 and 314.6°C, respectively) as the temperature range of anthracite’s self-heating period, i.e., 202.5–314.6°C. During the self-heating period, the G value first decreased and then increased, revealing a characteristic valley value, and the corresponding anthracite temperature was 255.2°C. The heat production of coal is lower than the heat dissipation of the coal self-heating environment in the temperature range of 202.5–255.2°C, but the difference gradually decreases as the temperature rises. Near 255.2°C, the heat production and heat emission of coal are in balance, that is, the heat production of coal equals the heat dissipation of the coal self-heating environment; in the range of 255.2–314.6°C, the heat production of coal exceeds the heat dissipation of the coal self-heating environment, and the gap gradually widens with temperature increase (Liu et al., 2021b). As a result, the temperature range corresponding to anthracite’s self-heating period is 202.5–314.6°C, and the critical characteristic temperature of the self-heating period is 255.2°C.
(4) Critical period of self-heating and self-ignition: 314.6–379.8°C
The critical period of self-heating and spontaneous combustion is the transitional stage from the self-heating period to the spontaneous combustion period. At this stage, if the heat dissipation environment for coal oxidation and spontaneous combustion does not change, the coal will quickly enter the spontaneous combustion period. If the heat dissipation environment of coal oxidation and spontaneous combustion changes to a more conducive environment for heat dissipation, the coal will enter the cooling stage and then the weathering state. The spontaneous combustion tendency of coal is reduced, and it is difficult for self-heating to occur again. This paper deals only with the rapid entry of the coal into the spontaneous combustion period through this stage. During the critical period of self-heating and self-ignition, the R value rapidly increases from 62.5 to 131.6 (371.3°C) and then rapidly decreases to 105 (379.8°C). B value decreased from 71 to 15.3 (371.3°C) and then increased to 30.3 (379.8°C); G and RGB values change in the same way as the R values, but the change range is smaller. As a result, the temperature range for this process is 314.6–379.8°C. The temperature range is 314.6–371.3°C at the stage where of the R values rise and B values fall. Aromatic hydrocarbons, aliphatic hydrocarbons, oxygen-containing functional groups, and some small molecular substances in the anthracite molecular structure begin to crack, releasing small molecular volatiles, and promoting the spontaneous combustion process of coal. When the temperature rises above 371.3°C, the covalent bonds of macromolecular substances in anthracite begin to break and participate in the spontaneous combustion of coal. And lay a foundation for accelerating anthracite combustion in the next stage (Wang et al., 2020b). As a result, the temperature range corresponding to anthracite’s self-heating and self-ignition critical period is 314.6–379.8°C, and the critical characteristic temperature of the self-heating and self-ignition critical period is 371.3°C.
(5) Spontaneous combustion period: 379.8–454.2°C
The spontaneous combustion period is the stage of coal combustion (Wang et al., 2021; Xu et al., 2021). Under the experimental condition of 2°C/min temperature programmed heat source, the coal enters the spontaneous combustion period after 379.8°C; the coal temperature rises sharply and then begins to burn. From the beginning of the spontaneous combustion period to the end of the experiment, the coal temperature rises rapidly from 379.8 to 454.2°C. In this period, The R value curve fluctuates between 379.8 and 454.2°C, then drops to a minimum of 122.7 (396.4°C), and then rapidly rises. The B value curve shows a maximum value of 20.9 (396.4°C) after fluctuation, then rapidly decreases and approaches 0. The G, RGB, and R values show the same change rule, but the change range is smaller. Therefore, the critical temperature of anthracite spontaneous combustion period is 396.4°C.
The oxidation and spontaneous combustion characteristics of anthracite were studied using the infrared thermal image RGB-value characterization method. It is found that the R value, G value, B value, and RGB value in the infrared thermal imaging data have a correlation with the process of coal oxidation and spontaneous combustion, and the characteristics of coal oxidation and spontaneous combustion that cannot be accurately characterized by temperature can be characterized by the RGB-value online and in real time. Therefore, this paper reveals the variation law of the R-value, G-value, B-value, and RGB-value with the coal temperature. According to this law, the oxidation and spontaneous combustion process of anthracite is divided into five characteristic temperature intervals. The five intervals are the heat storage period (30–92.2°C), critical period of heat storage and self-heating (92.2–202.5°C), self-heating period (202.5–314.6°C), critical period of self-heating and self-ignition (314.6–379.8°C), and spontaneous combustion period (379.8–454.2°C), when the critical characteristic temperatures are 92.2°C, 202.5°C, 255.2°C, 371.3°C, and 396.4°C, respectively.
The raw data supporting the conclusion of this article will be made available by the authors, without undue reservation.
YH performed the project administration and carefully made the investigation. LW made the investigation and wrote the original draft, provided the methodology and formal analysis. WH revised the manuscript. All authors checked the manuscript.
This research was funded by the Natural Science Foundation of China (Grant No. 51774182), the National Science and Technology Major Project (No. 2016ZX05045006-004), the Science and Technology Innovation Fund of CCTEG (No. 2018MS014), and the Opening Research Fund of State Key Laboratory of Coal Mine Safety Technology (Grant Nos. SKLCMST101 and SKLCMST103).
The authors declare that the research was conducted in the absence of any commercial or financial relationships that could be construed as a potential conflict of interest.
All claims expressed in this article are solely those of the authors and do not necessarily represent those of their affiliated organizations, or those of the publisher, the editors and the reviewers. Any product that may be evaluated in this article, or claim that may be made by its manufacturer, is not guaranteed or endorsed by the publisher.
An, J., Zhang, J., and Ji, D. (2021). Research on Optimization of index Gas for Coal Spontaneous Combustion Based on Piecewise Fitting [J]. J. Saf. Sci. Tech. 17 (10), 25–31.
Chen, X., Ma, T., Ma, T., Zhai, X., Lei, C., and Song, B. (2021). Spontaneous Combustion Characteristics of Coal by Using the Simultaneous Thermal Analysis-Fourier Transform Infrared Spectroscopy Technique. Combustion Sci. Tech. 193 (6), 967–986. doi:10.1080/00102202.2019.1679124
Chen, X., Ma, T., Zhai, X., and Lei, C. (2019). Thermogravimetric and Infrared Spectroscopic Study of Bituminous Coal Spontaneous Combustion to Analyze Combustion Reaction Kinetics. Thermochim. Acta 676, 84–93. doi:10.1016/j.tca.2019.04.002
Fan, J., Wang, G., and Zhang, J. (2019). Study on Spontaneous Combustion Tendency of Coals with Different Metamorphic Grade at Low Moisture Content Based on TPO-DSC [J]. Energies 12 (20).
Huang, C-F., Huang, A-C., Zhao, J-Y., Deng, J., Min Shu, C., and Jou Wan, T. (2018). Microcosmic thermal Analysis of Coal Mixed with Oxides at Different Temperatures [J]. Int. J. Oil Gas Coal Tech. 18 (1-2), 239–254. doi:10.1504/ijogct.2018.091515
Jiang, Y., Li, K., and Zhou, A. (2004). Photoactivated Oxidization Properties of Shenfu Coal [J]. Coal Convers. 27 (4), 83–86.
Ki, K., and Wang, Q. (2002). Advances in thermal Conductive Polymeric Materials [J]. J. Funct. Mater. 33 (2), 136–141.
Li, J., Li, Z., Yang, Y., and Zhang, X. (2019). Study on the Generation of Active Sites during Low-Temperature Pyrolysis of Coal and its Influence on Coal Spontaneous Combustion. Fuel 241, 283–296. doi:10.1016/j.fuel.2018.12.034
Li, Q-W., Xiao, Y., Wang, C.-P., Deng, J., and Shu, C.-M. (2019). Thermokinetic Characteristics of Coal Spontaneous Combustion Based on Thermogravimetric Analysis. Fuel 250, 235–244. doi:10.1016/j.fuel.2019.04.003
Li, X., Jin, Z., Bai, G., Wang, J., Gao, F., and Linghu, J. (2020). Experimental Study on the Influence of Water Immersion on Spontaneous Combustion of Anthracite with High Concentrations of Sulfur-Bearing Minerals. J. Therm. Anal. Calorim. 141 (2), 893–903. doi:10.1007/s10973-019-09073-z
Li, Z., Kong, B., Wei, A., Yang, Y., Zhou, Y., and Zhang, L. (2016). Free Radical Reaction Characteristics of Coal Low-Temperature Oxidation and its Inhibition Method. Environ. Sci. Pollut. Res. 23 (23), 23593–23605. doi:10.1007/s11356-016-7589-x
Liu, C., Fu, L., Yang, J., Zhang, S., Shi, Y., Yang, F., et al. (2021a). A Novel Understanding of Combustion Behavior of Coals by Cone Calorimeter. J. Therm. Anal. Calorim. 143 (1), 139–150. doi:10.1007/s10973-019-09250-0
Liu, Z., Xu, Y., Wen, X.-l., Lv, Z., Wu, J., Li, M., et al. (2021b). Thermal Properties and Key Groups Evolution of Low-Temperature Oxidation for Bituminous Coal under Lean-Oxygen Environment. Acs Omega 6 (23), 15115–15125. doi:10.1021/acsomega.1c01338
Lu, W., Li, J., Li, J., He, Q., Hao, W., and Li, Z. (2021). Oxidative Kinetic Characteristics of Dried Soaked Coal and its Related Spontaneous Combustion Mechanism [J]. Fuel, 305.
Ma, L., Wang, Y., Wu, R., Ren, L., Zou, L., and Wu, R. (2021). Effect of Low Oxygen Concentrations on the Thermokinetics of Coal Combustion. Combustion Sci. Tech. 193 (11), 1903–1913. doi:10.1080/00102202.2020.1716342
Onifade, M., and Genc, B. (2018). Spontaneous Combustion of Coals and Coal-Shales. Int. J. Mining Sci. Tech. 28 (6), 933–940. doi:10.1016/j.ijmst.2018.05.013
Pan, R., Ma, J., Zheng, L., and Wang, J. (2020). Experimental Study on the Effects of Chemical Composite Additive on the Microscopic Characteristics of Spontaneous Combustion Coal. Environ. Sci. Pollut. Res. 27 (5), 5606–5619. doi:10.1007/s11356-019-07340-y
Qi, X., Li, Q., Zhang, H., and Xin, H. (2017). Thermodynamic Characteristics of Coal Reaction under Low Oxygen Concentration Conditions. J. Energ. Inst. 90 (4), 544–555. doi:10.1016/j.joei.2016.05.007
Qu, L., Song, D., and Tan, B. (2018). Research on the Critical Temperature and Stage Characteristics for the Spontaneous Combustion of Different Metamorphic Degrees of Coal. Int. J. Coal Preparation Utilization 38 (5), 221–236. doi:10.1080/19392699.2016.1226170
Tang, Y., Li, Z., Yang, Y., Song, N., and Ma, D. (2013). Oxidation Experiment of Coal Spontaneous Combustion Model Compounds. Asian J. Chem. 25 (1), 441–446. doi:10.14233/ajchem.2013.13151
Vershinina, K. Y. U., Dorokhov, V. V., Romanov, D. S., and Strizhak, P. A. (2020). Comparing the Ignition Parameters of Promising Coal Fuels. Process Saf. Environ. Prot. 139, 273–282. doi:10.1016/j.psep.2020.04.027
Wang, L., Hu, W., and Hu, Y. (2021). Influence of High Temperature Thermal Radiation on the Transition Characteristics of Coal Oxidation and Spontaneous Combustion [J]. Front. Mater., 8.
Wang, L., Liang, Y., Hu, Y., and Hu, W. (2020a). Synergistic Suppression Effects of Flame Retardant, Porous Minerals and Nitrogen on Premixed Methane/air Explosion [J]. J. Loss Prev. Process Industries 67, 104263. doi:10.1016/j.jlp.2020.104263
Wang, L., and Liang, Y. (2017). Spectral Analysis on Laws of Generation and Variability of CO during Oxygen-free Programmed Temperature of Coal [J]. J. China Coal Soc. 42 (7), 1790–1794.
Wang, L., Tawiah, B., Shi, Y., Cai, S., Rao, X., Liu, C., et al. (2019). Highly Effective Flame-Retardant Rigid Polyurethane Foams: Fabrication and Applications in Inhibition of Coal Combustion. Polymers (Basel) 11 (11). doi:10.3390/polym11111776
Wang, L., Yuan, B., Zhang, H., and Jiang, S. (2020b). Fundamental Investigation on the Effects of Ammonium Polyphosphate on Flame Propagation Behaviors of Starch Dust Deflagration. Powder Tech. 360, 411–420. doi:10.1016/j.powtec.2019.10.039
Wang, X. (2002). Study on the Sythesis and Influence Factors of Conductive Properties of Coal/polyaniline Composites [J]. Coal Convers. 25 (3), 70–74.
Wang, X., Zhou, A., and Li, K. (2003). Synthesis and Characterization of Sf Coal/Polyaniline Composities [J]. Coal Convers. 26 (4), 73–75.
Wu, Y., Zhang, Y., Wang, J., Zhang, X, Wang, J, and Zhou, C, (2020). Study on the Effect of Extraneous Moisture on the Spontaneous Combustion of Coal and its Mechanism of Action [J]. Energies (8), 13.
Xi, Z., Wang, X., Li, M., Wang, X., and Li, M. (2021). Characteristic Analysis of Pulverized Coal Combustion. Combustion Sci. Tech. 193 (9), 1605–1622. doi:10.1080/00102202.2019.1704282
Xu, T., Qi, J., Li, X., and Wu, Y. (2021). Heat Effect of Oxidation of Aliphatic Hydrocarbon Groups on the Piecewise Characteristics and Spontaneous Combustion Tendency of Coal. Solid Fuel Chem. 55 (5), 338–347. doi:10.3103/s0361521921050098
Yang, Y., Li, Z., Li, Z., Tang, Y., Fanjun, G., Ji, H., et al. (2015). Effects of Low Molecular Weight Compounds in Coal on the Characteristics of its Spontaneous Combustion. Can. J. Chem. Eng. 93 (4), 648–657. doi:10.1002/cjce.22157
Zhang, J., Wang, J., Zhang, C., Li, Z., Lu, B., and Zhu, J. (2021). Molecular Simulation of C2H4/CO2/N-2/O-2 Adsorption Characteristics in lignite and Anthracite [J]. Aip Adv. 11 (8).
Zhang, W., Jiang, S., Hardacre, C., Goodrich, P., Wang, K., Shao, H., et al. (2015). A Combined Raman Spectroscopic and Thermogravimetric Analysis Study on Oxidation of Coal with Different Ranks. J. Anal. Methods Chem. 2015, 306874. doi:10.1155/2015/306874
Zhao, J., Wang, W., Fu, P., Wang, J., and Gao, F. (2021). Evaluation of the Spontaneous Combustion of Soaked Coal Based on a Temperature-Programmed Test System and In-Situ FTIR [J]. Fuel, 294. doi:10.1016/j.fuel.2021.120583
Keywords: oxidation and spontaneous combustion, anthracite, three-primary colors, infrared ray imaging, RGB value
Citation: Wang L, Hu W and Hu Y (2022) Study on the Change Law of Red-Green-Blue Values of Infrared Thermal Image in the Process of Anthracite Oxidation and Spontaneous Combustion. Front. Mater. 9:865248. doi: 10.3389/fmats.2022.865248
Received: 29 January 2022; Accepted: 15 February 2022;
Published: 11 March 2022.
Edited by:
Wei Wu, City University of Hong Kong, Hong Kong SAR, ChinaReviewed by:
Bihe Yuan, Wuhan University of Technology, ChinaCopyright © 2022 Wang, Hu and Hu. This is an open-access article distributed under the terms of the Creative Commons Attribution License (CC BY). The use, distribution or reproduction in other forums is permitted, provided the original author(s) and the copyright owner(s) are credited and that the original publication in this journal is cited, in accordance with accepted academic practice. No use, distribution or reproduction is permitted which does not comply with these terms.
*Correspondence: Yuan Hu, eXVhbmh1QHVzdGMuZWR1LmNu
Disclaimer: All claims expressed in this article are solely those of the authors and do not necessarily represent those of their affiliated organizations, or those of the publisher, the editors and the reviewers. Any product that may be evaluated in this article or claim that may be made by its manufacturer is not guaranteed or endorsed by the publisher.
Research integrity at Frontiers
Learn more about the work of our research integrity team to safeguard the quality of each article we publish.