 Ziruo Yu
 Weizhi Liang
 Yue Wang
94% of researchers rate our articles as excellent or good
Learn more about the work of our research integrity team to safeguard the quality of each article we publish.
Find out more
ORIGINAL RESEARCH article
Front. Mater., 18 March 2022
Sec. Structural Materials
Volume 9 - 2022 | https://doi.org/10.3389/fmats.2022.857874
This article is part of the Research TopicMulti-Scale Investigation on Fiber-Reinforced Composite Materials: From Structural Design, Property Characterization to Engineering ApplicationsView all 9 articles
The tensile strength, crack behavior, and strain-hardening properties of ultra-high-performance concrete (UHPC) are mainly affected by the steel fibers distributed in the matrix. In this study, a mesoscopic model of UHPC was established using a numerical simulation method to study the effects of steel fibers on the crack propagation and tensile properties of UHPC. First, the exponential cohesive model was used to simulate the pull-out of a fiber embedded in a UHPC matrix. Then, the distribution and variation of the interfacial shear stress during the fiber pull-out process were obtained, and the UHPC fiber-pull-out load–displacement curve was obtained. Using the Monte Carlo method, a meso-scale finite element model of UHPC was established by modeling randomly distributed steel fibers in the UHPC matrix. After verification, the model was used to study the effects of fiber characteristics, interface strength, and matrix strength on the crack propagation path and tensile properties of UHPC. The results showed that the exponential cohesive constitutive model with a softening coefficient of –1 can effectively characterize the mechanical behavior of the interface between the steel fibers and matrix in UHPC. Affected by the random distribution of fibers, the main propagation mode of cracks in UHPC was that the cracks bypassed the fiber-dense area and extended to the fiber-sparse area, and the crack propagation path was mainly affected by the fiber distribution. The distribution of fibers significantly affected the tensile strength and peak strain of UHPC. When the fiber inclination angle was in the range of 15°–30°, the comprehensive tensile properties of UHPC were the best. With increasing fiber volume fraction and fiber length, UHPC gradually began to exhibit multi-cracking and strain hardening (when the fiber volume fraction was more than 2.5% or fiber length was more than 15.5 mm). The interface strength and matrix strength had little effect on the crack propagation path, but had significant effects on the tensile strength and toughness of the UHPC. The higher the strength of the UHPC matrix, the more fully the anti-cracking effect of the steel fiber that can be achieved.
Ultra-high-performance concrete (UHPC) is a new type of reinforced cementitious composite material with an optimized gradation of ultrafine particles mixed with fibers (Shi et al., 2015). The tensile and compressive strengths, toughness, and energy dissipation capacity of UHPC are significantly higher than those of ordinary concrete (Yoo and Banthia, 2017). The excellent mechanical properties of UHPC can be attributed to the addition of ultra-high-strength steel fibers, because the fibers effectively restrict the crack width, extend the crack propagation path, and reduce the stress concentration at the crack tips. The adhesion, friction, and mechanical anchoring force improve the toughness of the matrix, and these must be overcome when the fibers are pulled out. (Zhao et al., 2015; Pyo et al., 2016). However, the tensile performance of UHPC is relatively worse than its supercompressive performance, mainly because the bonding surface of the steel fiber and the UHPC matrix is weak. When the distribution or geometric characteristics of the fiber or the strength of the fiber–matrix interface changes, the friction and mechanical anchoring force between the fiber and matrix will change, which affects the mechanical properties of UHPC. Therefore, the strengthening and toughening mechanism of steel fibers in UHPC, as well as the effects of the steel fiber and matrix properties on the crack propagation and mechanical properties of UHPC, need to be investigated further.
In general, previous studies (Yin, 2014; Deng and Feng, 2016; Peng et al., 2016) on the effects of fibers on UHPC, macroscopically, have considered that the role of fibers is to increase the tensile strength and toughness of the matrix. The mechanism behind the effects of fibers has not been studied separately, and the effects of the fiber distribution and geometric characteristics on the mechanical properties of UHPC have not been elucidated. Therefore, using a mesoscopic method to study the behaviors of fibers in UHPC would be more appropriate. The most commonly used mesoscopic method is similar to that of Qi et al. (Qi et al., 2018) and Xu et al. (Xu et al., 2016), who used a fiber pull-out test to understand the properties of interface between the fiber and the matrix. However, because the fiber diameter is very small (typically ∼0.2 mm), a high-precision test instrument is required; thus, the test data are largely dispersed, and this method cannot reflect the synergistic effects of multiple randomly distributed fibers in UHPC. Abrishambaf et al. (Abrishambaf et al., 2019) used the mechanics of composite materials to analyze the crack resistance mechanism of multiple fibers and deduced the softening curve of UHPC, which can reflect the crack resistance effect of the fibers. However, the softening curve is complex and exhibits difficulty in converging in numerical simulations. Furthermore, methods based on fiber spacing theory and mechanics of composite materials (Malena et al., 2016) typically assume that the stress distribution at the fiber–matrix interface is uniform; thus, they cannot reflect the effects of the fiber distribution or geometric characteristics on UHPC crack propagation or other mechanical properties. Therefore, when using numerical simulation methods to establish a mesoscopic model of UHPC, the meso-characterized fibers in UHPC can more accurately represent the behavior of the fiber–matrix interface. To a certain extent, this approach can compensate for the shortcomings of physical experiments and theories, as well as clarify the effects of the fiber and matrix characteristics on the crack propagation and mechanical properties of UHPC.
In the mesoscopic method of directly modeling steel fibers, fibers are generally represented by discrete rod, beam, or truss elements. The main idea of this method is to select an appropriate constitutive relationship to characterize the interaction between the fiber and matrix. Leung et al. (Leung and Li, 1992) used a beam element and spring element to simulate the fiber and matrix, respectively. The damage to the matrix was represented by the stiffness degradation of the spring element, but the bonding effect between the fiber and matrix was not considered. Tsai et al. (Tsai et al., 2015) used two types of contact elements to represent interfacial bonding and interfacial friction, and simulated the pull-out process of straight fibers and tapered-end fibers; however, they did not consider the fiber or matrix damage. Ellis et al. (Ellis et al., 2014) established an interfacial transition zone (ITZ) to characterize the interaction between the fiber and matrix, but the ITZ model requires a very small mesh size to ensure the accuracy of the simulation. Montero et al. (Montero-Chacón et al., 2017) proposed a grid–particle model to characterize the interface, in which the fiber node and the nearest matrix node are connected by spring elements—this model considered the bridging effect between coarse aggregates as well. The accuracy of this model depends on the grid size of the matrix; if the grid is very large, the interaction between the fiber and the matrix cannot be characterized correctly. Cunha et al. (Cunha et al., 2012) used the embedded binding method to simulate a concrete matrix with a smeared crack model and the slip between the fiber and matrix equivalent to fiber deformation. The simulation accuracy of this method strongly depends on the results of the fiber pull-out test. Shafieifar et al. (Shafieifar et al., 2017) used plastic damage in ABAQUS to simulate UHPC failure, and found that this method produces good results in UHPC compression, bending, and tension simulations. However, this method is not ideal for simulating the effect of fibers on the development and distribution of cracks.
In this study, a UHPC meso-model with random fiber distribution characteristics was established by combining the advantages of the above methods. In this model, the damage to the UHPC matrix is simulated in ABAQUS with plastic damage and the steel fiber is modeled independently. In Section 2, by simulating fiber pull-out from the UHPC matrix, the debonding mechanism and pulling load–displacement curve (P–δ curve) of the steel fiber are obtained. A meso-finite element model of UHPC is established in Section 3 by modeling randomly distributed steel fibers in the UHPC matrix. Using this model, the effects of the distribution and orientation of steel fibers, fiber volume, fiber length, interface strength, and matrix strength on the UHPC crack characteristics and tensile mechanical properties are studied in Section 4.
To simulate the entire process of pulling out the steel fiber from the UHPC matrix and to obtain the fiber-pull-out P–δ curve, a fiber pull-out model of UHPC was established in ABAQUS.
Lee et al. (Lee et al., 2010) showed that the interface shear stress is related to the relative slip between the steel fiber and UHPC matrix. Therefore, a two-dimensional cohesive element was selected to simulate the interface between the steel fiber and UHPC matrix (Figure 1A). The interface element consisted of four nodes; the element was composed of a top surface, bottom surface, and intermediate layer. When failure occurred, the element cracked from the intermediate layer. The cohesive model has a concise form, and can be used to simulate the damage and failure of heterogeneous materials. Among the available constitutive relations of the cohesive model, the exponential constitutive relation proposed by Xu and Needleman (Xu and Needleman, 1994) represents the softening of the material as an exponential function; therefore, it is very suitable for simulating the damage of UHPC materials containing steel fibers. Thus, the exponential cohesive constitutive model was selected to characterize the interface characteristics (Figure 1B): when there was no debonding, the interface stress increased linearly with increasing relative displacement of the interface; when the stress reached
where μ is the softening coefficient, which is a dimensionless parameter describing the rate of damage evolution (μ was determined experimentally);
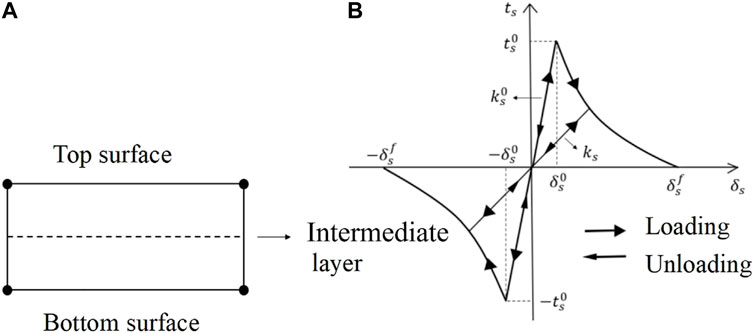
FIGURE 1. (A) Cohesive force element model and (B) constitutive relation..
Then, the actual element stiffness
where
The second nominal strain criterion was used as the damage initiation criterion:
Here,
The plastic strengthening constitutive model was used to characterize the constitutive relationship of steel fiber:
where
A concrete plastic damage model was used to simulate the damage to the UHPC matrix. To facilitate convergence in the calculations, the GFI in ABAQUS was used to define the tension behavior of the UHPC matrix, which means that the tensile softening curve was determined by the tensile strength and fracture energy. The following equation (Zhou, 2017) was used as the constitutive relationship of the UHPC matrix under compression:
Here, y is the ratio of the UHPC stress to peak stress, and x is the ratio of the UHPC strain to peak strain. a and b are material parameters obtained from the test. When the volume content of steel fiber is 0%, 1%, 2%, and 3%, the material parameters are a = 1.01, 1.05, 1.1, and 1.2, and b = 57.47, 11.56, 3.76, and 1.45 (Zhou, 2017). When simulating the pull-out of steel fiber from the UHPC matrix, the coefficients a and b in the stress–strain relationship of the UHPC matrix should be selected as the parameters when the steel fiber content is 0%, i.e., a = 1.01 and b = 57.47.
Based on the plastic damage model, after determining the uniaxial tension and compression behavior of the material, the uniaxial constitutive relation needs to be extended to the triaxial stress state. Table 1 shows the plastic damage material parameters required for extending the uniaxial constitutive relation to the triaxial stress state. The parameters commonly used in ordinary concrete (Lubliner et al., 1989) were used here; these parameters have been shown to simulate the plastic damage of UHPC well (Kueres et al., 2015).
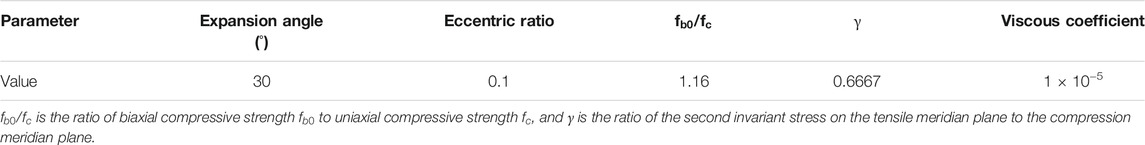
TABLE 1. Plastic damage parameters of UHPC matrix (Kueres et al., 2015).
The model shown in Figure 2 was used to simulate the pull-out of a fiber from the UHPC matrix. In this model, the UHPC matrix is a cylinder with a diameter of 40 mm and height of 30 mm. The diameter of the fibers was 0.3 mm, fiber length was 13 mm, and the fiber embedded length was 6.5 mm. The matrix and fiber element type was CAX4R (a four-node bilinear axisymmetric quadrilateral element), and the cohesive element described above with no thickness was inserted at the fiber–matrix interface (the element type was COH2D4). The cohesive element shared a node with the matrix and fiber elements (Figure 2). The shear stress distribution along the fiber at a certain loading time could be obtained by extracting the shear stress at the middle layer of the cohesive element. Displacement constraints were applied to the UHPC matrix, and a pulling load p was applied to the center of the fiber. The ABAQUS implicit solver was used to solve this problem.
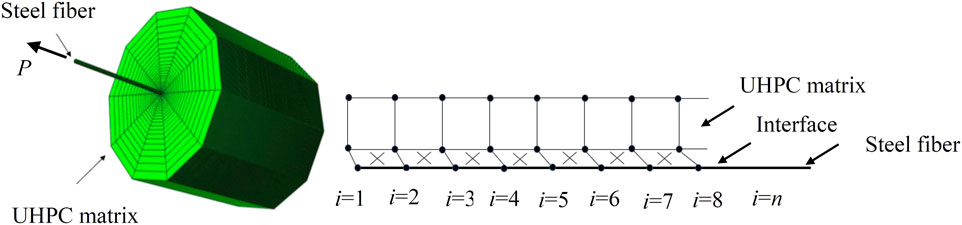
FIGURE 2. Pull-out model of steel fiber in UHPC.
The material parameters in the model were selected based on the work of Lee et al. (Lee et al., 2010) (Table 2). Lee et al. (Lee et al., 2010) conducted very comprehensive steel fiber pull-out tests, and the material characteristics of the UHPC matrix and fibers used in the tests were consistent with those of the UHPC material commonly used in engineering. Therefore, Lee et al.'s tests were used to verify our model.
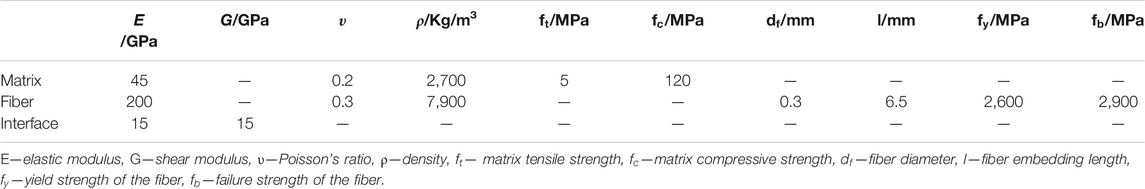
TABLE 2. Material parameters used in the fiber pull-out model (Lee et al., 2010).
In the exponential softening relationship, the value of the coefficient μ affects the shape of the softening curve. When μ = 0, the softening curve is a straight line, and when μ < 0, the softening curve is slightly convex, which closely reflects the material characteristics of UHPC. Therefore, an exponential softening curve with μ = 0, –1, and –2 was separately selected to represent the interface characteristics for the simulation. The simulated fiber pull-out P–δ curve is shown in Figure 3, and was compared with the results of Lee et al. (Lee et al., 2010). As shown in Figure 3, in the ascending section, the slope and peak value of the simulation curve agree well with the test results. The values of the peak load obtained from the test and simulation are respectively 27.75 N and 27.79 N—a difference of only 0.14%. In the descending section, the simulation result is closest to the test result when μ = –1. In this case, the simulated pull-out energy consumption is 105.1 N mm and the test pull-out energy consumption is 107.4 N mm (Lee et al., 2010)—a difference of only 2.2%. These results indicate that the pull-out energy consumption of the steel fiber in UHPC matrix can be simulated more appropriately when μ = –1. Therefore, it is recommended to choose the exponential cohesive model with μ = –1 as the constitutive model of the interface between the UHPC matrix and steel fiber.
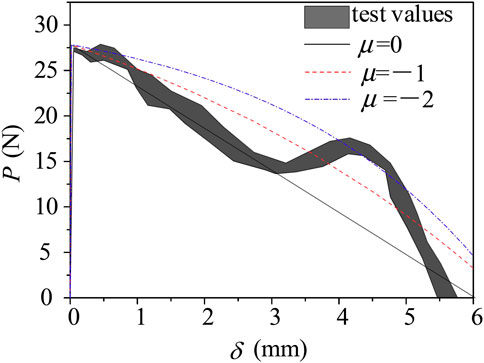
FIGURE 3. Comparison of the simulated pull-out curves and Lee et al.,s testing (Lee et al., 2010) curves.
Figure 4 shows a partially enlarged P–δ curve for pulling out the steel fiber. To determine the change in shear stress in the steel fiber during the pull-out process and analyze the debonding mechanism of the steel fiber, point A (non-debonding), point B (partial debonding), point C (two-way debonding), and point D (full debonding) were selected (Figure 4), and the shear stress distribution on the steel fiber at these four points was extracted. The pull-out displacements corresponding to points A, B, C, and D are 0.0003, 0.0036, 0.029, and 0.036 mm, respectively. Figure 5 shows the distribution along the buried part of the fiber and the Mises stress distribution in the matrix, at the four moments corresponding to points A, B, C, and D.
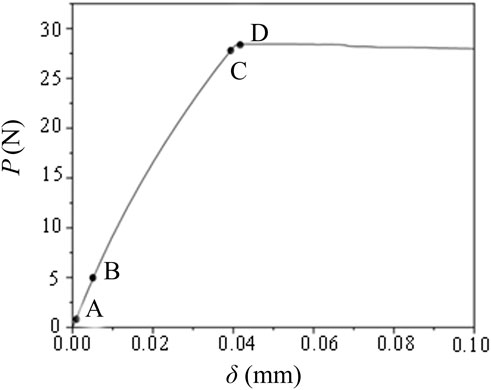
FIGURE 4. Steel fiber pull-out P–δ curve.
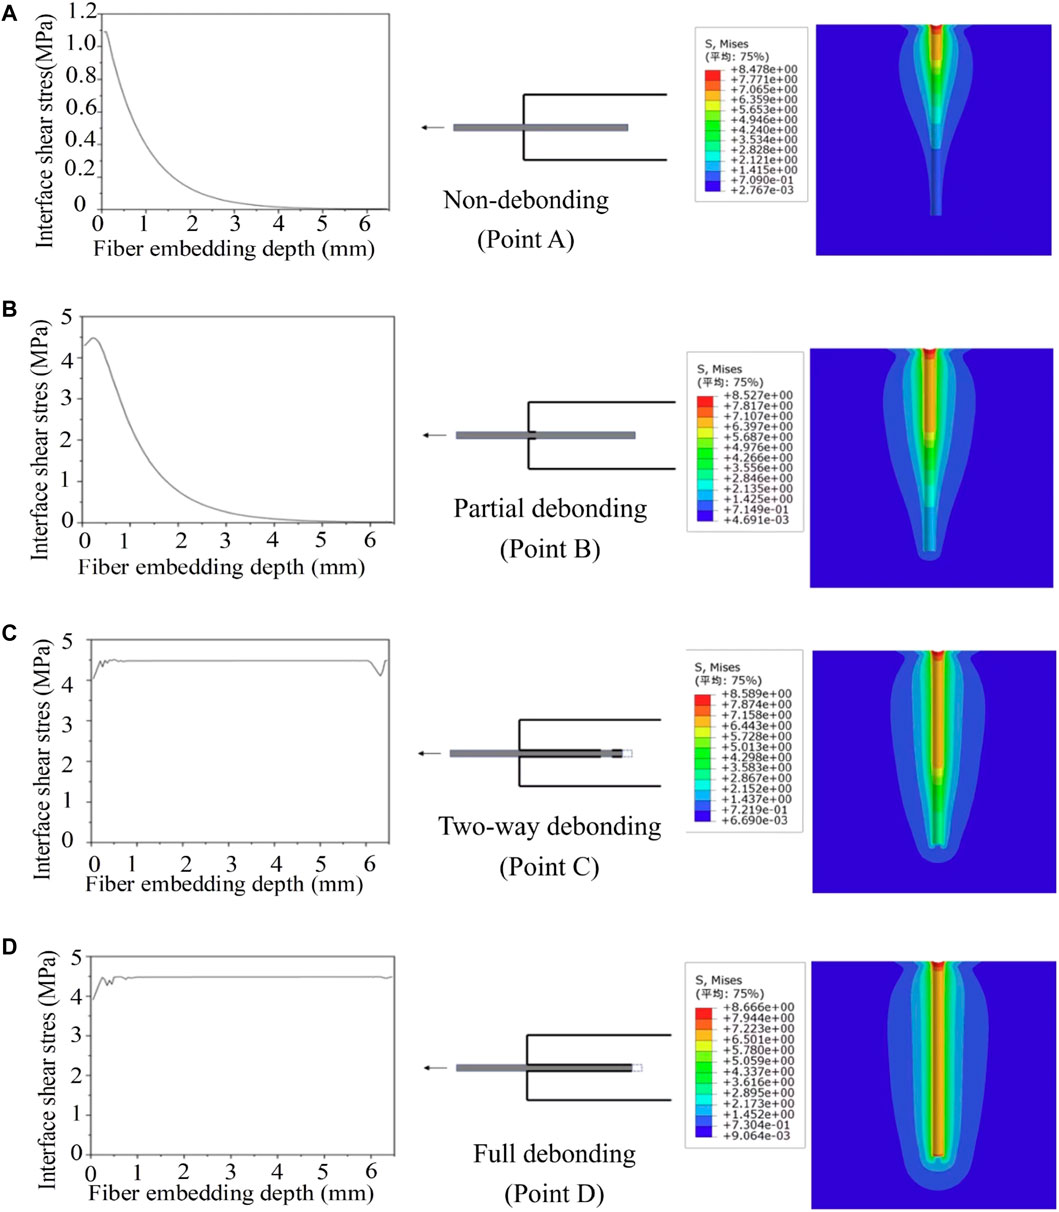
FIGURE 5. Interfacial shear stress and matrix stress distribution during fiber pull-out.
It can be seen that when the interface stress is in the elastic stage (point A), the fiber does not debond, and the shear stress at the interface is exponentially distributed along the embedded fiber. As the load increases, debonding begins (point B), the interfacial shear stress at the pull-out end of the fiber reaches the interface strength, and the fiber starts to debond from the matrix from the pull-out end. At this time, the interfacial shear stress at the embedded end of the fiber is still very small, and the interface that is not debonded is still in the elastic stress stage. With increasing pulling force, the shear stress is gradually transmitted to the embedded end, the fibers are debonded from the pull-out end to the embedded end, and the shear stresses on most of the interface and the embedded end reach the interface strength (point C). At this time, the fiber exhibits a two-way debonding phenomenon in which both the pull-out and embedded ends are debonded. Finally, the fibers are all debonded (point D), and the P–δ curve reaches a peak. At this time, the shear stress at almost the entire interface reaches the interface strength, and the fibers are gradually pulled out.
A UHPC model with multiple randomly distributed steel fibers was established based on the pull-out simulation of a single steel fiber.
When establishing the UHPC model with a random distribution of steel fibers, it was considered that UHPC is composed of fibers and a matrix, and the randomly distributed steel fibers were modeled in the matrix based on the Monte Carlo method. In this model, the steel fibers were simulated as truss elements with a certain length, the positions and directions of the fibers were random, and the fiber distribution function was uniform. The number of fibers N in the model was calculated from the fiber length
The positions of the fibers in the matrix were determined using the coordinates of the ends of the fibers (Figure 6). First, the coordinates (

FIGURE 6. Spatial coordinates of the random fiber.
When point B was generated, it was additionally necessary to determine whether point B exceeded the boundary described by the boundary function; if it exceeds the boundary, it must be generated again. Finally, it was necessary to determine whether there was an overlap conflict between the two fibers in space. For this purpose, the minimum distance between the two fibers in the space was calculated and compared with the fiber diameter. If the former was greater, there were no conflicts. Figure 7 shows the flowchart of the algorithm applied to generate randomly distributed fibers.
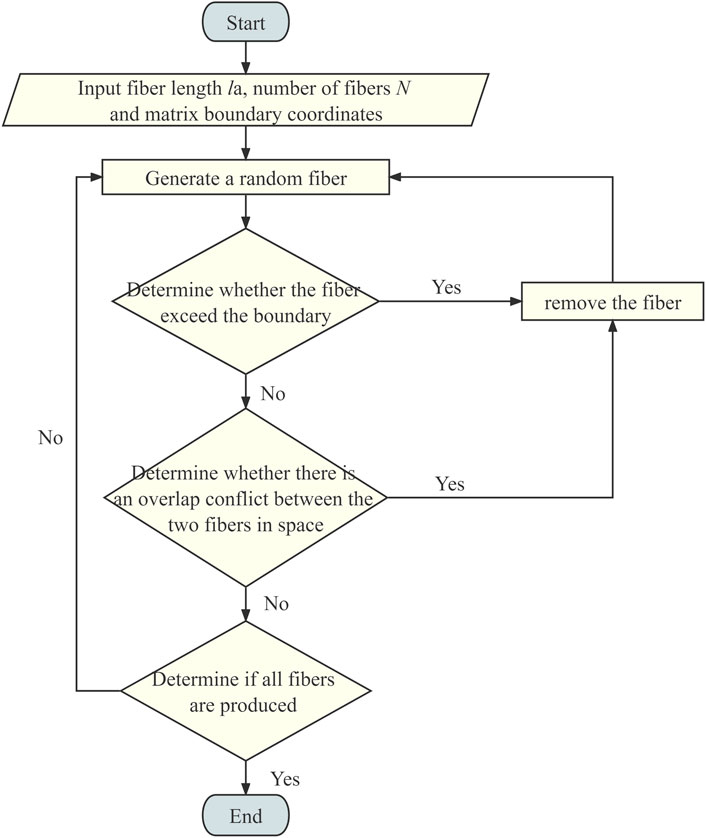
FIGURE 7. Algorithm flow for generating randomly distributed fibers.
In the UHPC model with randomly distributed fibers, the slip characteristics of the steel fiber–matrix interface were represented by the material properties of the steel fibers. By using the following equation, the P–δ relationship obtained in Figure 4 can be converted to the stress–strain relationship of the steel fiber:
where
The stress–strain relationship of steel fiber obtained by this transformation includes the interface characteristics, which can reflect the characteristics of the steel fiber pull-out and debonding from the UHPC matrix during the loading process.
The GFI provided by ABAQUS was used to set the tensile constitutive of the UHPC matrix, the softening behavior of the matrix was characterized by defining the fracture energy GFm, and the interface strength was characterized by the equivalent interface strength
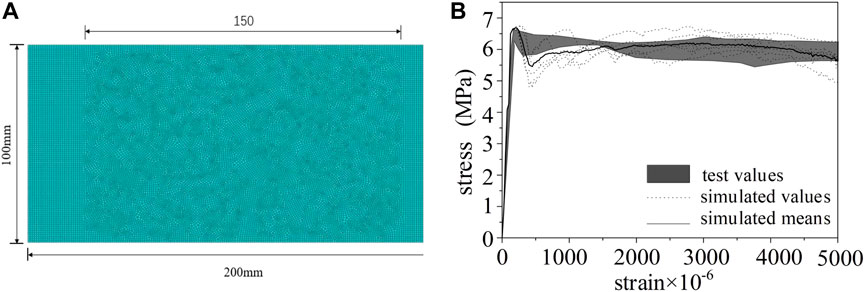
FIGURE 8. Simulation of UHPC uniaxial tensile specimens (A) dimensions of the UHPC uniaxial tensile model and (B) simulation and test results (Yuan et al., 2009) of stress‐strain curves (
The parameters
Using this model, the UHPC uniaxial compression test reported in the literature (Zhou, 2017) was simulated, and the simulation parameters were selected according to the test results. Figure 9 compares the simulated and tested stress–strain curves, demonstrating that they agree well. The elastic moduli of the ascending phases of the two curves are very similar, and the trends of the descending phases of the curves are the same. The difference in compressive strength between the simulation results and the test results is 0.5%–4.4%, and the difference in peak strain is 0.03%–2.7%. These results indicate that the proposed mesoscopic model can simulate the mechanical behavior and failure process of UHPC well.
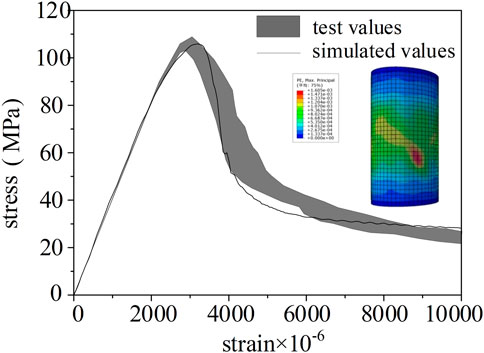
FIGURE 9. Comparison of the simulated stress‐strain curve and the test curve (Zhou, 2017) of UHPC uniaxial compression.
To study the effects of the fiber distribution and the fiber and matrix properties on the crack propagation path and UHPC tensile behavior, randomly distributed steel fibers were generated in the notched specimen (Figure 10). The displacement was restrained on the left side of the specimen, and horizontal displacement was applied on the right side. The effects of the fiber orientation, fiber content, fiber length, interface strength, and matrix strength on the tensile behavior of UHPC were studied. Because the random distribution of steel fibers may affect the crack propagation path, five models were randomly generated for each set of conditions for the simulation.
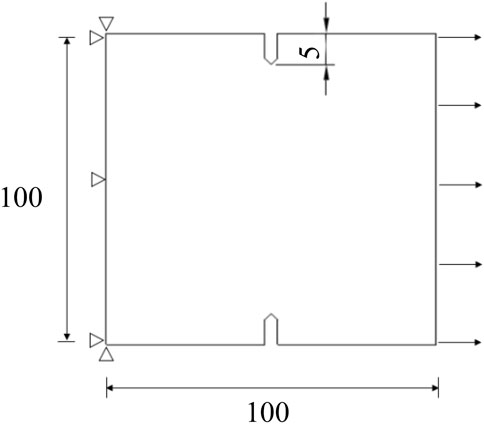
FIGURE 10. Notched tensile specimen model of UHPC.
For UHPC with a fiber volume content of 2.5%, a tensile simulation of the notched specimens was conducted. Figure 11, which shows the crack distributions of the five UHPC specimens with different random fiber distributions, indicates that cracks in UHPC tend to pass by the fibers as the cracks propagate. When the crack enters the fiber-dense area, it tends to bypass this area and expands to the fiber-sparse area (the area inside the white circle in Figure 11). Therefore, if the fiber distribution is relatively even, the crack is relatively straight, such as in specimen one; if the fiber distribution is uneven, the crack is rugged, such as in specimen 4. It can also be seen that at 2.5% fiber volume content, multiple cracks tend to occur on the specimen. Because the fiber density is relatively large in this case, the fiber in front of the crack has a strong crack resistance effect, and it is difficult for the crack to propagate directly forward until specimen failure. New cracks are created, which propagate at other interfaces, causing multi-crack failure mode.
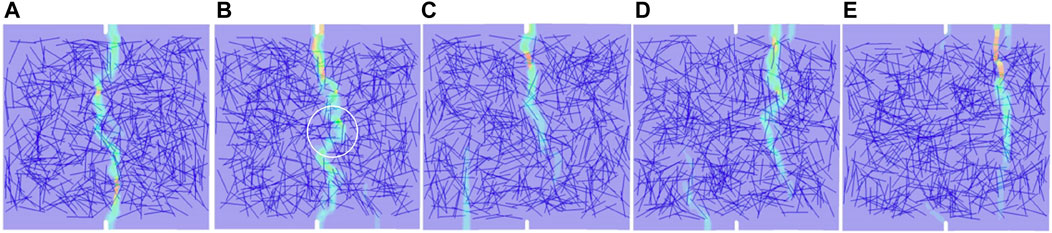
FIGURE 11. Crack distribution of UHPC tensile specimens (A) 1, (B) 2, (C) 3, (D) 4, and (E) 5 (fiber volume content of 2.5%).
The stress–strain curves for each specimen are shown in Figure 12. The specimens exhibit obvious strain-hardening behavior, and the average tensile strength (8.88 MPa) and peak strain (1,560 × 10−6) are significantly higher than the average initial crack strength (5.87 MPa) and initial crack strain (150 × 10−6), respectively. Figure 12 further shows that the random distribution of fibers has little effect on the initial cracking strength and initial cracking strain of UHPC, but has greater effects on the tensile strength and peak strain. This finding indicates that the bridging effect of the fibers occurs only after the appearance of macroscopic cracks.
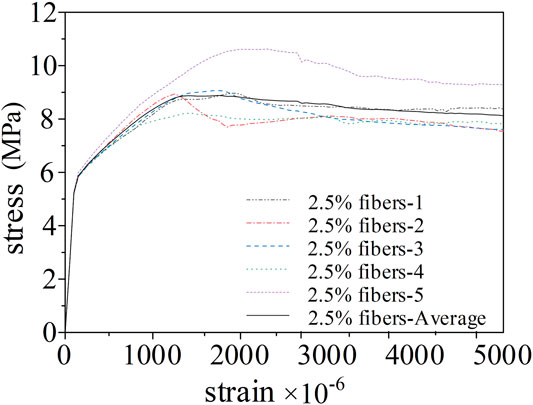
FIGURE 12. Tensile stress‐strain simulation curves of UHPC (fiber volume content of 2.5%).
Figure 13 shows the stress cloud of the fibers of specimen 2 after the matrix cracks. Not only the fibers between the main cracks but also those in the tension zone are subjected to large stress. Thus, most of the steel fibers in the tension zone are involved in resisting tensile stress, which is the reason UHPC exhibits strain-hardening properties and high toughness. Figure 13 further shows that the fibers whose length direction is close to the tensile stress direction bear significantly more stress (the red fibers are shown in the figure), indicating that the steel fiber orientation affects the mechanical properties of UHPC significantly.
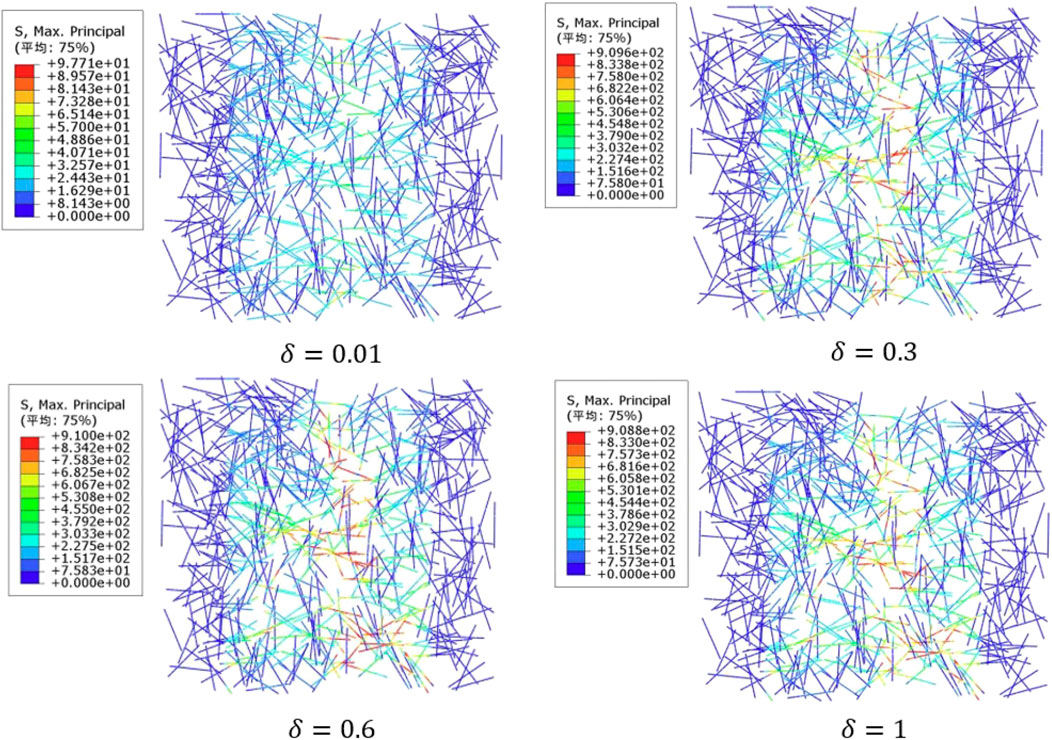
FIGURE 13. Fiber stress cloud of UHPC after cracking.
To study the effect of fiber orientation on the tensile behavior of UHPC, the tensions of UHPC specimens with different fiber inclination angles (the other parameters were the same) were simulated. The fiber inclination angle was defined as the angle between the fiber and tensile direction of the specimen. In the simulation, four fiber inclination angle regions were considered: 0°–15°, 15°–30°, 30°–45°, and 45°–60°.
The crack propagation of the specimens under different fiber inclination angles is shown in Figure 14A. It can be seen that the smaller the fiber inclination angle, the more difficult it is for the crack to bypass the fiber, and the more effective the crack resistance effect of the fiber, resulting in sinuous cracks and more fibers on the fracture surface. When the fiber inclination angle is 0°–15°, there are multiple cracks in the UHPC; when the fiber inclination angle is 15°–30°, the crack propagation in the UHPC is still sinuous and complicated, but is relatively gentle compared with the cracking of specimens with fiber inclination angles of 0°–15°. Further, when the fiber inclination angle is 30°–45°, the crack propagation is relatively gentle, and the number of fibers on the fracture surface decreases. When the fiber inclination angle is 45°–60°, the cracks develop almost perpendicular to the direction of the tensile stress.
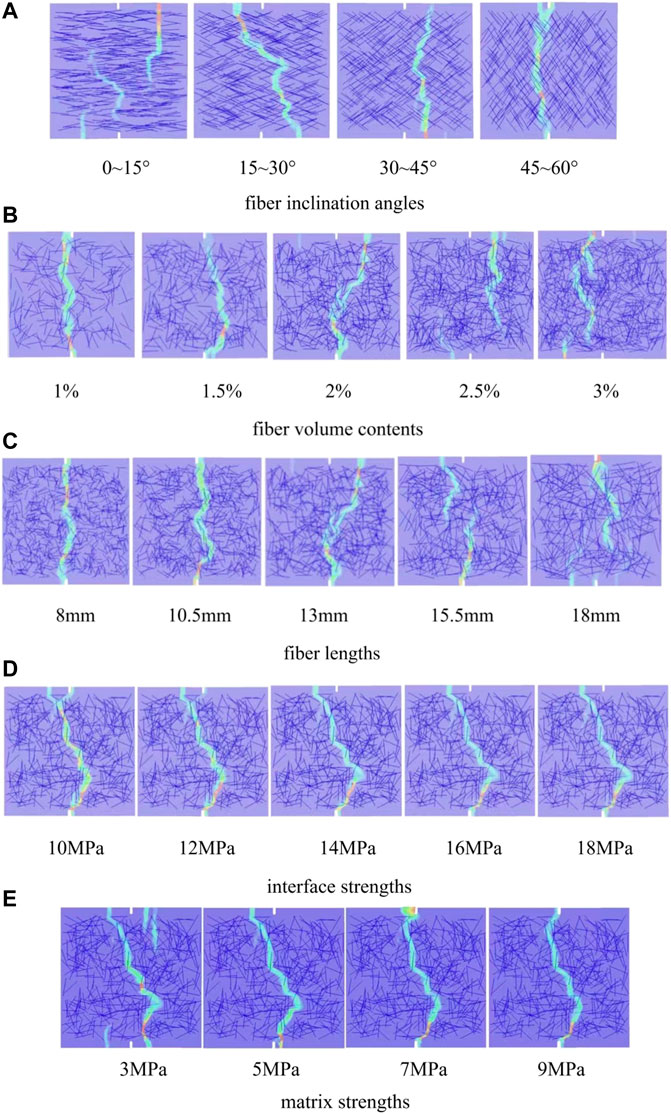
FIGURE 14. Crack modes of UHPC tensile specimens with various (A) fiber inclination angles, (B) fiber volume contents, (C) fiber lengths, (D) interface strengths, and (E) matrix strengths.
Figure 15 shows the tensile stress–strain curves of UHPC with different parameters, and Table 3 summarizes the tensile mechanical properties of UHPC with different parameters. Figure 15A shows that when the fiber inclination angle is smaller than 45°, the stress–strain curves have an obvious plastic stage, and the smaller the fiber inclination angle, the greater the slope of the plastic stage. As shown in Table 3, with increasing fiber inclination angle, the initial crack strength and elastic modulus decrease gradually, and when the fiber inclination angle exceeds 30°, the tensile strength of the UHPC decreases significantly.
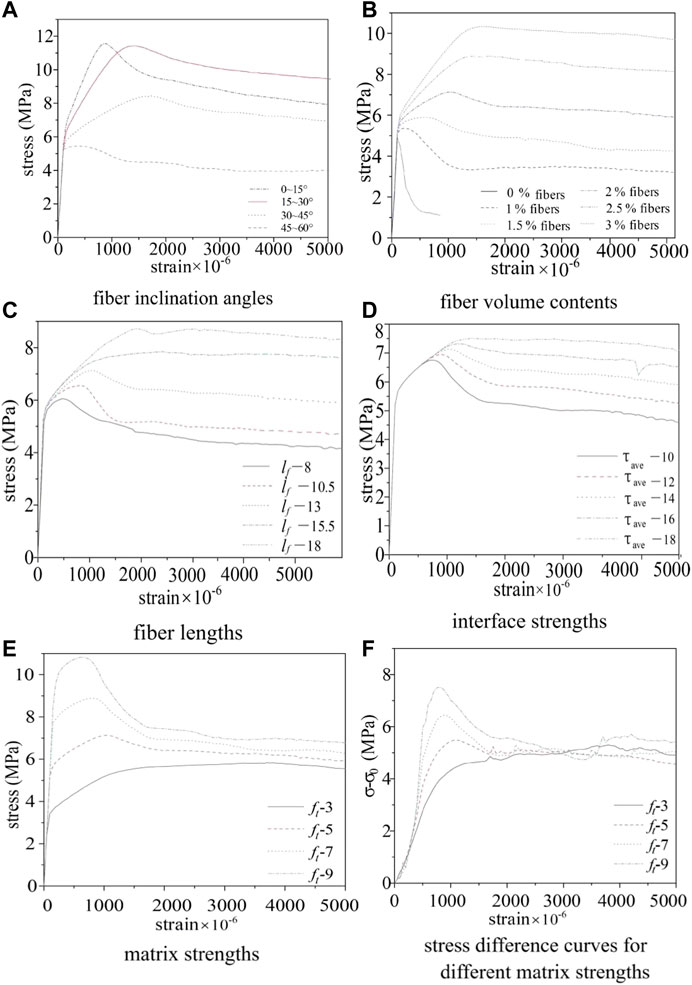
FIGURE 15. Stress‐strain curves of UHPC specimens with various (A) fiber inclination angles, (B) fiber volume contents, (C) fiber lengths, (D) interface strengths, and (E) matrix strengths, and (F) stress difference curves for different matrix strengths.
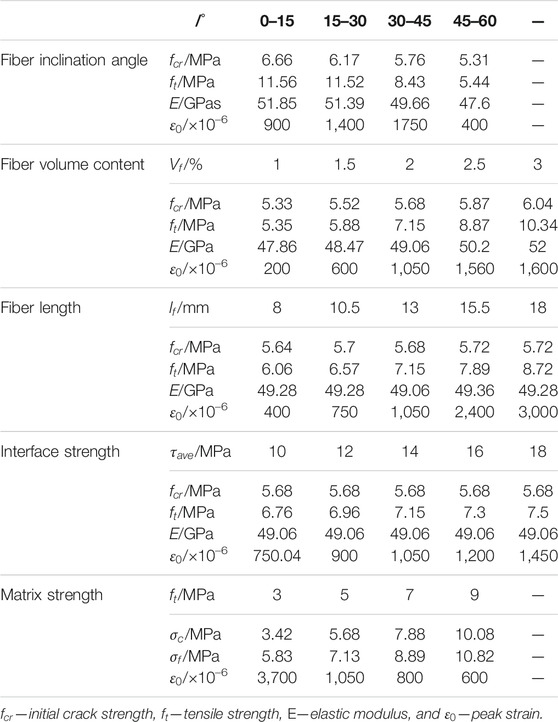
TABLE 3. Tensile mechanical properties of UHPC specimens with various parameters.
In general, upon comparing the specimens with fiber inclination angles of 15°–30° with the specimens with fiber inclination angles of 0°–15°, although the tensile and initial crack strengths of the former are slightly lower than those of the latter, the toughness and ductility of the former are obviously larger than those of the latter. Therefore, it is believed that UHPC can obtain the best tensile properties when the fiber inclination is in the range of 15°–30°.
Figure 14B shows the tensile crack modes of UHPC specimens with five different fiber volume contents (1%, 1.5%, 2%, 2.5%, and 3%). It can be seen that the crack propagation is relatively smooth in the specimen with a fiber content of 1%. When the fiber volume content exceeds 2%, the cracks in the specimen become sinuous. When the fiber content is greater than 2.5%, the specimens begin to exhibit multiple obvious cracks. When the fiber volume content is 3%, many cracks are discretely distributed in the weak interface area.
Figure 15B and Table 3 show that when the fiber volume content is greater than 2%, especially when the fiber content is greater than 2.5%, the stress–strain curve of the specimen exhibits strain-hardening behavior. In addition, the tensile strength and peak strain are obviously improved, the descending stages of the curves become gentle, and the toughness of the matrix is enhanced. Table 3 shows that the increase in fiber volume content has obvious effects on the tensile strength and peak strain of UHPC, but has little effect on the initial crack strength. The initial crack strength only increased by a small degree (5.33–6.04 MPa) with increasing fiber volume content.
The fiber volume content was set to 2%, and the fiber length was set to 8, 10.5, 13, 15.5, and 18 mm to study the effects of the fiber length on the tensile properties of UHPC. As shown in Figure 14C, when the fiber length is 8 mm, the anti-cracking effect of the fiber is not sufficiently strong, and most specimens crack along intermediate cracks. The peak load is reached soon after the initial crack occurs, and the bearing capacity begins to decrease (Figure 15C). As the fiber length increases, the crack propagation becomes sinuous, and correspondingly, the tensile strength and peak strain of the specimens increase significantly (Table 3). When the fiber length is greater than 15.5 mm, the stress–strain curve shows obvious strain-hardening characteristics, and multiple cracks develop in the specimens simultaneously (Figure 14C). This finding indicates that as the fibers in the matrix become longer, it becomes more difficult for the cracks to bypass the fibers, increasing the tensile energy consumption. When the fiber is sufficiently long (lf > 15.5 mm in this study), it is difficult for the cracks to bypass the fiber. Therefore, new cracks must be generated at other weak interfaces of the matrix; thus, the specimen failure mode is multi-crack failure. Nevertheless, Table 3 shows that with the same fiber volume content, the change in fiber length has little effect on the initial crack strength and elastic modulus of UHPC.
With the same fiber distribution and other parameters, the equivalent interface strength
To study the effect of matrix strength on the tensile behavior of UHPC, the matrix strength
As shown in Figure 14E, when the strength of the matrix is low (3 MPa), once the crack development is resisted by the fibers, the cracks begin developing from other weak parts of the matrix instead of splitting the fiber–matrix interface. At this time, it is difficult for the fiber to exert the crack resistance effect. Therefore, although the specimens exhibit strain-hardening characteristics in this case, the tensile strength of the UHPC specimen is very low to exploit its material advantages. With increasing matrix strength, the initial crack strength and tensile strength of UHPC increase gradually (Table 3), but the crack propagation path is hardly affected by the matrix strength. When the matrix strength and interface strength are well matched (matrix strength ≥7 MPa), the crack resistance effect of the fibers can be fully exerted (Figure 15E). To further illustrate the effects of matrix strength on the crack resistance of fibers, the stress difference
In this study, fiber pull-out from a UHPC matrix was simulated, and the characteristics of the interfacial shear stress and P–δ curve during the pull-out process were obtained. On this basis, a UHPC mesoscopic finite element model considering the random distribution of steel fibers was established, and the effects of the fiber and matrix characteristics on the crack development characteristics and tensile properties of UHPC were determined. The main conclusions are as follows.
1) The exponential cohesive model with a softening coefficient of –1 could characterize the interface behavior between the steel fiber and UHPC matrix. The UHPC meso-finite element model containing randomly distributed steel fibers established by the Monte Carlo method could simulate the crack development in the UHPC specimens and obtain the mechanical properties of the specimens.
2) Fiber debonding in UHPC is a gradually developing process, and the process is as follows: non-debonding, partial debonding, two-way debonding, and full debonding. In the fiber segment without debonding, the interfacial shear stress was distributed exponentially. When the debonding was fully developed, two-way debonding occurred in the fiber.
3) With randomly distributed fibers, the main propagation mode of cracks in UHPC was that the cracks bypassed the fiber-dense area and extended to the fiber-sparse area, and the crack propagation path was mainly affected by the fiber distribution. The distribution of fibers had significant effects on the tensile strength and peak strain of UHPC; most fibers in the tensile zone were involved in resisting tensile stress.
4) When the fiber inclination angle was in the range of 15°–30°, the UHPC had the best comprehensive tensile properties. When the fiber volume content was greater than 2.5%, the UHPC exhibited multi-cracking and strain-hardening characteristics. When the fiber length was greater than 15.5 mm, the energy consumption of crack development was large, and the UHPC also exhibited the characteristics of multi-cracking and strain hardening.
5) As the interface strength increased, the tensile strength, peak strain, and toughness of the specimen increased accordingly. However, the interface strength had no effect on the crack propagation path of the UHPC. The higher the strength of the UHPC matrix, the greater the cracking resistance of the steel fibers that can be achieved. The UHPC matrix with a strength greater than or equal to 7 MPa was more suitable for use with ultra-high-strength steel fibers.
The original contributions presented in the study are included in the article/Supplementary Material, further inquiries can be directed to the corresponding author.
ZY and MA contributed to the conception of the study. WL performed the numerical simulation. ZY and WL performed the data analyses and wrote the manuscript. YW helped perform the analysis with constructive discussions. All authors contributed to manuscript revision, read, and approved the submitted version.
The authors declare that the research was conducted in the absence of any commercial or financial relationships that could be construed as a potential conflict of interest.
All claims expressed in this article are solely those of the authors and do not necessarily represent those of their affiliated organizations, or those of the publisher, the editors and the reviewers. Any product that may be evaluated in this article, or claim that may be made by its manufacturer, is not guaranteed or endorsed by the publisher.
The authors gratefully acknowledge the financial support from the Fundamental Research Funds for the Central Universities (Grant No. 2019JBM089), the National Natural Science Foundation of China (Grant No. 52108189), and the National Natural Science Foundation of China (Grant No. 51878033).
Abrishambaf, A., Pimentel, M., and Nunes, S. (2019). A Meso-Mechanical Model to Simulate the Tensile Behaviour of Ultra-high Performance Fibre-Reinforced Cementitious Composites. Compos. Structures 222, 110911. doi:10.1016/j.compstruct.2019.110911
Cunha, V. M. C. F., Barros, J. A. O., and Sena-Cruz, J. M. (2012). A Finite Element Model with Discrete Embedded Elements for Fibre Reinforced Composites. Comput. Structures 94-95, 22–33. doi:10.1016/j.compstruc.2011.12.005
Deng, Z. C., and Feng, Q. (2016). Fracture Performance of Hybrid Fiber Reactive Powder concrete. J. Build Mater. 19 (01), 14–21.
Ellis, B. D., Mcdowell, D. L., and Zhou, M. (2014). Simulation of Single Fiber Pullout Response with Account of Fiber Morphology. Cement and Concrete Composites 48, 42–52. doi:10.1016/j.cemconcomp.2014.01.003
Kueres, D., Stark, A., Herbrand, M., and Classen, M. (2015). Numerische Abbildung von Beton mit einem plastischen Schädigungsmodell - Grundlegende Untersuchungen zu Normalbeton und UHPC/Finite element simulation of concrete with a plastic damage model - Basic studies on normal strength concrete and UHPC. Bauingenieur 90, 252–264. doi:10.37544/0005-6650-2015-06-44
Lee, Y., Kang, S.-T., and Kim, J.-K. (2010). Pullout Behavior of Inclined Steel Fiber in an Ultra-high Strength Cementitious Matrix. Construction Building Mater. 24 (10), 2030–2041. doi:10.1016/j.conbuildmat.2010.03.009
Leung, C. K. Y., and Li, V. C. (1992). Effect of Fiber Inclination on Crack Bridging Stress in Brittle Fiber Reinforced Brittle Matrix Composites. J. Mech. Phys. Sol. 40 (6), 1333–1362. doi:10.1016/0022-5096(92)90018-w
Lubliner, J., Oliver, J., Oller, S., and Oñate, E. (1989). A Plastic-Damage Model for concrete. Int. J. Sol. Structures 25 (3), 299–326. doi:10.1016/0020-7683(89)90050-4
Malena, B. M., Emmanuel, D., and Eugen, B. (2016). Effect of Fiber Orientation on the In-Plane Tensile Response of UHPFRC Reinforcement Layers. Cem Concr Compos. 67, 111–125.
Montero-Chacón, F., Cifuentes, H., and Medina, F. (2017). Mesoscale Characterization of Fracture Properties of Steel Fiber-Reinforced Concrete Using a Lattice-Particle Model. Materials 10 (2), 207. doi:10.3390/ma10020207
Peng, G. F., Niu, X. J., and Zhao, Y. L. (2016). Influence of Special-Shaped Steel Fiber on Strengthening and Toughening of Ultra High Performance concrete. J. Build Mater. 19 (06), 1013–1018.
Pyo, S., Alkaysi, M., and El-Tawil, S. (2016). Crack Propagation Speed in Ultra High Performance concrete (UHPC). Construction Building Mater. 114, 109–118. doi:10.1016/j.conbuildmat.2016.03.148
Qi, J., Wu, Z., Ma, Z. J., and Wang, J. (2018). Pullout Behavior of Straight and Hooked-End Steel Fibers in UHPC Matrix with Various Embedded Angles. Construction Building Mater. 191, 764–774. doi:10.1016/j.conbuildmat.2018.10.067
Shafieifar, M., Farzad, M., and Azizinamini, A. (2017). Experimental and Numerical Study on Mechanical Properties of Ultra High Performance concrete (UHPC). Construction Building Mater. 156, 402–411. doi:10.1016/j.conbuildmat.2017.08.170
Shi, C., Wu, Z., Xiao, J., Wang, D., Huang, Z., and Fang, Z. (2015). A Review on Ultra High Performance concrete: Part I. Raw Materials and Mixture Design. Construction Building Mater. 101, 741–751. doi:10.1016/j.conbuildmat.2015.10.088
Tsai, J. H., Patra, A., and Wetherhold, R. (2015). Finite Element Simulation of Shaped Ductile Fiber Pullout Using a Mixed Cohesive Zone/friction Interface Model. Compos. A. Appl. Sci. Manuf 36 (6), 827–838.
Xu, M., Hallinan, B., and Wille, K. (2016). Effect of Loading Rates on Pullout Behavior of High Strength Steel Fibers Embedded in Ultra-high Performance concrete. Cement and Concrete Composites 70, 98–109. doi:10.1016/j.cemconcomp.2016.03.014
Xu, X.-P., and Needleman, A. (1994). Numerical Simulations of Fast Crack Growth in Brittle Solids. J. Mech. Phys. Sol. 42 (9), 1397–1434. doi:10.1016/0022-5096(94)90003-5
Yin, Z. G. (2014). Test Study of Fracture Mechanical Properties of Reactive Powder concrete with Additives. Amr 904, 3–6. doi:10.4028/www.scientific.net/amr.904.3
Yoo, D.-Y., and Banthia, N. (2017). Mechanical and Structural Behaviors of Ultra-high-performance Fiber-Reinforced concrete Subjected to Impact and Blast. Construction Building Mater. 149, 416–431. doi:10.1016/j.conbuildmat.2017.05.136
Yuan, H. Y. (2009). Theoretical Analysis and Experimental Research on Tensile Performance of Reinforced Reactive Powder Concrete Beijing: Beijing Jiaotong University.
Zhao, R. D., Zhao, C. G., Yuan, Y., Li, F. H., and Wang, Y. B. (2015). Research Progress on Application of Steel Fiber in Ultra High Performance concrete. China J. Highw. Transport 34 (8), 1–22.
Keywords: crack propagation, numerical simulation, steel fibers, tensile properties, ultra-high-performance concrete
Citation: Yu Z, Liang W, An M and Wang Y (2022) Ultra-High-Performance Concrete Crack Propagation Based on Fiber Random Distribution Model. Front. Mater. 9:857874. doi: 10.3389/fmats.2022.857874
Received: 19 January 2022; Accepted: 21 February 2022;
Published: 18 March 2022.
Edited by:
Lik-Ho Tam, Beihang University, ChinaReviewed by:
Shaohua He, Guangdong University of Technology, ChinaCopyright © 2022 Yu, Liang, An and Wang. This is an open-access article distributed under the terms of the Creative Commons Attribution License (CC BY). The use, distribution or reproduction in other forums is permitted, provided the original author(s) and the copyright owner(s) are credited and that the original publication in this journal is cited, in accordance with accepted academic practice. No use, distribution or reproduction is permitted which does not comply with these terms.
*Correspondence: Ziruo Yu, enJ5dUBianR1LmVkdS5jbg==
Disclaimer: All claims expressed in this article are solely those of the authors and do not necessarily represent those of their affiliated organizations, or those of the publisher, the editors and the reviewers. Any product that may be evaluated in this article or claim that may be made by its manufacturer is not guaranteed or endorsed by the publisher.
Research integrity at Frontiers
Learn more about the work of our research integrity team to safeguard the quality of each article we publish.