 Zahid Ifrah
 Abbas Shah Rukh
 Sharif Muhammad Nauman
 Shahid Maryam
 Ullah Rahat2
95% of researchers rate our articles as excellent or good
Learn more about the work of our research integrity team to safeguard the quality of each article we publish.
Find out more
ORIGINAL RESEARCH article
Front. Mater. , 07 April 2022
Sec. Biomaterials
Volume 9 - 2022 | https://doi.org/10.3389/fmats.2022.857432
This article is part of the Research Topic Fluorescent Nanomaterials for Biomedical Applications View all 6 articles
Cystic fibrosis is a genetic disorder caused by a mutation in the cystic fibrosis transmembrane conductance regulator (CFTR) gene that encodes an ABC transporter-class ion channel protein, resulting in sticky and thick mucus secretion which clogs the airways and leads to respiratory failure and other complications. It also results in higher chloride ions (Clˉ) in body fluids. Cystic fibrosis is generally detected using the sweat chloride test and ion exchange chromatography, which are lab restricted. Therefore, there is a dire need to develop portable assays to monitor circulatory changes (Clˉ ion detection) to detect CF at the point of care. In this work, fluorescence quenching of graphene quantum dots (GQDs) was used as a property of the optical sensor for chloride ion detection. GQDs were synthesized by varying the carbonizing temperature and time, and then their optical and fluorescence (FL) quenching was investigated upon exposure to chloride ions in comparison with different ionic species. GQDs synthesized at 160°C for 50 min were chosen as they displayed the highest fluorescence. The morphological and optical characterization confirmed the preparation of 12–15 nm GQDs, which were amorphous in nature with the peak emission observed at 462 nm when excited at 370 nm. The fluorescence quenching response of GQDs with Clˉ ions displayed linearity up to 100 mM with a correlation coefficient of 0.98 and the lowest detection limit of approximately 10 mM Clˉ ions.
Point-of-care diagnostics has attracted attention in the past few years because of the early and rapid detection of biomarkers for disease management and monitoring of diseases (Vashist 2017; Golubnitschaja 2009). Chloride is an essential electrolyte within the body fluids, and its elevated level in the serum, urine, cerebral spinal fluid, or sweat indicates cystic fibrosis (De Gregorio et al., 2014). Cystic fibrosis is a recessive genetic disorder, which induces defective ion transfer across the epithelial membranes. It has been reported that at least 70% of CF patients have the cystic fibrosis transmembrane conductance regulator (CFTR) gene with the major mutation delta F508 (Cui et al., 1995). The CFTR gene codes for an ATP-binding cassette transporter (ABC transporter) ion channel protein that conducts chloride and thiocyanate ions across the epithelial cell membrane (Wang et al., 2011). Mutations of the CFTR gene elevate the concentration of chloride ions up to 60 mM and above in the epithelial fluids. The threshold value of chloride ions in these fluids is less than 20 mM (Quinton 1983). This results in the reduced chloride reabsorption from sweat that causes a sticky mucous secretion in multiple organs (Esteves et al., 2018). Most of the CF patients suffer from reduced lung function, change in overall physiological function, and increase in pancreaticobiliary and gastrointestinal tract malignancies (Simmonds et al., 2009; Horsley and Siddiqui 2015; Ooi and Durie 2016). Therefore, early detection of disease is of utmost importance to improve health and life expectancy of the patients.
The sweat chloride test is a conventional method used for the detection of CF, which is time consuming, requires skilled individuals, and prone to errors with very high false-negative rates at 12% (Farrell et al., 2001; LeGrys et al., 2009). Sweat analysis is non-invasive substitute to blood analysis which allows continuous monitoring of body parameters without making the patients uncomfortable. Moreover, high sensitivity and selectivity can be achieved using ion exchange chromatography technique, but it requires high maintenance cost and skilled operators. The other chloride analysis methods that include coulometry, colorimetry, and ion-selective electrodes (ISE) are not preferred because of low halide selectivity (McClatchey 2002). For example, iodide and bromide produce greater signals than that of chloride in ISE measurements (Bray et al., 1977). So, there is a dire need to develop a fully automated, low cost, sensitive and selective rapid chloride sensing technology, which can be translated to clinical settings (Yager et al., 2008).
GQDs are zero-dimensional (0D) material that exhibit extraordinary electronic and optical properties due to their edge effects and quantum confinement (Sun et al., 2013; Lin et al., 2014). Recently, graphene quantum dots have been widely used as fluorescent probes for the development of luminescent sensing assays (Li and Zhu 2013; Fan et al., 2015). Among other carbon allotropes graphene quantum dots (GQDs) display enthralling characteristics such as low-cost, non-toxicity, excellent biocompatibility, and photoluminescent stability (Li et al., 2013; Ganguly et al., 2019; Saravanan et al., 2020; Das et al., 2021; Bhattacharyya et al., 2020). The photoluminescent emission of graphene quantum dots can be extensively changed from the deep ultraviolet region to the near infrared region by regulating the shape, size, defects, hybridization of carbon lattice, functional groups, edge configuration, or by tuning the excitation wavelength or concentration of GQDs (Lai et al., 2020; Wang et al., 2016). A number of studies have confirmed the fluorescent quenching of GQDs (Saravanan et al., 2020; Das et al., 2018). The quenching mechanism between quantum dots and metal ions are mainly divided into Förster resonance energy transfer (FRET), the inner filter effect (IFE), and the dynamic and static quenching process (Qi et al., 2015). Usually, GQDs can be synthesized by two approaches, which are the top-down approach and the bottom-up approach. In the top-down approach, the zero-dimensional graphene quantum dots are fabricated from cutting of a particular carbon source material such as graphite, graphene oxide, carbon black, and carbon fiber (Ponomarenko et al., 2008). The disadvantages of synthesis via top-down approach includes critical synthesis conditions, difficulty in controlling the size distribution of products, which results in the formation of disordered and defective structures, and poorly crystalline nanomaterials (Dong et al., 2012a). In the bottom-up approach, condensation of smaller units of carbon derivatives results in the formation of bigger units of GQDs. The processes involve pyrolysis, oxidation, and hydrothermal heating. The most important advantage of the bottom-up approach is that it allows precise control over the morphology and the size distribution of the products (Wu et al., 2007).
In this study we explored the photoluminescence intensity of GQDs to monitor the chloride changes in cystic fibrosis. GQDs were prepared by optimizing the reaction parameters for controlled surface passivation, prepared via pyrolysis of citric acid, which is a bottom-up approach. Physiochemical and morphological characterization methods displayed the size of an average of 15 nm and showed the characteristic peaks via UV–Vis spectroscopy, XRD, FTIR, and SEM/EDX. GQDs were found to be disc-shaped, amorphous particles displaying blue phospholuminescence, with the maximum emission peak at 462 nm. The photoluminescent quenching effect of GQD was observed by the addition of chloride ions which showed linearity in the range of 5–90 mM. The results of this study show that the fluorescent behavior of the GQDs makes possible the development of rapid, simple, and effective tests for the detection of chloride ions.
Citric acid, sodium hydroxide (NaOH), sodium chloride (NaCl), and potassium chloride (KCl) were purchased from Daejung Chemicals and Metals. Potassium acetate, potassium nitrate, sodium carbonate, magnesium sulfate, and sodium phosphate were procured from Sigma-Aldrich. Hydrochloric acid (HCL) was obtained from BDH Laboratory Supplies, England. Deionized water was used throughout the experiment.
Six different fluorescent GQD samples were synthesized using the carbonization method. Briefly, a small flask containing 2 g citric acid was heated from 160 to 200 C with a selected reaction time of 30 and 50 min for each temperature variation as shown in Supplementary Table S1. The citric acid liquidates after 5 min, and slowly turns from colorless to pale yellow to yellowish orange, which is the visual cue that the pyrolysis is occurring. After the initiation of the reaction, the dropwise addition of this yellowish orange solution into 100 ml of 10 mg/ml NaOH, at a constant temperature was carried out. The aqueous solution of GQD was obtained. It was further purified by centrifugation at 15,000 rpm for 30 min, and then GQDs were obtained in a pellet form. The schematic overview of the mechanism involved for synthesizing GQDs is shown in Figure 1. Different temperature (160, 180, and 200°C) variations were performed for the synthesis of GQDs keeping in mind the thermogravimetric analysis (TGA) of citric acid. The samples were named according to their reaction conditions: the temperature followed by the reaction time in brackets, (i.e., temperature–time).
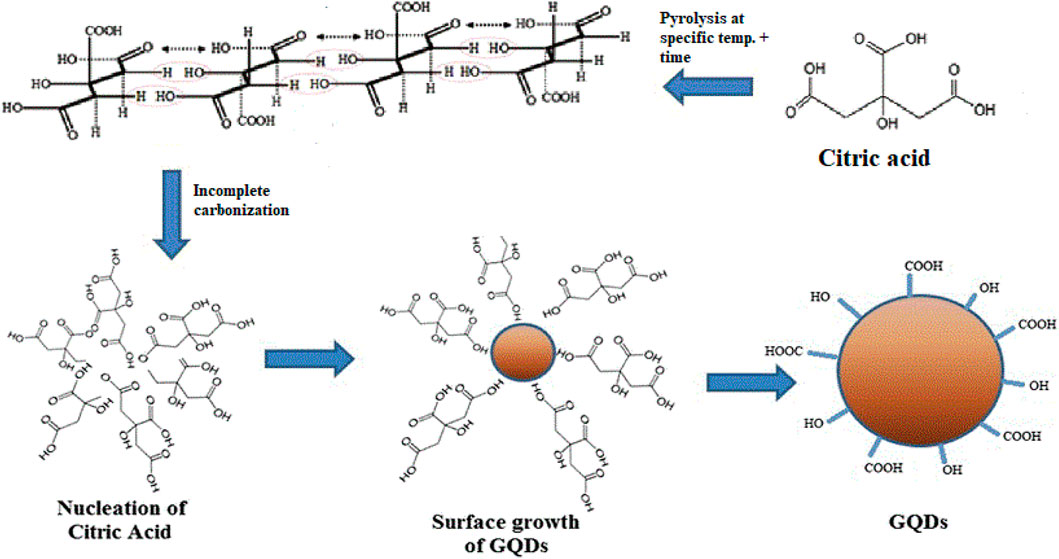
FIGURE 1. Schematic diagram of the mechanism used for the synthesis of graphene quantum dots from citric acid.
A scanning electron microscope (SEM) and EDX analysis were performed to obtain information about the surface topography and elemental composition of graphene quantum dots. Similarly, X-ray diffraction (XRD) was performed using an STOE Powder Diffractometer θ-θ (STOE Inc. Germany) in order to ensure the morphological nature, that is, crystallinity or amorphous nature of GQDs. Moreover, Fourier-transform infrared spectroscopy (FTIR) was used to obtain an infrared spectrum of absorption or emission of the samples, which reflects the bonding interaction in materials.
The optical properties of the GQDs were initially determined under the excitation of a handheld 365 nm ultra-violet (UV) lamp (UVP) and a UV–Vis spectrophotometer (UVD-2950) was used to collect the absorption spectra in the range of 200–800 nm. Fluorescence properties of each graphene quantum dot sample were confirmed using a fluorescence spectrometer (Horiba Fluoromax-4). As an excitation source, this system is equipped with a 150 W continuous wavelength xenon arc lamp, two Czerny–Turner monochromators for excitation and emission selection, adjustable slits in front of each monochromator, and a detector (R928P photomultiplier tube) whose response ranges from 180 to 850 nm. The slit width of excitation monochromator determines the bandpass of light incident on the sample whereas the emission monochromator’s slits control the intensity of the fluorescence signal recorded by the signal detector. Throughout the experiment the slit widths on excitation and emission were adjusted at 2 nm.
Furthermore, the excitation monochromator was set at 370 nm and emissions were acquired within a range of 410–600 nm. The emission spectra were taken using the front-face fluorescence (FFF) sample geometry of the spectrometer setup. The cuvette was fixed in the sample holder such that the excitation angle was set at 57o as recommended in the setup manual. A total of 50 mM concentration of each ion was prepared, and 1ml of ion sample was mixed with 2 ml of (6 mg/ml) GQD sample in a cuvette and was incubated for 5 min. All the emission spectra were acquired with varying concentrations of ions ranging from 10 to 200 mM. The quenching fluorescence patterns of graphene quantum dots with different concentrations of sodium chloride were analyzed. Every sample was analyzed as triplicates and the resultant graphs are an average of those spectra. To ensure that quenching effect observed was specific to only chloride ions, the quenching of GQDs were compared with another chloride-containing compound that is, potassium chloride (KCl).
The surface morphology and the size of the GQD were analyzed using the scanning electron microscope (SEM) (Tescan Vega 3). Samples were prepared by diluting the as-prepared GQDs in the ratio 1:5, in deionized water and the diluent was dropped on a glass slide. Scanning was performed at 20 kV, with the maximum magnification of ×65000, at the working distance of 5.07 mm. Figures 2A–D shows the images of GQD surface zoomed at different resolutions (20 um, 5 um, 1 um, and 500 nm). The size of the GQD as seen in the (c) image is approximately measured as 15.78 nm and can be seen as being disc-like particles, as observed in Figure 2D. Similarly, EDX analysis further confirms that the fluorescence intensity is strictly due to the graphene quantum dots and not due to the presence of some impurities. However, a small percentage of sodium (Na) was also observed which can be attributed to NaOH, which was the dispersion solution of GQD. Most likely it could have been left behind from the centrifugation step, during the sample preparation stage. The observed atomic percentage of carbon was 40.72%, oxygen was 45.70%, and sodium was 14.08%.
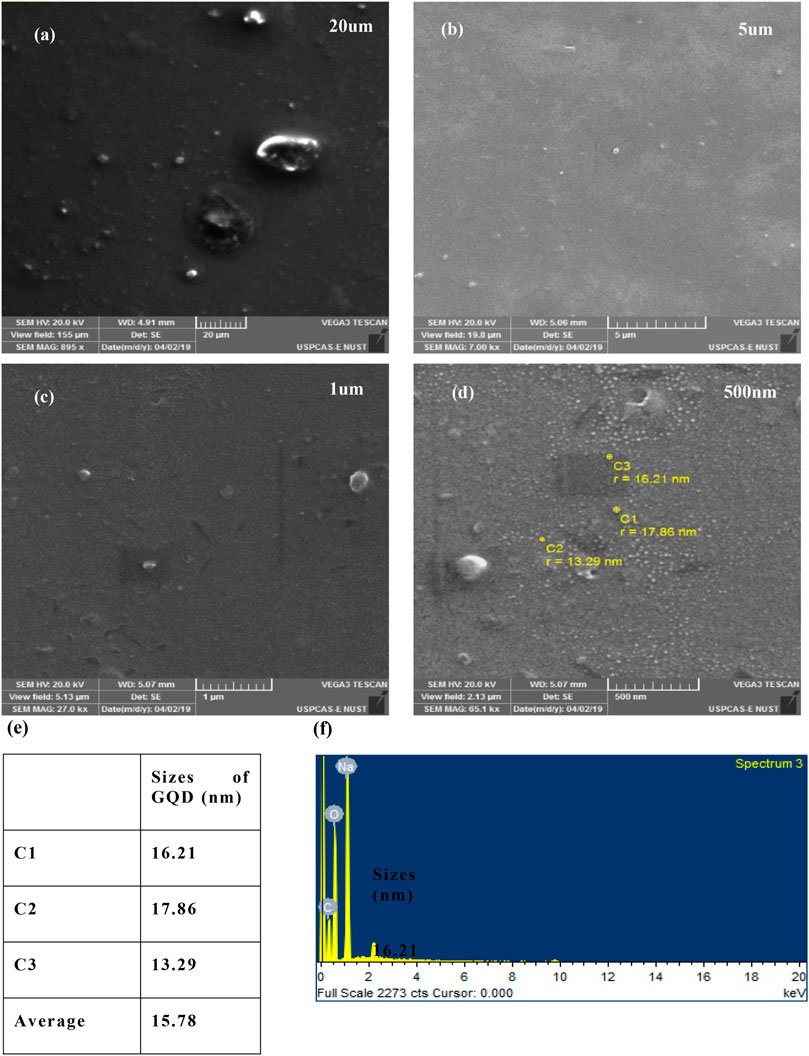
FIGURE 2. SEM images of GQD at mag. areas (A) 200 um, (B) 5 um, (C) 1 nm, (D) 500 nm, (E) quantification of the sizes observed in the SEM images, and (F) represents EDX results of GQD.
X-ray diffraction (XRD) was performed to ensure the morphological nature that is, crystallinity or amorphous nature of the graphene quantum dots. XRD of GQD was performed using the STOE Powder Diffractometer θ-θ (STOE Inc. Germany) with current 40 Ma and operating voltage 40Kv at scan rate 0.5°/min. The XRD pattern of GQDs shows a broad peak at around 2θ ∼ 32 indicating the amorphous nature of the GQDs (Li et al., 2018; Kundu and Pillai 2020) as seen in Figure 3. As calculated by Bragg’s equation the lattice size is 0.202 nm, suggesting that the carbonization of citric acid produced graphite structures, which has compact interlayer spacing. The small particle size is also evident from the broad peak. The absence of any peak characterized for graphene oxide and graphite, which is a sharp peak usually appears around 2Ө = 19o indicate that the prepared sample is indeed a graphene quantum dot. As reported, GQD exhibits absorption of carboxyl as well as hydroxyl group showing that nanomaterial contains -COOH groups at its surfaces. In Figure 4 is shown the FTIR spectra of GQDs which revealed the broadening of several peaks related to oxygen functional groups. The band appeared at 3,438 cm−1 is assigned to the stretching vibration of the O–H group (Qi et al., 2015). Similarly, 1,612 cm−1 absorption band is attributed to aromatic bending of C=O. Both these bands correspond to the complete dehydration of citric acid to GQD. An absorption FTIR band at 1,275 cm−1 relates to the stretching vibration of hydroxyl groups. Furthermore, the absorption band shown at 1,082 cm−1 is due to Vc-o and peak at 1,403 cm−1 suggests the existence of C-H bond (Zhu et al., 2011). The band detected at 823 cm−1 is attributed to CH2 rocking vibration (Badatya et al., 2021; Tang et al., 2012). The stretching vibrations of C-H and C-O at 2,917 cm−1 and 1,275 cm−1 indicate that GQDs contain some incompletely carbonized citric acid.
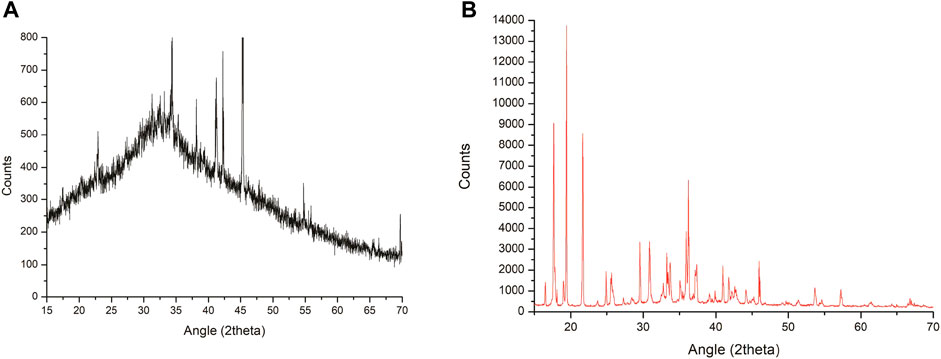
FIGURE 3. (A) XRD pattern of citric acid. (B) XRD pattern of GQD.
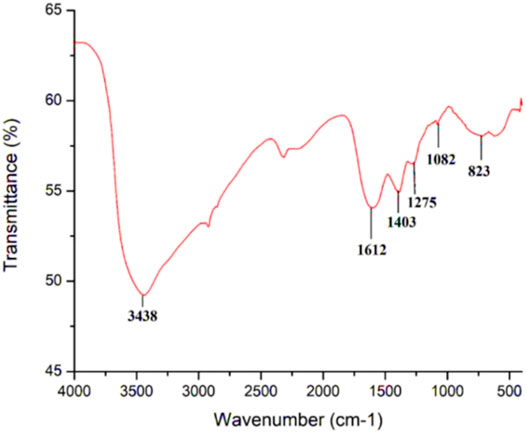
FIGURE 4. FTIR spectra of synthesis GQD.
The graphene quantum dots prepared at different carbonization temperature and time were subjected to irradiation by a UV-lamp to confirm their fluorescence. As evident from Figure 5B, the prepared samples displayed blue-colored luminescence under the 365 nm wavelength UV lamp. Similarly, the aqueous GQDs suspension is yellow to brown in color (Figure 5A) and transparent in the daylight. Furthermore, as can be seen in Figure 5A, in visible light the prepared GQD display a slight yellow hue in their aqueous solutions such that their intensity varies according to the reaction conditions. Likewise, the intensity of blue fluorescence also depends upon the reaction condition. Based on this observation, it can be seen that the GQD sample (160°C-50 min) displays the highest amount of fluorescence.

FIGURE 5. Image of all the prepared GQDs, in normal indoor lighting (A) and under a UV lamp (B).
Similarly, the absorption spectrum of GQDs in water was analyzed using a spectrophotometer (UVD-2950). Usually, two types of characteristic features are observed in the spectra of GQD, the first is a shoulder at ∼350 nm, corresponding to an n–π* plasmon peak. Another characteristic feature of GO appears at ∼ 230 nm and corresponds to a π–π* plasmon peak (Shen et al., 2012). As shown in Figure 6, the two peaks were observed at 236 and 358 nm. The intense peak present at 236 nm corresponds to GQDs, which is due to the free zigzag sites present in GQDs.
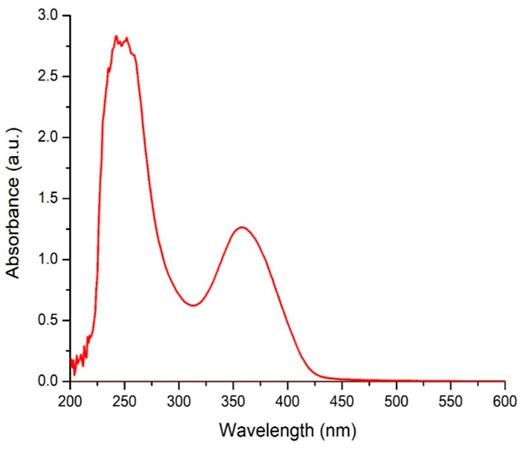
FIGURE 6. UV–Vis spectra of GQD dispersed in water, the peak observed at.236 nm refers to graphene quantum dots (GQDs)
In addition to that, Figure 7A depicts the fluorescence emission spectra under varying excitation of each prepared GQDs solution. These bands are mostly peaked at 460 nm confirming the fluorescence emission of GQD. Studies have shown that the size of GQDs is of critically important because it determines the excitation/emission band (Dong et al., 2012b). Usually in GQDs, numerous electronic transitional states occurred due to the molecular orbitals of C=C sp2 carbon domains and amino edges functional groups, and that is the reason of showing different emission spectra. As observed, the 160°C -50 min sample displays the highest fluorescence at 370 nm, so we chose this sample for our further experiments. Figure 7B corresponds to the excitation/emission spectrum of GQDs (160°C -50 min). It shows excitation maximum at 370 nm, whereas emission band maximum at 462 nm corresponding to the blue luminescence displayed. To further check the PL properties of GQDs, the effect of changing the excitation wavelength on the emission spectrum was analyzed. The excitation wavelength was varied in increasing in the increments of 10 such as 350, 360, 370, and 380 nm (Figure 7C). Moreover, from Figure 7C it is clearly observed that the emission band of 460 nm of the GQD is independent from the excitation wavelengths.
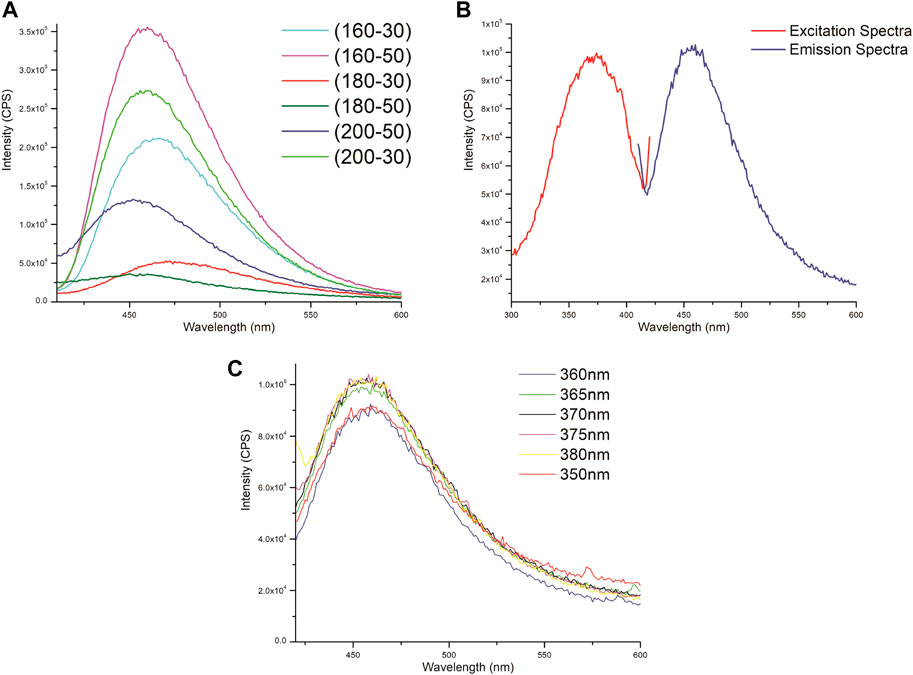
FIGURE 7. (A) Emission spectra of different GQDs prepared at different carbonization temperatures (160, 180, 200°C) and time (30 min and 50 mins) under the excitation wavelength of 370 nm. (B) Excitation/emission spectra of GQD (160°C -50 min). (C) Emission spectra of GQDs (160°C -50 min) at varying excitation wavelengths (350, 360, 370, 380 nm).
A 50 mM mixture of anions and cations (sodium phosphate, potassium acetate, potassium nitrate, magnesium sulfate, sodium carbonate, and sodium hydroxide) were taken in order to draw comparison of the quenching exclusivity of chloride ions. As Figure 8 demonstrates, sodium chloride shows considerable quenching compared to the other ionic compounds which proves that it exhibit quenching effect even in the presence of the other ions. Human specimens such as sweat are composed of a combination of multiple ions, it is important for the study to mimic that somehow. The carbonate ions present in the sodium carbonate adds certain compounds on the surface of the GQDs which causes an observable red shift in the spectra while the other compounds do not display any kind of shift in the emission spectra of graphene quantum dots.
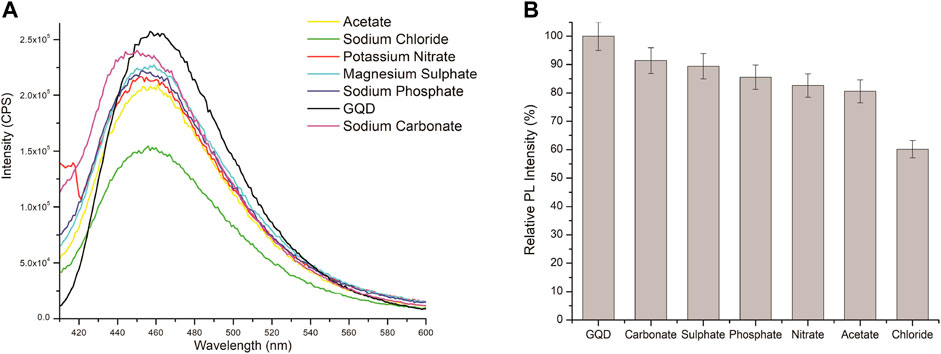
FIGURE 8. (A) PL spectra of GQD aqueous solutions with 50 mM of different ions (sodium phosphate, potassium acetate, sodium chloride, potassium nitrate, magnesium sulfate, sodium carbonate, and sodium hydroxide), λex = 370 nm. (B) Comparative quenching effect of multiple ions on the FL of GQD.
Furthermore, the quenching fluorescence patterns of NaCl with GQDs were monitored with various concentrations of NaCl ranging from 10 to 200 mM as shown in Figure 9. GQDs displayed a linear quenching curve until 90 mM of chloride ion concentration. It can be argued that at this concentration all the interacting sites are full and further addition causes the sites to clutter up showing an increased fluorescence. Moreover, the quenching capability of GQDs was also studied with potassium chloride, to ensure that the quenching effect is being observed due to chloride ions and not due to the cations. It can be seen in Figure 10, almost identical spectra were observed, hence confirming our initial observation that chloride ions are responsible for the quenching effect observed.
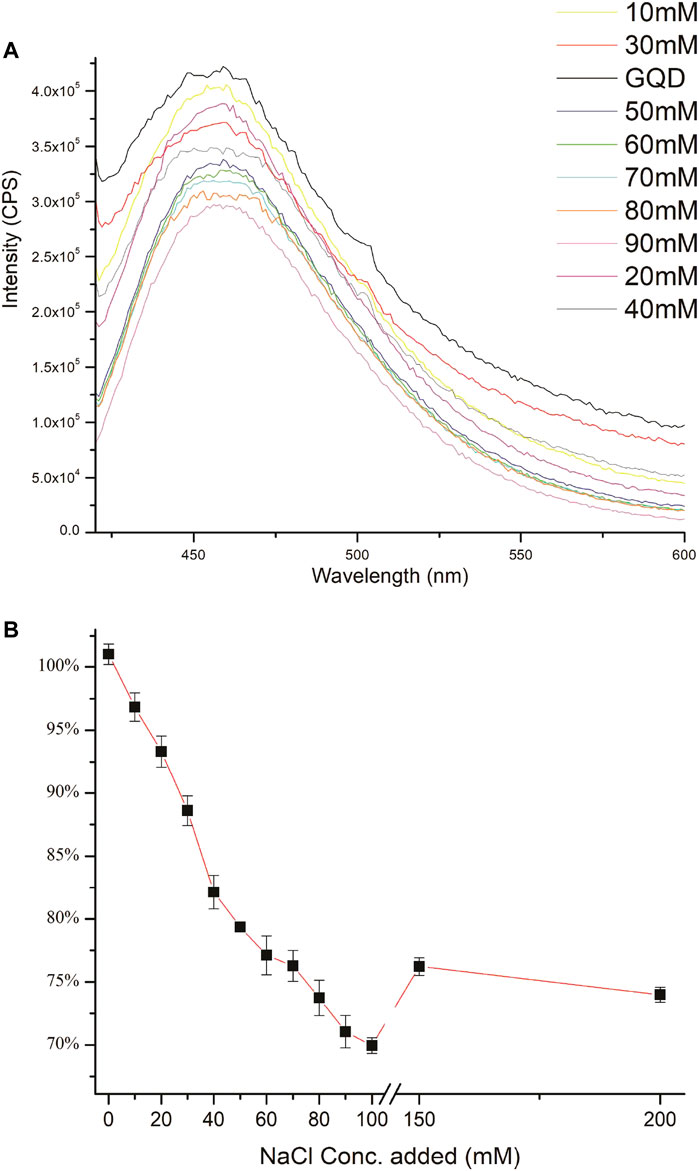
FIGURE 9. (A) Quenching effect of different concentrations of NaCl (ranging from 10 to 90 mM) on the FL of GQD. (B) Quenching of different concentrations of NaCl on the Fl of GQD (concentrations from left to right, 0, 10, 20, 40, 50, 60, 70, 80, 90, 150, and 200 mM).
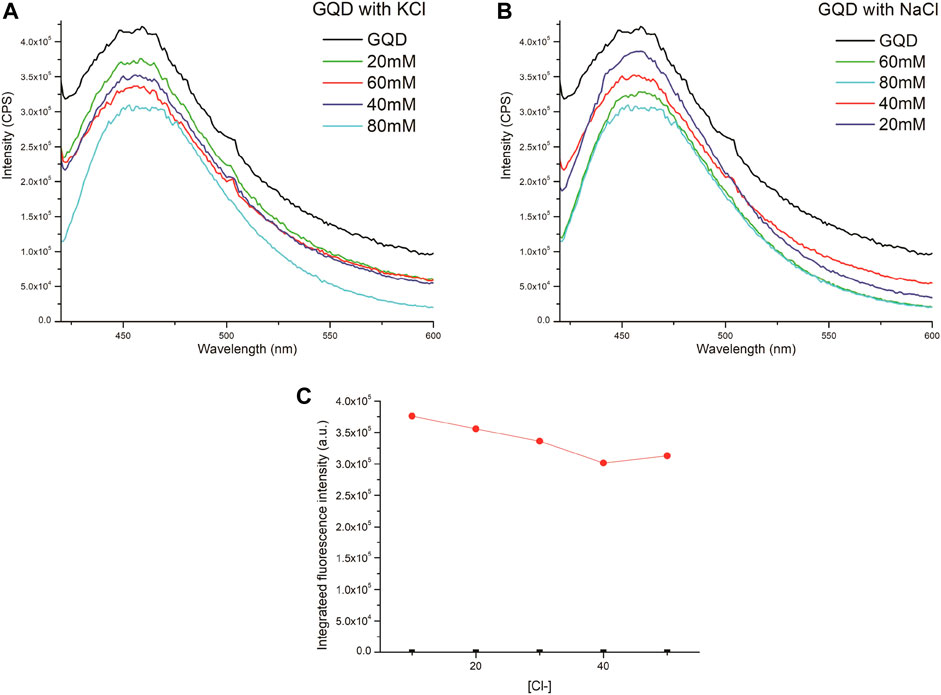
FIGURE 10. (A) Quenching effect of GQD with KCl (B) with NaCl. Figure (C) represents the quenching effect of KCl on the FL of GQD.
The attenuation of fluorescence in the quenching mechanism results from the presence of chloride ions, which lead to non-radiative relaxation of the excited graphene quantum dot. In accordance, dynamic quenching is characterized by linear dependence of fluorescence quenching; and non-linear behavior suggests that both the static and dynamic processes are taking place. In this study, the NaCl acts as a quencher; we plotted the peak fluorescence intensity (I0/I) vs. chloride ion concentration.
The calibration equation is as follows:
The results demonstrated a linear dependence the between Io/I and Cl-concentration, between the concentration range of 10–90 mM as shown in Figure 11. By increasing the chloride concentration beyond this concentration non-linearity is observed, which suggests that both static and dynamic quenching processes are occurring (Lakowicz, 1983).
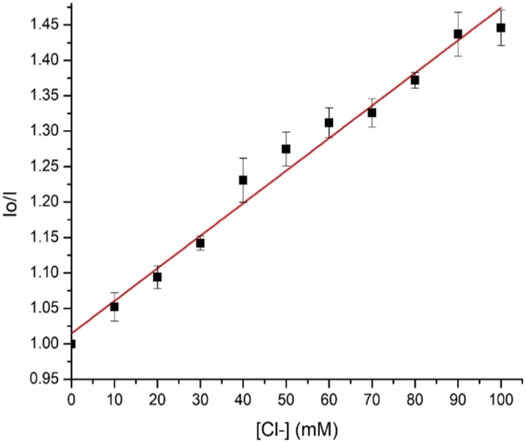
FIGURE 11. Stern–Volmer graph of GQD with the quencher Cl-.
In this study, the optical properties of the GQDs are investigated to monitor the changes in the chloride ions for the detection of cystic fibrosis. The GQDs are prepared by pyrolysis of citric acid showing disc-shaped having an average size of 15 nm. Additionally, they are amorphous particles displaying blue phospholuminescence (PL) with the maximum emission peak at 462 nm. The PL quenching effect of GQD was observed by the addition of chloride ions, which showed linearity in the range of 10–90 mM. Within this range, the GQD display a linear response to Cl− with a correlation coefficient of 0.98. The sensitivity and specificity to chloride ions suggest the potential application of this easily synthesized and the green GQD-based sensing system as an alternative route for the time-consuming method of laboratory sweat testing for the diagnosis of cystic fibrosis. It also provides an alternative to the expensive and toxic organic dyes that are rarely used in laboratory settings. This also paves the way for point-of-care testing, as the tests may be calibrated for hand-held fluorescence spectrophotometers.
Publicly available datasets were analyzed in this study. This data can be found here: The original contribution made in form of data generated is mentioned in the article. Any further information can be provided by corresponding author upon request.
All authors listed have made a substantial, direct, and intellectual contribution to the work and approved it for publication.
The authors declare that the research was conducted in the absence of any commercial or financial relationships that could be construed as a potential conflict of interest.
All claims expressed in this article are solely those of the authors and do not necessarily represent those of their affiliated organizations, or those of the publisher, the editors and the reviewers. Any product that may be evaluated in this article, or claim that may be made by its manufacturer, is not guaranteed or endorsed by the publisher.
The Supplementary Material for this article can be found online at: https://www.frontiersin.org/articles/10.3389/fmats.2022.857432/full#supplementary-material.
Badatya, S., Kumar, A., Sharma, C., Srivastava, A. K., Chaurasia, J. P., and Gupta, M. K. (2021). Transparent Flexible Graphene Quantum dot-(PVDF-HFP) Piezoelectric Nanogenerator. Mater. Lett. 290, 129493. doi:10.1016/j.matlet.2021.129493
Bhattacharyya, S. K., Dule, M., Paul, R., Dash, J., Anas, M., Mandal, T. K., et al. (2020). Carbon Dot Cross-Linked Gelatin Nanocomposite Hydrogel for pH-Sensing and pH-Responsive Drug Delivery. ACS Biomater. Sci. Eng. 6 (10), 5662–5674. doi:10.1021/acsbiomaterials.0c00982
Bray, P. T., Clark, G. C. F., Moody, G. J., and Thomas, J. D. R. (1977). Sweat Testing for Cystic Fibrosis: Errors Associated with the In-Situ Sweat Test Using Chloride Ion Selective Electrodes. Clinica Chim. Acta 80 (2), 333–338. doi:10.1016/0009-8981(77)90041-9
Cui, K.-H., Haan, E. A., Wang, L.-J., and Matthews, C. D. (1995). Optimal Polymerase Chain Reaction Amplification for Preimplantation Diagnosis in Cystic Fibrosis ((Delta)F508). BMJ 311 (7004), 536–540. doi:10.1136/bmj.311.7004.536
Das, P., Bhattacharyya, S. K., Banerji, P., and Das, N. C. (2021). Acoustic Cavitation Assisted Synthesis and Characterization of Photoluminescent Carbon Quantum Dots for Biological Applications and Their Future Prospective. Nano-Structures & Nano-Objects 25, 100641. doi:10.1016/j.nanoso.2020.100641
Das, R., Rajender, G., and Giri, P. K. (2018). Anomalous Fluorescence Enhancement and Fluorescence Quenching of Graphene Quantum Dots by Single Walled Carbon Nanotubes. Phys. Chem. Chem. Phys. 20 (6), 4527–4537. doi:10.1039/C7CP06994D
De Gregorio, C., Lentini, C., Grimaldi, P., Zagari, D., Andò, G., Di Bella, G., et al. (2014). P-wave Voltage and Peaking on Electrocardiogram in Patients Undergoing Head-Up Tilt Testing for History of Syncope. Eur. J. Intern. Med. 25 (4), 383–387. doi:10.1016/j.ejim.2014.03.007
Dong, Y., Li, G., Zhou, N., Wang, R., Chi, Y., and Chen, G. (2012b). Graphene Quantum Dot as a Green and Facile Sensor for Free Chlorine in Drinking Water. Anal. Chem. 84 (19), 8378–8382. doi:10.1021/ac301945z
Dong, Y., Shao, J., Chen, C., Li, H., Wang, R., Chi, Y., et al. (2012a). Blue Luminescent Graphene Quantum Dots and Graphene Oxide Prepared by Tuning the Carbonization Degree of Citric Acid. Carbon 50 (12), 4738–4743. doi:10.1016/j.carbon.2012.06.002
Esteves, C. Z., Dias, L. D. A., Lima, E. D. O., de Oliveira, D. N., Melo, C. F. O. R., Delafiori, J., et al. (2018). Skin Biomarkers for Cystic Fibrosis: A Potential Non-invasive Approach for Patient Screening. Front. Pediatr. 5 (January), 1–8. doi:10.3389/fped.2017.00290
Fan, Z., Li, S., Yuan, F., and Fan, L. (2015). Fluorescent Graphene Quantum Dots for Biosensing and Bioimaging. RSC Adv. 5 (25), 19773–19789. doi:10.1039/C4RA17131D
Farrell, P. M., Kosorok, M. R., Rock, M. J., Laxova, A., Zeng, L., Lai, H.-C., et al. (2001). Early Diagnosis of Cystic Fibrosis through Neonatal Screening Prevents Severe Malnutrition and Improves Long-Term Growth. Pediatrics 107 (1), 1–13. doi:10.1542/peds.107.1.1
Ganguly, S., Das, P., Das, S., Ghorai, U., Bose, M., Ghosh, S., et al. (2019). Microwave Assisted green Synthesis of Zwitterionic Photolumenescent N-Doped Carbon Dots: An Efficient 'on-Off' Chemosensor for Tracer Cr(+6) Considering the Inner Filter Effect and Nano Drug-Delivery Vector. Colloids Surf. A: Physicochemical Eng. Aspects 579, 123604. doi:10.1016/j.colsurfa.2019.123604
Golubnitschaja, O. (2009). Paradigm Change from Curative to Predictive Medicine: Novel Strategic Trends in Europe. Croat. Med. J. 50 (6), 596–597. doi:10.3325/cmj.2009.50.596
Horsley, A., and Siddiqui, S. (2015). Putting Lung Function and Physiology into Perspective: Cystic Fibrosis in Adults. Respirology 20 (1), 33–45. doi:10.1111/resp.12382
Kundu, S., and Pillai, V. K. (2020). Synthesis and Characterization of Graphene Quantum Dots. Phys. Sci. Rev. 5 (4). doi:10.1515/psr-2019-0013
Lakowicz, J. R. (1983). Quenching of fluorescence. Principles of fluorescence spectroscopy, 257–301.
Lai, S., Jin, Y., Shi, L., Zhou, R., Zhou, Y., and An, D. (2020). Mechanisms behind Excitation- and Concentration-dependent Multicolor Photoluminescence in Graphene Quantum Dots. Nanoscale 12 (2), 591–601. doi:10.1039/C9NR08461D
LeGrys, V. A., Applequist, R., Briscoe, D. R., Farrell, P., Hickstein, R., Lo, S. F., et al. (2009). Sweat Testing: Sample Collection and Quantitative Chloride Analysis; Approved Guideline. Clin. Lab Stand Ins. 29 (Suppl 27), C34-A2.
Li, J., and Zhu, J.-J. (2013). Quantum Dots for Fluorescent Biosensing and Bio-Imaging Applications. Analyst 138 (9), 2506–2515. doi:10.1039/C3AN36705C
Li, L., Wu, G., Yang, G., Peng, J., Zhao, J., and Zhu, J.-J. (2013). Focusing on Luminescent Graphene Quantum Dots: Current Status and Future Perspectives. Nanoscale 5 (10), 4015–4039. doi:10.1039/C3NR33849E
Li, Z., Cao, L., Qin, P., Liu, X., Chen, Z., Wang, L., et al. (2018). Nitrogen and Oxygen Co-doped Graphene Quantum Dots with High Capacitance Performance for Micro-supercapacitors. Carbon 139, 67–75. doi:10.1016/j.carbon.2018.06.042
Lin, L., Rong, M., Luo, F., Chen, D., Wang, Y., and Chen, X. (2014). Luminescent Graphene Quantum Dots as New Fluorescent Materials for Environmental and Biological Applications. Trac Trends Anal. Chem. 54, 83–102. doi:10.1016/j.trac.2013.11.001
McClatchey, K. D. (2002). Clinical Laboratory Medicine. Philadelphia, Pennsylvania, United States: Lippincott Williams & Wilkins.
Ooi, C. Y., and Durie, P. R. (2016). Cystic Fibrosis from the Gastroenterologist's Perspective. Nat. Rev. Gastroenterol. Hepatol. 13 (3), 175–185. doi:10.1038/nrgastro.2015.226
Ponomarenko, L. A., Schedin, F., Katsnelson, M., Yang, R., Hill, E., Novoselov, K., et al. (2008). Chaotic Dirac Billiard in Graphene Quantum Dots. Science 320 (5874), 356–358. doi:10.1126/science.1154663
Qi, B.-P., Hu, H., Bao, L., Zhang, Z.-L., Tang, B., Peng, Y., et al. (2015). An Efficient Edge-Functionalization Method to Tune the Photoluminescence of Graphene Quantum Dots. Nanoscale 7 (14), 5969–5973. doi:10.1039/C5NR00842E
Quinton, P. M. (1983). Chloride Impermeability in Cystic Fibrosis. Nature 301 (5899), 421–422. doi:10.1038/301421a0
Saravanan, A., Maruthapandi, M., Das, P., Ganguly, S., Margel, S., Luong, J. H. T., et al. (2020). Applications of N-Doped Carbon Dots as Antimicrobial Agents, Antibiotic Carriers, and Selective Fluorescent Probes for Nitro Explosives. ACS Appl. Bio Mater. 3 (11), 8023–8031. doi:10.1021/acsabm.0c01104
Shen, J., Zhu, Y., Yang, X., and Li, C. (2012). Graphene Quantum Dots: Emergent Nanolights for Bioimaging, Sensors, Catalysis and Photovoltaic Devices. Chem. Commun. 48 (31), 3686–3699. doi:10.1039/C2CC00110A
Simmonds, N. J., Cullinan, P., and Hodson, M. E. (2009). Growing Old with Cystic Fibrosis - the Characteristics of Long-Term Survivors of Cystic Fibrosis. Respir. Med. 103 (4), 629–635. doi:10.1016/j.rmed.2008.10.011
Sun, H., Wu, L., Wei, W., and Qu, X. (2013). Recent Advances in Graphene Quantum Dots for Sensing. Mater. Today 16 (11), 433–442. doi:10.1016/j.mattod.2013.10.020
Tang, L., Ji, R., Cao, X., Lin, J., Jiang, H., Li, X., et al. (2012). Deep Ultraviolet Photoluminescence of Water-Soluble Self-Passivated Graphene Quantum Dots. ACS Nano 6 (6), 5102–5110. doi:10.1021/nn300760g
Vashist, S. K. (2017). ‘Point-of-care Diagnostics: Recent Advances and Trends’. Biosensors 7 (4), 10–13. doi:10.3390/bios7040062
Wang, K., Dong, J., Sun, L., Chen, H., Wang, Y., Wang, C., et al. (2016). Effects of Elemental Doping on the Photoluminescence Properties of Graphene Quantum Dots. RSC Adv. 6 (94), 91225–91232. doi:10.1039/C6RA19673J
Wang, L.-L., Liu, Y.-H., Meng, L.-L., Li, C. G., and Zhou, S.-F. (2011). Phenotype Prediction of Non-synonymous Single-Nucleotide Polymorphisms in Human ATP-Binding Cassette Transporter Genes. Basic Clin. Pharmacol. Toxicol. 108 (2), 94–114. doi:10.1111/j.1742-7843.2010.00627.x
Wu, J., Pisula, W., and Müllen, K. (2007). Graphenes as Potential Material for Electronics. Chem. Rev. 107 (3), 718–747. doi:10.1021/cr068010r
Yager, P., Domingo, G. J., and Gerdes, J. (2008). Point-of-Care Diagnostics for Global Health. Annu. Rev. Biomed. Eng. 10, 107–144. doi:10.1146/annurev.bioeng.10.061807.160524
Keywords: graphene quantum dot (GQD), cystic fbrosis, chloride ions (Cl-), fluorescence quenching, citric acid
Citation: Ifrah Z, Shah Rukh A, Muhammad Nauman S, Maryam S and Rahat U (2022) Fluorescence Quenching of Graphene Quantum Dots by Chloride Ions: A Potential Optical Biosensor for Cystic Fibrosis. Front. Mater. 9:857432. doi: 10.3389/fmats.2022.857432
Received: 18 January 2022; Accepted: 17 February 2022;
Published: 07 April 2022.
Edited by:
Poushali Das, Bar-Ilan University, IsraelReviewed by:
Sayan Ganguly, Bar-Ilan University, IsraelCopyright © 2022 Ifrah, Shah Rukh, Muhammad Nauman, Maryam and Rahat. This is an open-access article distributed under the terms of the Creative Commons Attribution License (CC BY). The use, distribution or reproduction in other forums is permitted, provided the original author(s) and the copyright owner(s) are credited and that the original publication in this journal is cited, in accordance with accepted academic practice. No use, distribution or reproduction is permitted which does not comply with these terms.
*Correspondence: Abbas Shah Rukh, c2FiYmFzQGFzYWIubnVzdC5lZHUucGs=
Disclaimer: All claims expressed in this article are solely those of the authors and do not necessarily represent those of their affiliated organizations, or those of the publisher, the editors and the reviewers. Any product that may be evaluated in this article or claim that may be made by its manufacturer is not guaranteed or endorsed by the publisher.
Research integrity at Frontiers
Learn more about the work of our research integrity team to safeguard the quality of each article we publish.