 Wang Qing-li1
 Peng Kuan
- 1School of Civil Engineering, University of Science and Technology Liaoning, Anshan, China
- 2School of Mechatronic Engineering, Southwest Petroleum University, Chengdu, China
In order to study the test performance of the concrete-filled CFRP steel tubular (CF-CFRP-ST) beam-column under hysteretic load, 12 specimens were designed. During the test loading, the effects of axial compression ratio and longitudinal CFRP reinforcement coefficient on hysteric load were studied. Based on experimental research, a finite element method for establishing CF-CFRP-ST beam-column is proposed by FE simulation, and the influence of main parameters on performance is studied by this method. The test results show that CFRP and the steel tube can work together well, and the local buckling of specimens is delayed. In addition, the simulation results are in good agreement with the experimental results. Based on the experiment and finite element method, the influence of main parameters on the hysteretic behavior of specimens is studied.
1 Introduction
As a kind of building material with high bearing capacity and convenient construction, the forthputting of the concrete-filled tubular (CFT) structure has gradually improved in recent decades (Li et al., 2016). However, the corrosion of the concrete-filled steel tubular outer wall directly affects its durability and bearing capacity in the process of use (Li et al., 2018). Carbon fiber reinforced plastics (CFRP) are widely used in the civil engineering field because of their lightweight and low cost. Concrete is poured into the prefabricated steel tube, and the outside of the steel pipe is wrapped with CFRP to make a concrete-filled CFRP steel tube (Che et al., 2012).
Park et al. (2011) studied the axial compression performance and compression-bending performance of CFRP-concrete-filled steel tube. In the axial compression test, the cross-sectional width–thickness ratio of the specimen and the number of CFRP layers are used as parameters. Wrap the carbon fiber material on the test piece to improve the ductility of the test piece and increase the pressure resistance of the test piece. The concrete strength and the number of CFRP layers are used as parameters under the compression-bending loading. CFRP improves the hysteresis performance of the specimen and has a certain effect on the improvement of the overall bearing capacity of the specimen. Nie et al. (2013) conducted a study on the flexural-shear-torsion coupling bearing capacity of concrete-filled steel tube short columns and concluded that the failure mechanism of concrete-filled steel tube short columns was significantly affected by the bending moment-torque ratio. The short column has good ductility. Increasing the torque significantly reduces the ultimate flexural bearing capacity of the concrete-filled steel tube short column. A nonlinear finite element analysis was carried out to accurately predict the ultimate bearing capacity of concrete-filled steel tube short columns under the coupling of bending, shear, and torsion. According to the regression results of finite element parameter analysis, a simplified design formula for calculating the B-S-T coupling bearing capacity of concrete-filled steel tube short columns is proposed. Tao et al. found that square the CFRP-CFST specimens’ bearing capacity was reduced significantly after fire damage (Tao et al., 2007a; Tao et al., 2007b). Alam et al. (2017) conducted a study on the dynamic performance of FRP reinforced concrete-filled steel tube members under lateral impact loads and conducted mid-span lateral impact tests on 16 concrete-filled steel tube specimens. The research results show that FRP cloth can reduce the permanent lateral displacement of concrete-filled steel tube members by 18.2%. The effects of FRP type, FRP coating direction, number of carbon fiber reinforced polymer (CFRP) coating layers, coating length, and impact speed on the properties of reinforced CFST specimens were studied. CFRP laminates exhibit weak performance only when wound in the longitudinal direction under impact load. However, the longitudinal layer and circumferential lamination of carbon fiber composite materials can significantly reduce the severity of damage and failure of carbon fiber composite materials under the transverse impact on concrete-filled steel tube specimens. Cao (2015) conducted an experimental study on the performance of rectangular concrete-filled steel tube columns under reciprocating eccentric tension and compression loads. In practical application, members often also bear hysteretic loads, such as wind and earthquake load.
Accordingly, 12 specimens were designed. During the test loading, the effects of axial compression ratio and longitudinal CFRP reinforcement coefficient were studied under hysteric load. Based on experimental research, a finite element method for establishing CF-CFRP-ST bending member is proposed by finite element simulation. The influence of the main parameters on the performance is studied by this method to provide some theoretical reference for engineering practice.
2 Raw Material Performance and Experimental Design
2.1 Performance of Raw Materials
2.1.1 Steel
The measured material properties of the steel tube are shown in Table 1, where fy is the yield strength, fu is the tensile strength, Es is the elastic modulus, εsy is the yield strain, vs is Poisson’s ratio, and ε′ is the elongation of steel.
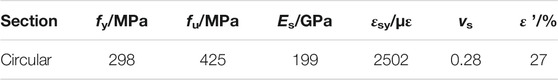
TABLE 1. The performance of the steel tube.
2.1.2 Concrete
The particle size of coarse aggregate gravel of concrete is 5–15 mm. The compressive strength of the concrete cube (fcu) is 47.8 MPa, and the elastic modulus (Ec) is 34.6 GPa. The compressive strength of the concrete cube is 77.7 MPa during the hysteretic test.
2.1.3 Carbon Fiber
Carbon fiber fabric is a unidirectional fabric woven by Toray T-700 12K carbon fiber in Japan. The thickness of the single layer and the weight of CFRP are 0.111 mm and 200 g/m3, respectively. Elongation at break of CFRP is 2.1%, and the tensile strength of the monofilament is 4.9 GPA.
2.2 Test Design
Twelve CF-CFRP-ST specimens were designed. Axial compression ratio (n) and longitudinal CFRP reinforcement coefficient (η) are the main parameters in the test:
Specimens’ length is 2000 mm, the outer diameter is 140 mm, and the steel tube’s thickness is 4 mm. One-layer transverse CFRP is tied in CFST. ml is the number of longitudinal CFRP layers. N0 is the axial force applied to the specimen. Nu is axial load-bearing capacity. Δy is yield displacement of the specimen. Specific indexes of the specimen are shown in Table 2. The loading test’s equipment is shown in Figure 1. The schematic diagram of the C-CF-CFRP-ST specimen is shown in Supplementary Figure S1.
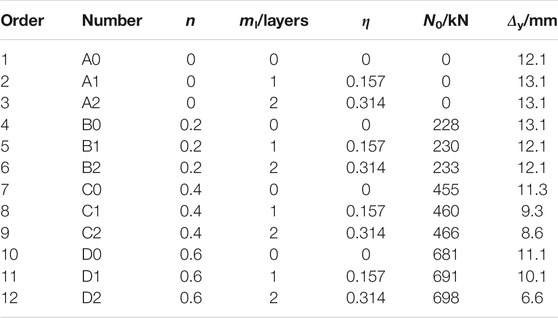
TABLE 2. Specific indexes of specimens.
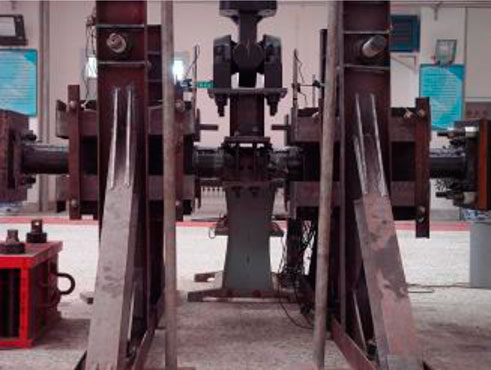
FIGURE 1. Loading test’s equipment.
Specimens were loaded during the method of loading-displacement control. The loading protocol of C-CF-CFRP-ST specimens is shown in Supplementary Figure S2. The loading control method was used in stages at the initial stage according to 0.25 Puc (Puc is the estimated lateral bearing capacity, and the calculation of Puc is suggested by Han et al. (2001) and Peng et al. (2022) as 0.5 Puc and 0.7 Puc. After two cycles per stage, the displacement control method was used according to 1.0, 1.5, 2.0, 3.0, 5.0, 7.0, and 8.0 Δy (Δy = Puc/K0.7), and the secant stiffness of P-Δ skeleton curve when K0.7 is 0.7 Puc.
3 Test Results and Analysis
3.1 Test Phenomena
For small axial pressure specimens (n
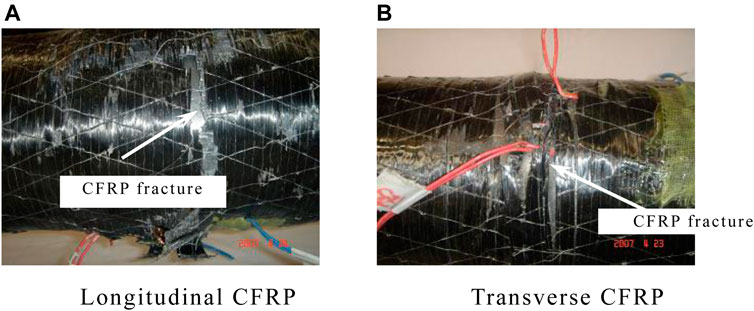
FIGURE 2. CFRP of small axial compression ratio’s specimens. (A) Longitudinal CFRP. (B) Transverse CFRP.
Figure 3A shows that specimen’s change at the initial loading stage is basically the same as that of the specimen with a small axial compression ratio. After loading to the later stage, the CFRP of the specimen began to fracture gradually. For the specimen with only transverse CFRP, the CFRP began to break gradually, as shown in Figure 3B. Unlike the small axial compression ratio, the failure degree of the specimen under the large axial compression ratio is more serious because, with the increase in axial force, when the energy consumption of the member is greater, the macroscopic performance means that the member failure is more serious.
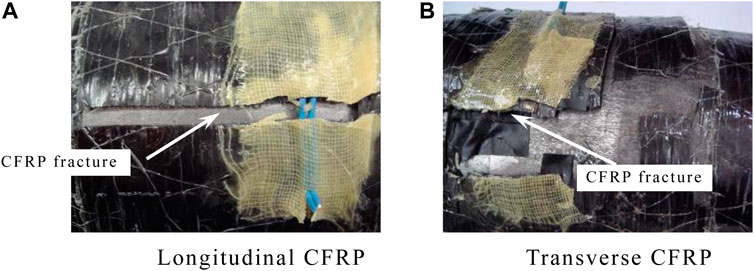
FIGURE 3. CFRP of large axial compression ratio’s specimens. (A) Longitudinal CFRP. (B) Transverse CFRP.
It can be found that the damage degree of the specimen decreases with the increase in η. After the failure of the loaded specimen, it can be seen that there are some small protrusions in the specimen. Figures 4A,B shows the damage situation of concrete. Both concrete and steel tube have an obvious bulge in the middle of the specimen, indicating that the cooperative working performance of the concrete and steel tube is good. All specimens after loading are shown in Supplementary Figure S3.
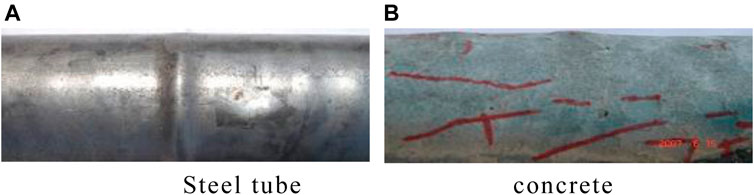
FIGURE 4. Internal and external damage of specimen failure. (A) Steel tube. (B) concrete.
3.2 P-Δ Curve
The P-Δ curve of the specimen is the most intuitive reflection between member load and displacement, and the most representative group of the m = 2 specimens are selected. It can be seen that all groups of specimens show good performance in the process of bearing hysteretic load, and the curves are full without a pinch, as shown in Figure 5.
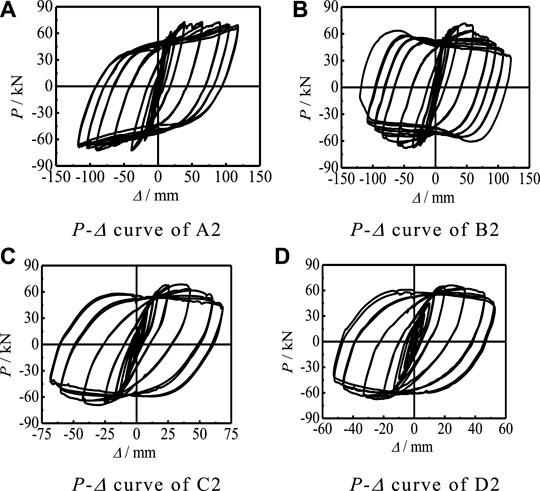
FIGURE 5. P-Δ curves of specimens with ml = 2. (A) P-Δ curve of A2. (B) P-Δ curve of B2. (C) P-Δ curve of C2. (D) P-Δ curve of D2.
3.2.1 Skeleton Curve
The P-Δ skeleton curves of specimens are shown in Supplementary Figure S4.
3.3 M-ϕ Skeleton Curve
Supplementary Figure S5 shows the deflection curve shape of the most representative A2 specimen. Herein, the curvature and bending moment of the middle section of the specimen are calculated by formulas (2) and (3), respectively:
where ϕ is the curvature of the middle section, um is the deflection of the middle section, p is the lateral bearing capacity, and N0 is the axial force.
3.3.1 M-ϕ Hysteresis Curve
Figure 6 shows that the M-ϕ hysteretic curves of each group have no obvious pinch phenomenon. When the force control is adopted at the initial loading stage, the deformation of the specimen is elastic. After the displacement control, the component produces a less obvious Bauschinger effect, and the curves of each group become full with the decrease in the axial compression ratio.
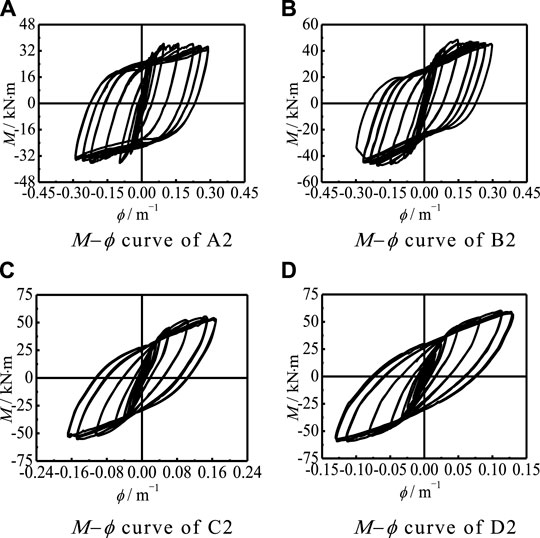
FIGURE 6. Μ−ϕ curve of partial specimens. (A) The Μ−ϕ curve of A2. (B) The Μ−ϕ curve of B2. (C) The Μ−ϕ curve of C2. (D) The Μ−ϕ curve of D2.
3.3.2 M-ϕ Skeleton Curve
Supplementary Figure S6 shows the influence of n and η on the M-ϕ skeleton curve. The increase in the axial compression ratio and longitudinal CFRP reinforcement coefficient can improve the bending capacity of the specimens, and the change of the axial compression ratio is more sensitive to the bending capacity of the specimens.
3.4 Strain Relationship
3.4.1 Strain of Steel Tube and CFRP
In order to ensure the accuracy of the test results, the transverse strain curves (P-εt) of the steel tube and CFRP at two test points of B0 specimens were compared, as shown in Figures 7A,B. In the same way, the transverse strain curves (P-ε1) at the same two test points of B0 specimens are compared, as shown in Figures 7C,D, where εst and εcft are the transverse strains of the steel tube and CFRP, and εsl and εcfl are the longitudinal strains of the steel tube and CFRP. The transverse and longitudinal strains of the steel tube and CFRP are consistent, indicating that, under the action of hysteretic force, the steel tube and CFRP can work together in transverse and longitudinal directions.
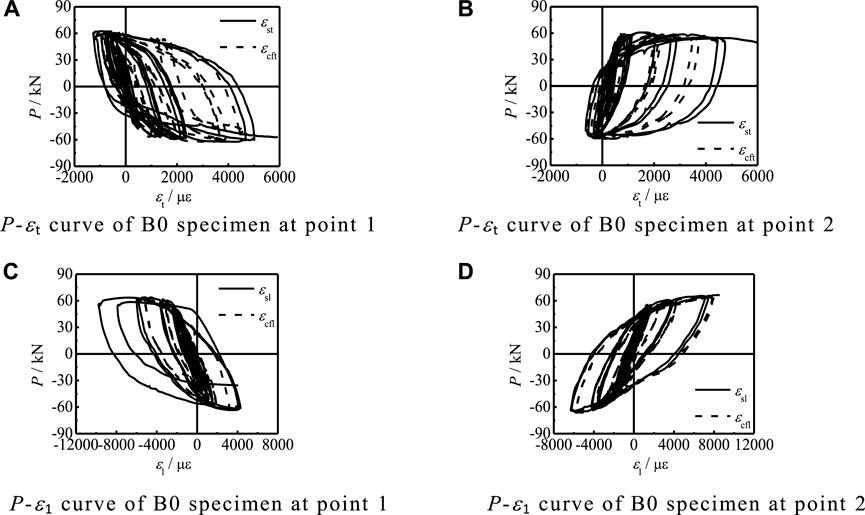
FIGURE 7. P-εt and P-ε1 curves of steel tube and CFRP at two test points of B0 specimen. (A) The P-εt curve of B0 specimen at point 1. (B) P-εt curve of B0 specimen at point 2. (C)P-ε1 curve of B0 specimen at point 1. (D) P-ε1 curve of B0 specimen at point 2.
3.4.2 Comparison of Transverse and Longitudinal Strains of Steel Tube
Figure 8 shows the comparison curve of the transverse and longitudinal strains of the steel tube (P-εs) in partial specimens. The signs of longitudinal strain εsl and transverse strain εst of specimens at the same point are different. When the specimens are subjected to longitudinal compression, they are subjected to transverse tension at the same time, and when subjected to longitudinal tension, they are subjected to transverse compression at the same time.
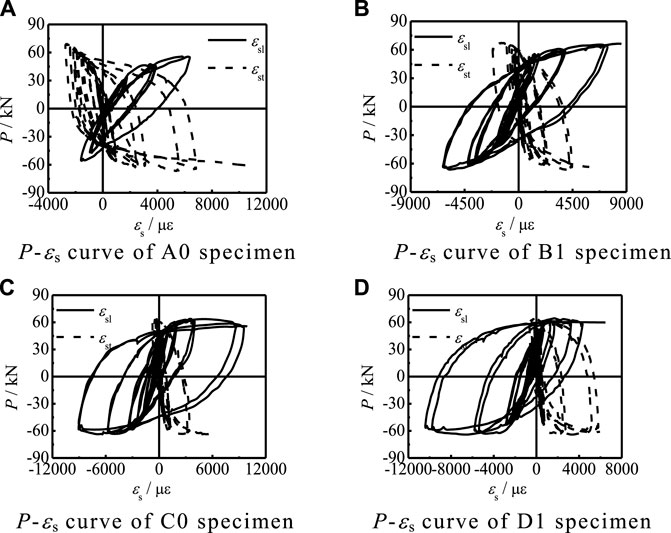
FIGURE 8. TheP-εs curves of partial specimens. (A) The P-εs curve of the A0 specimen. (B) The P-εs curve of the B1 specimen. (C) The P-εs curve of the C0 specimen. (D) The P-εs curve of the D1 specimen.
4 Analysis of Main Indicators
4.1 Strength Degradation
According to Wang and Shao’s method (2015), the strength degradation coefficient λji is determined. Figure 9 shows the strength degradation of the specimen. It is obvious from Figure 9 that the strength degradation of the round specimen is not obvious.
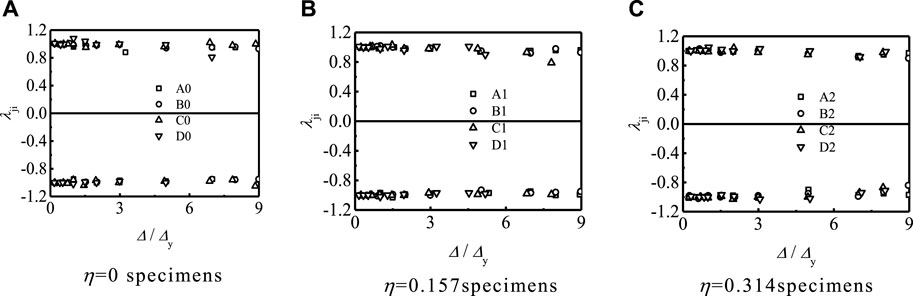
FIGURE 9. Strength degradation of specimens. (A) η = 0 specimens. (B) η = 0.157 specimens. (C) η = 0.314 specimens.
4.2 Stiffness Degradation
The stiffness EI of each cycle was determined according to Wang et al.’s method (2016). Figures 10A,B show the effects of n and η on the stiffness degradation, respectively, where EIΔ=0 is the initial stiffness of the specimens. Figure 10 shows that the increase in n can delay the stiffness degradation of the specimen. In addition, the increase in η can delay the stiffness degradation of the specimen because, with the increase in the number of CFRP layers, the ability to delay buckling of members is significantly improved, and the macroscopic performance is that the energy dissipation is slow.
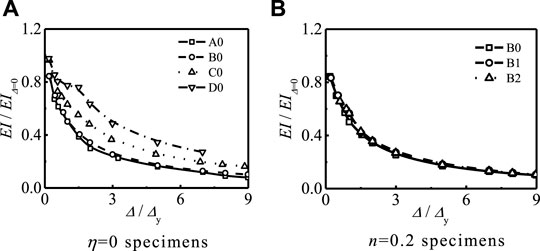
FIGURE 10. Effect of n and η on stiffness degradation of specimens. (A) η = 0 specimens. (B) n = 0.2 specimens.
4.3 Displacement Ductility Factor
The specimen ductility is calculated by the following displacement ductility coefficient μ:
where Δu is the corresponding displacement when the load on the skeleton line decreases by 15%.
The comparison of the ductility coefficient of each group of specimens is shown in Figure 11. Since the load of n = 0 specimen does not drop to 85% of its peak bearing capacity at the end of the test, it is impossible to determine its ductility coefficient, which is taken as a larger value in comparison. It can be seen from Figure 11 that, in terms of the overall trend, the increase in n and η will reduce the specimen ductility. The reason is that the larger n and η is, the more the failure mode of the specimen tends to the brittle failure mode of the concrete being crushed.
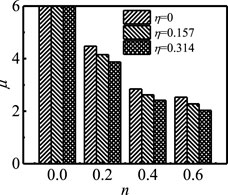
FIGURE 11. Comparison of specimens’ displacement ductility coefficient μ.
5 Finite Element Simulation
5.1 Stress-Strain Relationship
The stress-strain relationship is shown in the supplementary materials.
5.2 Division of Mesh and Interactions
The division of mesh and interactions is shown in the supplementary materials.
5.3 Finite Element Calculation Model
Finite element calculation model is shown in supplementary materials.
5.4 Comparison of FE Simulation and Test Results
Figure 12 and Supplementary Figure S8 show the comparison between the result of the FE model and the test about P-Δ curve and P-Δ skeleton curve. For the hysteresis and the skeleton curves, the most important indicators are the bearing capacity and the previous stiffness. Through calculations, Supplementary Table S1 shows that the error between the initial stiffness of the component simulation and the initial stiffness of the test is within 20%. The error between the simulated load-bearing capacity of the component and the test load-bearing capacity is within 20%.
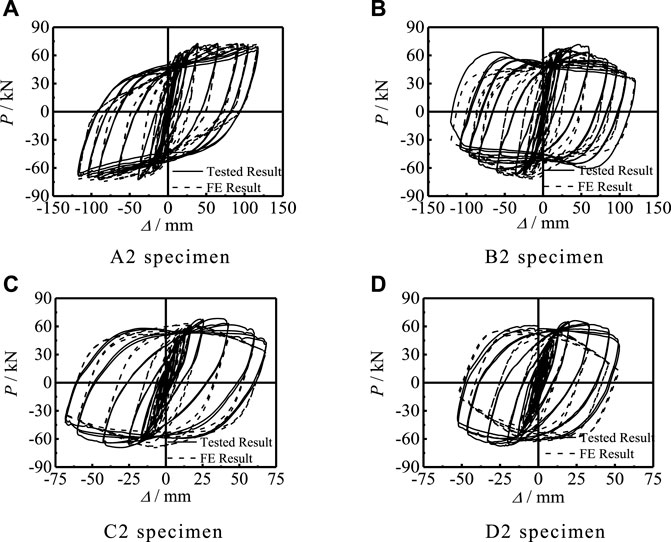
FIGURE 12. Comparison of FE and test results of P-Δ curves of specimens. (A) A2 specimen. (B) B2 specimen. (C) C2 specimen. (D) D2 specimen.
Figures 13, 14, respectively, show the comparison of the failure modes of steel pipe and concrete. Combined with the comparison of the P-Δ and P-Δ skeleton curves, the finite element calculation method for the compression-bending hysteresis specimen has a certain reference. The finite element result calculated by this method is in good agreement with test results.
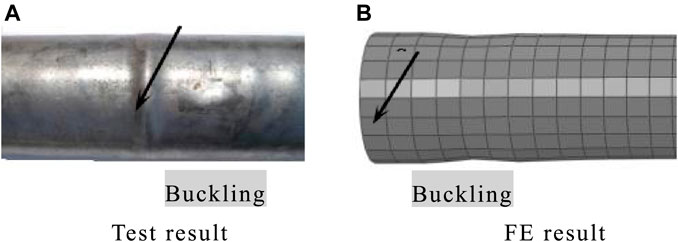
FIGURE 13. Failure modes of steel tube. (A) Test result. (B) FE result
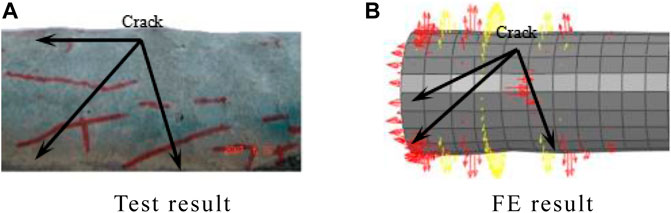
FIGURE 14. Failure modes of concrete with the middle section. (A) Test result. (B) FE result.
6 Parameter Analysis
Based on the reliable finite element model, parameter analysis is researched. The axial compression ratio, slenderness ratio, number of CFRP layers, steel yield strength, concrete strength, and steel ratio are the main indexes to evaluate the performance, which have a significant influence on the skeleton curve of members with compression-bending hysteretic behavior. Therefore, a typical example is used to analyze the influence of the above parameters on the p-Δ skeleton curve of members.
6.1 Influence of Axial Compression Ratio n and Slenderness Ratio λ
Figure 15 shows the effect of axial compression ratio on the P-Δ skeleton curve of members. The increase in n, the bearing capacity, and the stiffness of the elastic stage of the member decrease significantly. The shape of the curve also has obvious changes: when n = 0, there is no descending segment in the P-Δ skeleton curve. With the increase in n, the descending segment appears in the curve and the amplitude of the descending segment increases because, with the increase in the axial compression ratio, the energy lost in the loading process is large, resulting in the earlier unloading point of the component, and the macro performance means the component is more vulnerable to damage. Figure 16 shows the effect of λ on the P-Δ skeleton curve. It can be seen that the bearing capacity and the stiffness of the elastic stage of the member decrease significantly with the increase in λ, the shape of the curve also has obvious change, and the stability coefficient decreases with the increase in λ. With the increase in the slenderness ratio, the member is more prone to instability during loading. With the increase in load, the damage in the middle of the member increases significantly with the increase in the slenderness ratio, the bearing capacity of the member decreases significantly, and the curve unloading point appears earlier.
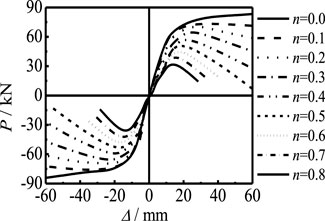
FIGURE 15. Effect of n on the P-Δ skeleton curve of specimens.
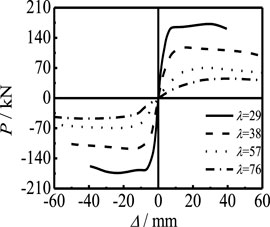
FIGURE 16. Effect of λ on the P-Δ skeleton curve of specimens.
6.2 Effect of CFRP Layers
Figure 17 shows the effect of the number of longitudinal CFRP layers on the P-Δ skeleton curve of members. With the increase in ml, the initial stiffness of the elastic stage is basically unchanged and the bearing capacity of the member is slightly increased. Figure 18 shows the effect of the number of transverse CFRP layers on the P-Δ skeleton curve of members. It can be seen that, with the increase in mt, the initial stiffness stage has no obvious changes, and the bearing capacity of the member increases slightly. There is no obvious relationship between CFRP and member stiffness, but CFRP can significantly improve the restraint effect on members. Therefore, increasing the number of layers of CFRP will not affect the stiffness of the curve, but the bearing capacity will be slightly improved.
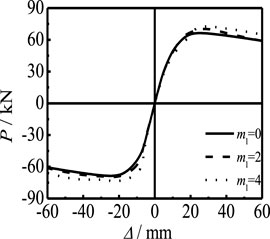
FIGURE 17. Effect of m1 on the P-Δ skeleton curve of specimens.
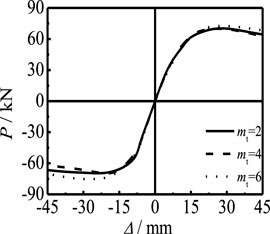
FIGURE 18. Effect of mt on the P-Δ skeleton curve of specimens.
6.3 Influence of Steel Yield Strength and Concrete Strength
Figure 19 shows the effect of steel yield strength on the P-Δ skeleton curve of members. It can be seen that, with the increase in fy, the shape of the skeleton curve and the stiffness of the elastic stage are basically unchanged, and the bearing capacity of the component is improved. Figure 20 shows the effect of concrete strength on the P-Δ skeleton curve of members. It can be seen that, with the increase in fcu, the shape of the skeleton curve and the stiffness of the elastic stage are basically unchanged and the bearing capacity of members is slightly improved. Steel and concrete are the main components of the concrete-filled steel tubular. Compared with the two, steel mainly bears pressure, and concrete mainly plays the role of internal filling. Therefore, with the improvement of the strength of steel and concrete, the bearing capacity of members increases significantly. However, the strength of steel has a greater impact on the bearing capacity.
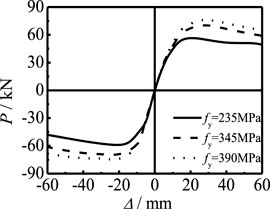
FIGURE 19. Effect of fy on the P-Δ skeleton curve of specimens.
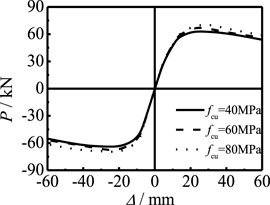
FIGURE 20. Effect of fcu on the P-Δ skeleton curve of specimens.
7 Conclusion
1) CFRP has a good lateral restraint and longitudinal strengthening effect on CFST. The hysteretic curves of the specimens are relatively full, indicating that each specimen has good hysteretic performance and the steel tube and CFRP can keep cooperation in both longitudinal and transverse directions.
2) n is beneficial to the seismic performance of the specimens within a certain range, and the strength degradation of the specimens is not significant. In the later stage of loading, the bearing capacity of the specimens without axial compression does not decrease, and there is axial compression, whereas the bearing capacity of the specimen decreases obviously.
3) A finite element modeling method based on ABAQUS is used in the compression flexural hysteretic load model of members. The P-Δ hysteretic curves of members established by ABAQUS can be used to analyze the stress distribution of the components of members. By comparing the curve with the mode, it can be seen that the FE is in good agreement with the test results.
Data Availability Statement
The original contributions presented in the study are included in the article/Supplementary Material, further inquiries can be directed to the corresponding author.
Author Contributions
WQ-l is responsible for the test and FE research, and CM is responsible for partial FE research. PK is responsible for the translation.
Funding
The research reported in the study was supported by the Project for Talent of Liaoning Province of China (No. XLYC1902009). The authors thank the Shenyang University for its support in the experimental equipment.
Conflict of Interest
The authors declare that the research was conducted in the absence of any commercial or financial relationships that could be construed as a potential conflict of interest.
Publisher’s Note
All claims expressed in this article are solely those of the authors and do not necessarily represent those of their affiliated organizations or those of the publisher, the editors, and the reviewers. Any product that may be evaluated in this article, or claim that may be made by its manufacturer, is not guaranteed or endorsed by the publisher.
Supplementary Material
The Supplementary Material for this article can be found online at: https://www.frontiersin.org/articles/10.3389/fmats.2022.835368/full#supplementary-material
References
Al Zand, A. W., Badaruzzaman, W. H. W., Mutalib, A. A., and Hilo, S. J. (2017). Rehabilitation and Strengthening of High-Strength Rectangular CFST Beams Using a Partial Wrapping Scheme of CFRP Sheets: Experimental and Numerical Study. Thin-Walled Struct. 114 (1), 80–91. doi:10.1016/j.tws.2017.01.028
Alam, M. I., Fawzia, S., Zhao, X-L., Remennikov, A. M., Bambach, M. R., and Elchalakani, M. (2017). Performance and Dynamic Behaviour of FRP Strengthened CFST Members Subjected to Lateral Impact. Eng. Struct. 147, 160–176. doi:10.1016/j.engstruct.2017.05.052
Cao, W. L. (2015). Experimental Study on Seismic Behavior of Mega-Columns with Special-Shaped Cross-Section Multi-Cavity concrete Filled Steel Tubes under Axial Compression and Bending Torsion. J. Build. Struct. 36 (S1), 199–206. +354.
Che, Y., Wang, Q. L., and Shao, Y. B. (2012). Compressive Performances of the concrete Filled Circular CFRP-Steel Tube (C-CFRP-CFST). Adv. Steel Constr. 8 (4), 311–338. doi:10.18057/ijasc.2012.8.4.2
Han, L. H., Zhao, X. L., and Tao, Z. (2001). Tests and Mechanics Model of concrete-filled Stub Columns, Columns and Beam-Columns. Steel Compos. Struct. 1 (1), 51–74. doi:10.12989/scs.2001.1.1.051
Li, D., Du, F., Chen, Z., and Wang, Y. (2016). Identification of Failure Mechanisms for CFRP-Confined Circular concrete-filled Steel Tubular Columns through Acoustic Emission Signals. Smart Struct. Syst. 18 (3), 525–540. doi:10.12989/sss.2016.18.3.525
Li, N., Lu, Y. Y., Li, S., and Liu, L. (2018). Slenderness Effects on concrete-filled Steel Tube Columns Confined with CFRP. J. Construct. Steel Res. 143 (1), 110–118. doi:10.1016/j.jcsr.2017.12.014
Nie, J.-g., Wang, Y.-h., and Fan, J. S. (2013). Experimental Research on concrete Filled Steel Tube Columns under Combined Compression-Bending-Torsion Cyclic Load. Thin-Walled Struct. 67, 1–14. doi:10.1016/j.tws.2013.01.013
Park, J. W., Hong, Y. K., and Choi, S. M. (2010). Behaviors of concrete Filled Square Steel Tubes Confined by Carbon Fiber Sheets (CFS) under Compression and Cyclic Loads. Steel Compos. Struct. 10 (2), 187–205. doi:10.12989/scs.2010.10.2.187
Park, J. W., Hong, Y. K., Hong, G. S., Kim, J. H., and Choi, S. M. (2011). Design Formulas of concrete Filled Circular Steel Tubes Reinforced by Carbon Fiber Reinforced Plastic Sheets. Proced. Eng. 14, 2916–2922. doi:10.1016/j.proeng.2011.07.367
Peng, K., Shao, Y., and Wang, Q. (2022). Analysis of Bearing Capacity of Circular Concrete Filled CFRP-Steel Tubular Beam-Column. KSCE J. Civ Eng. 26, 207–220. doi:10.1007/s12205-021-2103-5
Sundarraja, M. C., and Ganesh, P. G. (2011). Investigation on Strengthening of CFST Members under Compression Using CFRP Composites. J. Reinf. Plast. Compos. 30 (15), 1251–1264. doi:10.1177/0731684411418018
Tao, Z., Han, L. H., and Zhuang, J. P. (2008). Cyclic Performance of Fire-Damaged concrete-filled Steel Tubular Beam-Columns Repaired with CFRP Wraps. J. Constr. Steel Res. 64 (1), 37–50. doi:10.1016/j.jcsr.2007.02.004
Tao, Z., Han, L. H., and Wang, L. L. (2007). Compressive and Flexural Behaviour of CFRP Repaired concrete-filled Steel Tubes after Exposure to Fire. J. Constr. Steel Res. 63 (8), 1116–1126. doi:10.1016/j.jcsr.2006.09.007
Tao, Z., Han, L. H., and Zhuang, J. P. (2007). Axial Loading Behavior of CFRP Strengthened concrete-filled Steel Tubular Stub Columns. Adv. Struct. Eng. 10 (1), 37–46. doi:10.1260/136943307780150814
Tao, Z., Wang, Z. B., Han, L. H., and Uy, B. (2011). Fire Performance of concrete-filled Steel Tubular Columns Strengthened by CFRP. Steel Compos. Struct. 11 (4), 307–324. doi:10.12989/scs.2011.11.4.307
Wang, J. F., Shen, Q. H., Wang, F. Q., and Wang, W. (2018). Experimental and Analytical Studies on CFRP Strengthened Circular Thin-Walled CFST Stub Columns under Eccentric Compression. Thin-Walled Struct. 127 (1), 102–119. doi:10.1016/j.tws.2018.01.039
Wang, Q. L., Li, J., Shao, Y. B., and Zhao, W. J. (2015). Flexural Performances of concrete Filled CFRP-Steel Tubes. Adv. Struct. Eng. 18 (8), 1319–1344. doi:10.1260/1369-4332.18.8.1319
Wang, Q. L., Qu, S. E., Shao, Y. B., and Feng, L. M. (2016). Static Behavior of Axially Compressed Circular concrete Filled CFRP-Steel Tubular (C-CF-CFRP-ST) Columns with Moderate Slenderness Ratio. Adv. Steel Constr. 12 (3), 263–295. doi:10.18057/ijasc.2016.12.3.4
Wang, Q. L., and Shao, Y. B. (2014). Compressive Performances of concrete Filled Square CFRP-Steel Tubes (S-CFRP-CFST). Steel Compos. Struct. 16 (5), 455–480. doi:10.12989/scs.2014.16.5.455
Wang, Q. L., and Shao, Y. B. (2015). Flexural Performance of Circular concrete Filled CFRP-Steel Tubes. Adv. Steel Constr. 11 (2), 127–149. doi:10.18057/ijasc.2015.11.2.1
Keywords: circular CFRP-concrete-filled steel tube, middle section lateral force-deflection curve, hysteretic behavior, finite element simulation, parameter analysis
Citation: Qing-li W, Miao C and Kuan P (2022) Analysis on Experimental Performance of Hysteretic Behavior of Concrete-Filled Circular CFRP Steel Tubular Beam-Column. Front. Mater. 9:835368. doi: 10.3389/fmats.2022.835368
Received: 14 December 2021; Accepted: 28 January 2022;
Published: 25 February 2022.
Edited by:
Yu Zheng, Dongguan University of Technology, ChinaReviewed by:
Zhijian Yang, Shenyang Jianzhu University, ChinaShao-Bo Kang, Chongqing University, China
Copyright © 2022 Qing-li, Miao and Kuan. This is an open-access article distributed under the terms of the Creative Commons Attribution License (CC BY). The use, distribution or reproduction in other forums is permitted, provided the original author(s) and the copyright owner(s) are credited and that the original publication in this journal is cited, in accordance with accepted academic practice. No use, distribution or reproduction is permitted which does not comply with these terms.
*Correspondence: Peng Kuan, MTE1MTcxMDE3OUBxcS5jb20=