 Omri Schulman
 Raz Samira
 Noa Lachman
94% of researchers rate our articles as excellent or good
Learn more about the work of our research integrity team to safeguard the quality of each article we publish.
Find out more
ORIGINAL RESEARCH article
Front. Mater. , 20 May 2022
Sec. Polymeric and Composite Materials
Volume 9 - 2022 | https://doi.org/10.3389/fmats.2022.827740
Optimizing conductive ink for Direct-Write Additive Manufacturing, this work explores the effect of carboxylic functionalization of multi-walled carbon nanotubes on their affinity to silver nanoparticles deposited on them. We show a correlation between functionalization and the size of the resulted NPs: the diameter of the silver NPs deposited on pristine CNTs (∼5 nm diameter) is third of that of NPs deposited on functionalized CNTs (∼15 nm). Electrical characterization of the silver-decorated CNT-based ink shows a more significant improvement in conductivity of the functionalized CNTs-decorated with silver compared to the pristine one (maximal ∼40 and ∼20% increase in conductivity over their undecorated counterpart, respectively). However, CNT functionalization severely damages the conductivity of the CNTs themselves, resulting in a much lower conductivity. This “double-edged sword” effect of functionalization results in the highest absolute specific conductivity (3.79 × 10³ S/m) achieved by decorating pristine CNTs with 25 wt% of silver. Nevertheless, the observed enhanced conductivity and the ability to control the composite’s morphology by functionalization allow fine-tuning of morphology-based properties, such as surface enhanced Raman scattering and optimization of the ink for sensing applications.
Innovations in the fields of electronics, robotics and the “internet of things” (“IOT”) have pushed the boundaries of imagination. Such applications have accelerated the ever-growing need for circuits to become smaller, lighter, and more efficient. However, the conventional, subtractive method of electronic circuit production - selectively removing copper from printed circuit boards (PCBs) (Mosses and Brackenridge 2003) - is both inefficient and environmentally unfriendly (Espera et al., 2019). To keep up with the demands of the ever-advancing industry, new manufacturing processes have been developed. These processes allow the design of electronic circuits that would be impossible to produce by classical PCB method.
Additive manufacturing (AM) provides one such alternative to the subtractive fabrication process. In AM, the electronic circuit is produced from the bottom up via the selective deposition or growth of conductive and dielectric materials (Espera et al., 2019). These materials may be deposited layer by layer in a manner similar to that of three-dimensional printing, to create a monolithic circuit of unorthodox geometries; or they may be deposited onto an existing substrate, transforming it into an electronic circuit. The AM method chosen, and the conductive materials used, will have a direct impact on the quality, efficiency, and scalability of the resulting electronic circuit.
There is a wide range of conductive inks, dyes and pastes available on the market, which can be used to deposit conductive pathways in the AM production of circuits. These materials are commonly composed of conductive fillers and a non-conductive matrix which allows their controlled deposition and adhesion to the substrate during printing (Kamyshny and Magdassi 2019). The conductive fillers can vary from metal nanoparticles and nanowires to organic particles such as carbon nanotubes (CNTs), graphene and conductive polymers (Kamyshny and Magdassi 2019; Goh et al., 2019b). Of these, CNTs have several unique advantages, including high conductivity, low density and the ability to be processed in ambient conditions without oxidizing or decaying (Ibrahim, 2013). For this reason, there has been increased research and interest in this type of conductive filler for its use in the additive fabrication of electronic circuitry (Sarangdevot and Sonigara 2015; Goh et al., 2019b).
However, despite the excellent properties of individual CNT (Tortorich and Choi, 2013), their microscale length requires electrons to percolate from one CNT to another, sometimes thousands of times. The CNT-CNT junction higher resistance greatly reduces the electron mean-free-path, thus reducing the conductivity of the electrode (Hecht et al., 2006). Attempts to increase the conductivity of CNT based inks by improving their dispersibility (Menon et al., 2017; Goh et al., 2019b; Aziz et al., 2020) or post-treatment (Shimoni et al., 2014) have been proven insufficient. Therefore, the working hypothesis is that by reducing the barriers to electron transport at CNT-CNT junctions, it may be possible to increase the conductivity of the CNT network. To this end, attempts have been made to add conductive metal nanoparticles to the network, increasing conductivity by 2-3 orders of magnitude (Ko and Lin 2013). Of these chosen metals, silver nanoparticles are the most prominent candidates for improving CNT network conductivities, due to their high conductivity (Gall, 2016), chemical stability (Fernandes et al., 2020), and sintering compatibility even at low temperatures (Moon et al., 2005).
Table 1 shows examples of commercially available CNT based inks and those published in the literature. Looking at the commercially available inks, it is apparent that their specific resistivities are very high, three orders of magnitude above that of bulk silver (×1.610−6 Ω cm), a common benchmark for resistivities in printed electronics. The low density, high optical transmission and excellent environmental endurance of carbon-based inks makes them attractive candidates for electronic applications even in these high resistvities, but prevents them from being used for high-power or high frequency electronic applications. Therefore, reducing carbon-based inks’ resistivity is still a highly desired goal. Compounding with silver nano-wires (Oluwalowo et al., 2019) is favorable over graphene nanoparticles (Shim et al., 2015), and produced a mostly carbon based ink with a conductivity one order of magnitude below that of silver. Increasing the silver content to over 80% of the composite has effectively increase the conductivity of the ink by several orders of magnitude (Zhao et al., 2012), but these mostly silver-based inks lose most of the favorable properties of the CNTs. Works such as these suggest that the addition of metallic nanoparticles as a mean to improve the conductivity of CNT networks, leading to a tenfold increase in conductivity (Ko and Lin 2013) can also preserve the low density, cost, and durability of the CNT network.
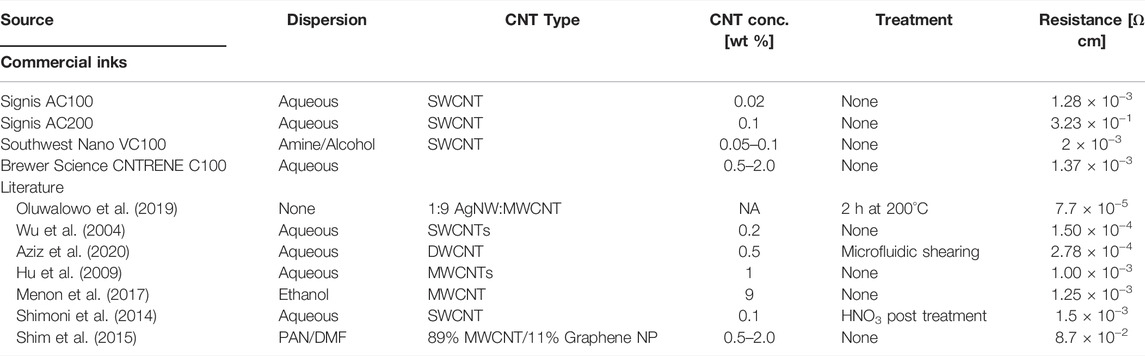
TABLE 1. Resistivity comparison of CNT based conductive inks on the market and in the literature.
In this work, we aim to improve upon past efforts by decorating multi-walled CNTs (MWCNTs) with silver nanoparticles via electrochemical reduction, thus binding the silver nanoparticles to the CNTs to enhance their improvement of the networks’ conductivities over simply “mixing in” silver nanoparticles. The MWCNT-silver nanocomposite particles will then be used to formulate an aerosol-able ink for deposition of conductive carbon-based traces.
The protocol for silver decoration of MWCNTs using a Tollen’s Reagent is based upon the works of Larrude et al. (Larrude et al., 2014). As-purchased functionalized MWCNTs (>95%, 1.55 wt% carboxilic groups, US Nano, stock number: US4311) or pristine MWCNTs (>95%, US Nano, stock number US4312) were dispersed in an aqueous solution based on distilled water (18.2 MΩ resistance, Merck “Milliq” water distillation filter) with aid of a commercial dispersant recommended for CNT dispersal (BYK, DISPERBYK 190), at 1:10 dispersant to carbon mass ratio. The solution was then sonicated for an hour in an ultrasonic bath (40 KHz at 35 W Power; Skymen Cleaning Equipment JP-008) to produce a homogenous 2 wt% aqueous carbon solution.
To produce the Tollen’s Reagent, a 2% wt silver nitrate solution was prepared by dissolving 2 gr of silver nitrate (>99%, Sigma Aldrich, cat. #209139) in 100 ml distilled water. To this solution, 1 ml of dilute NaOH (>98%, Sigma Aldrich, cat. #S5881, 1 gr NaOH per 100 ml distilled water) solution was added, as this compound aids in the Tollen’s Reaction. Following this the silver precipitates and the solution becomes opaque. To this murky solution an aqueous solution of 25 wt% ammonia (32%, Sigma Aldrich, cat. #1.05426, with an additional 28 ml distilled water added per 100 ml ammonia solution to achieve 25% final concentration) was added dropwise, until the solution just starts to become clear.
The desired amount of Tollen’s reagent (calculated by the silver mass to give 1:4, 1:2 or 1:1 silver to CNT weight ratio, respectively) is added to the previously prepared CNT samples, and the resulting CNT/Tollen’s reagent solution is sonicated for an hour in an ultrasonic bath at 40°C. The purpose of the sonication during the reaction is to maintain the dispersion of the CNTs and prevent their agglomeration. After an hour, 100 µL of formaldehyde (37%, Sigma Aldrich, 252,549) are added to terminate the reaction and cause the precipitation of the remaining silver in the solution. The solution was sonicated for another hour to fully terminate the reaction.
The resulting solution is vacuum filtered using a Büchner filter through a 70 mm Whatmann Grade 44 filter paper (Sigma Aldrich, WHA1444070), to produce a dry cake of decorated CNTs. The cake is then washed with distilled water and ethanol (min 99.9% assay, Biolab Chemicals), three times each, while still in the vacuum filter basket. The water wash is to remove the water-soluble ions from the deposition step, and the ethanol aids in the removal of organic species. The resulting cake is then dried in a vacuumed desiccator for 6 h to remove any remaining solvent.
For ink formulation, different masses of the now dry Ag:CNT powder was mixed with 10 ml of distilled water, to maintain a constant 0.5% wt. of CNT in the ink. To aid in the dispersion of these samples in the aqueous media, the same commercial dispersant from the decoration step, DISPERBYK 190, was added to the CNT mass in each sample at a ratio of 1:10 dispersant to CNT. These samples were then all sonicated in an ultrasonic bath for 2 hours to redisperse the dry powder into the aqueous solvent.
Functionalized (F) and pristine (non-functionalized, NF) CNTs samples, with an increasing nominal ratio of silver particles (0, 1:4, 1:2, 1:1 Ag: CNT), were taken at the “dried cake” stage and analyzed in air using a TGA Q5000 from TA instrument, with an isothermal at 45°C for 10 min followed by a gradual increase in temperature from 45 to 800°C at a ramp of 10°C/min.
Both scanning electron microscopy samples and conductivity characterization samples (to be described in the next sub-section) were produced via aerosol deposition using the Optomec AJ300 system, using the ultrasonic atomization unit which utilizes a strong ultrasonic frequency to aerosolize the ink into vapor of micro-droplets. This vapor is jetted out of a narrow ceramic tip onto the substrate, guided by a sheath of pressurized nitrogen gas which allows deposition of fine conductive traces. The exact printing parameters are described in the Supplementary Information.
Three samples of silver decorated CNTs: functionalized CNTs with 1:4 Ag:CNT mass ratio (F 1:4), functionalized CNTs with a 1:2 mass ratio (F 1:2), and pristine CNTs with a 1:4 mass ratio (NF 1:4), were deposited by aerosol jet onto silicon wafers. The samples were chosen as they allow a comparison along the two main variable axes: increase in silver content and effect of functionalization. Identical samples were exposed to a heating profile in a reflow oven after deposition. This type of oven utilizes convection and a tight temperature control loop to increase the chamber’s temperature quickly and uniformly along a desired profile. All the samples were then analyzed using a High-Resolution Scanning Electron Microscope (Zeiss Gemini SEM), to observe the changes in silver morphology caused by sintering process. No pretreatment was necessary as the samples are conductive. The acceleration voltage was 3.0 kV, with a Zeiss “InLens” detector for secondary electron detection and an “aBSD” Si solid state backscattered electron detector with all its segments activated during the scan.
To determine the particle size distribution, the images were analyzed using ImageJ software. A bandpass filter (1–40 pixels) was first applied to the images to reduce noise. Then, a threshold filter was applied, just until all the white silver particles are included in the image. The particle radii were automatically calculated by the built-in software tool, with a resolution of 1–5 nm, dependent on the magnification.
Additionaly, TEM images of silver-decorated both pristine (NF) and functionalized (F) CNT were taken to confirm decoration. Samples for the TEM were prepared by dispersing the CNTs powder in ethanol by ultrasonic treatment for 10 min. The suspension was then casted on a TEM grid with an ultrathin carbon film. The CNTs were examined in a FEI Tencai 20 TEM, operated at 200 keV, in bright-field mode and slight under-focus conditions to increase the contrast.
Dilute formulations of the functionalized (F) and pristine (not functionalized, NF) Ag:CNT samples were prepared by sonicating 1 mg of the sample powder with 1 ml of acetone for 30 s. These samples were then drop-cast onto glass slides and dried at 80°C to remove traces of solvent. The Raman spectra of these samples was then obtained using LabRAM HR Evolution, Horiba, with a wave-length of 532 nm (green laser) in a region 1,000–3,000 cm−1 for ID/IG ratio calculation. All the measurements were performed at room temperature.
In order to measure the conductivities of the printed lines in a standardized manner, simple probing circuits were produced by deposition of silver nanoparticle based ink (Sicrys I50-TM) via the Optomec system onto slides made of epoxy-laminated glass fibers (FR-4), as seen in Figure 1.
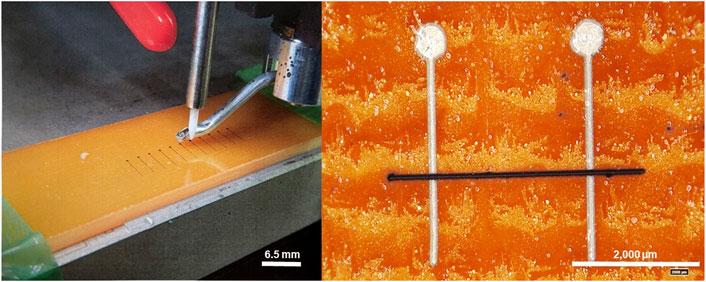
FIGURE 1. Left: Aerosol deposition of ink on FR4 substrate for conductivity measurements. Right: Conductive trace of CNT based ink (black) between two silver-based electrodes (light-grey), both produced via aerosol deposition.
These probing circuits were spaced 2.5 ± 0.05 mm apart, allowing the standardization of the samples’ lengths. The height of the silver lines onto which the CNT based ink was deposited 20 μm, allowing for the smooth deposition of the CNT lines orthogonally to the silver probes with minimal change in height that could cause necking at the base of the probe. Each silver probe contained a probing pad with a diameter of 0.5 mm, allowing for facile resistance measurements using the multimeter probes. As printed Ag:CNT lines were measured with a Kiethley 2,200 Multimeter. The in-line resistivity of the silver lines and multimeter probes was 1–2 [Ohm], which is three orders of magnitude below that of the printed CNT lines, and therefore has a negligible effect on these measurements. After calculating the “as-printed” resistivity of the lines, the samples underwent a post-processing heat treatment in a Reflow Oven to sinter the silver nanoparticles and remove remaining solvents and the insulating dispersant, then measured again in the same procedure.
To measure the cross-sectional area of the samples, an optical microscope (HIROX MXB-5000REZ) was used to generate a three-dimensional rendering of the printed lines. The three dimensional model was used to calculate the average cross-sectional area of the conductive trace, allowing calculation of the samples’ conductivities.
TGA results are presented in Figure 2. The thermal decomposition of all the samples follow a similar behavior, with a singular decomposition curve that begins at around 300°C and ends at above 650°C–fitting the oxidation of CNT (Osswald et al., 2007). Above 700°C, no organic species remain in the samples, and the sample mass remaining constitutes solely of silver. From the graph, it is evident that the silver ratio added during the decoration step fits to the silver mass present in the TGA samples after decomposition. It is thus concluded that the amount of silver deposited can be precisely controlled by determining the relative silver content present in the Tollen’s reagent during CNT decoration, with yield close to 100%, both for the pristine and functionalized CNT.
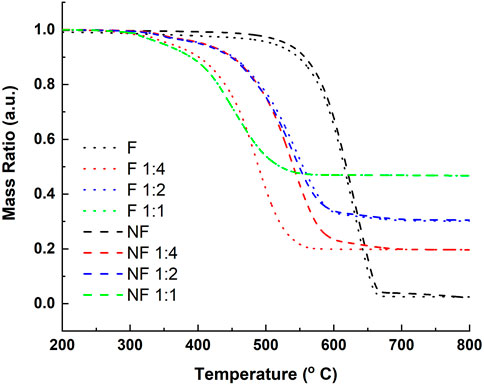
FIGURE 2. Thermogravimetric analysis of functionalized (F) and pristine (non-functionalized -NF) CNT samples with varying silver-to-CNT mass ratios.
An additional observation that can be made from the TGA curves is the effect of silver decoration on the oxidation temperature of the CNTs. The undecorated samples begin their decomposition at 500°C, while the decorated samples begin to oxidize at 300°C. This temperature decrease can suggest a catalytic relationship between the silver nano-particles (Ag NP) and the CNTs, whereby the silver particles enhance carbon oxidation at lower temperatures, as previously reported (Yusof et al., 2016).
To verify the decoration and affinity of Ag NP to the CNT, TEM images of the decorated CNT, both pristine and functionalized, can be seen in Figure 3. The images clearly show the darker, heavier Ag particles on the much lighter carbon nanostructures, demonstrating high affinity between the Ag NP and CNT even after sonication of the samples.
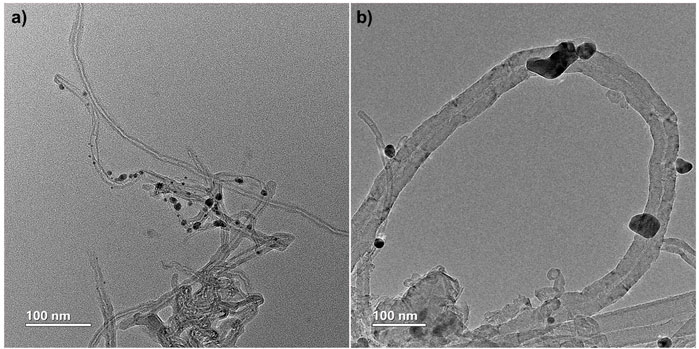
FIGURE 3. TEM images demonstrating CNT decoration with silver nanoparticles. (A) pristine (NF) CNT. (B) functionalized (F) CNT.
Figure 4 illustrates the particle size distribution of the 1:4 F, 1:4 NF and 1:2 F as-printed (a, left) and after reflow (b, right) samples with the frequency of observance as a function of particle radius. There is a clear difference between the as-printed functionalized and pristine particle size distributions, with the NF 1:4 samples having a narrow distribution with a prominent peak at a radius of 5 nm, while for both functionalized samples the most prevalent particle size observed was 14 nm. There is a slight difference between the functionalized samples of different silver content, with the 1:2 Ag:CNT samples having a wider particle distribution with more particle’s radii observed in the 20–30 nm range.
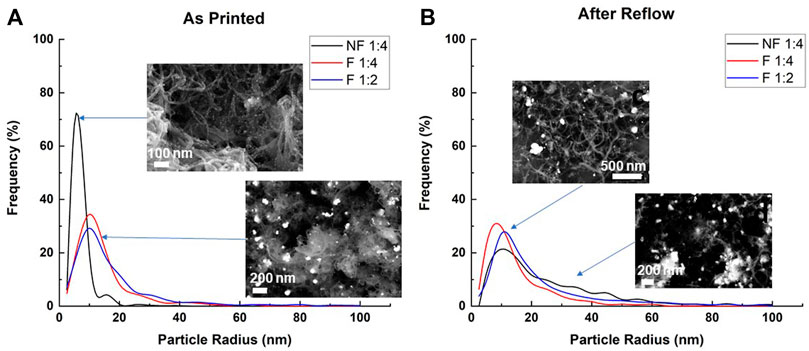
FIGURE 4. Particle size distribution of: (A) as-printed silver decorated functionalized and pristine CNT samples; and (B) the samples after reflow heat treatment. Insets show representative SEM images of the corresponding specimens (the full resolution versions of the images presented here can be found in the SI).
The difference in silver morphology between pristine and functionalized CNT can possibly be explained by the deposition affinity of the silver particles to the carboxylic site in the decoration of the functionalized CNTs, as opposed to the random precipitation in the decoration of pristine CNTs. In addition, the results suggest that the more silver is added, the larger these particles become. In contrast, the silver particle nucleation process on pristine CNTs appears to be much less selective, creating the uniform coverage observed in the SEM imaging. As the same number of silver particles are deposited across many more sites on the surface of the pristine CNTs, the nanoparticles formed are ultimately smaller than those observed in the functionalized samples.
After printing, the conductive traces undergo post processing in a reflow oven, to remove remaining solvents and sinter the nanoparticles together, improving the final conductivity. There is a noticeable drop in the prominent peak previously observed in the pristine samples, with the distribution of the particles’ radii in this sample stretching out to greater than 40 nm. The particle radii distributions of the functionalized silver decorated samples are less affected by the heat treatment, though they do show a growth in the number of observed particles at the 20–40 nm range. There is also a slight shift in the particle radii distribution peak of the 1:4 F to the 5 nm range, that would at first seem to suggest the particles are getting smaller. A more likely explanation is the preferential agglomeration of larger particles together as a result of the heat treatment, decreasing their relative share in the particle distribution and increasing the smaller particles’ share. This phenomenon is reflected in the difference between the particle distributions’ numbered averages and weighted averages: 7.8 vs. 14.3 nm, respectively, after heat treatment, compared to the much more homogenized 15.4 vs 14.0 nm, respectively, for the as printed specimens. This dissonance hints at a decrease in the number of smaller particles in the distribution and an increase in the share of larger particles which pull the weighted average upwards.
After collecting the Raman spectra for each sample, the ID/IG ratio for each sample, which usually gives an indication of the degree of defects or disorders in the sample, was calculated. Figure 5 shows the calculated ID/IG ratios for each of the drop-cast samples (a, left) and the relative change in ID/IG ratios as a function of silver mass in the sample (b, right). The trend shows a clear increase both in pristine and functionalized ID/IG. From minimal increase in 1:4 Ag:MWCNT (1 and 5.6%, respectively), through 13 and 16% (again, respectively) in 1:2 Ag:MWCNT, up to 22% increase in ratio for 1:1 Ag:MWCNT functionalized samples (but no further increase for the pristine sample).
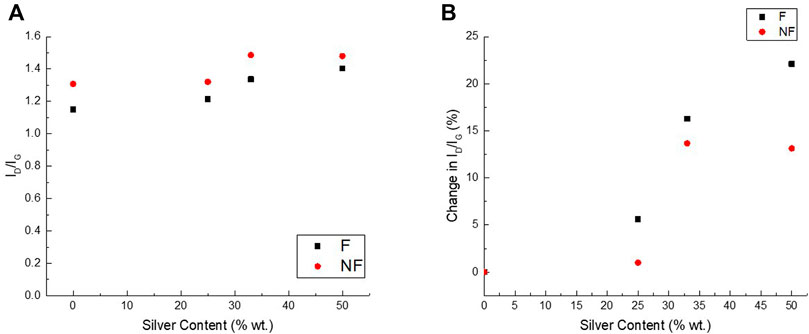
FIGURE 5. (A) ID/IG ratios calculated from the Raman spectroscopy results of functionalized (F) and pristine (NF) silver decorated samples of varying silver mass ratios; (B) calculated percent change in ID/IG ratio compared to the undecorated samples.
As ID/IG ratio is commonly used as an indication of the number of defects present on the surfaces of the MWCNTs (Ferrari and Robertson, 2000; Murphy et al., 2006; Puech et al., 2019), these results may mistakenly suggest that the silver deposition onto the tubes damages the MWCNTs. However, such interpretation would be contrasting with the reaction mechanism. In both the functionalized and pristine MWCNT decoration reactions, the Ag NP are deposited at existing nucleation sites, and should not create new defects on the tubes’ surface. A more likely explanation is based on the well documented surface enhanced Raman scattering (SERS), whereas the D mode is slightly amplified by metal nanoparticles due to doping effects (Lee et al., 2021). SERS enhancement of the ID/IG ratio in silver decorated MWCNTs is dependent on the both the silver particles’ size (Stamplecoskie and Scaiano 2011) and the spacing between the particles (Zhang et al., 2016), generating a stronger enhancement for larger and more tightly packed silver nanoparticles–namely, those deposited on functionalized MWCNT, as identified by the SEM analysis.
Figure 6A (left) shows the calculated specific conductivities of functionalized and pristine silver decorated CNTs before and after heat treatment in a reflow oven, as a function of relative silver content.
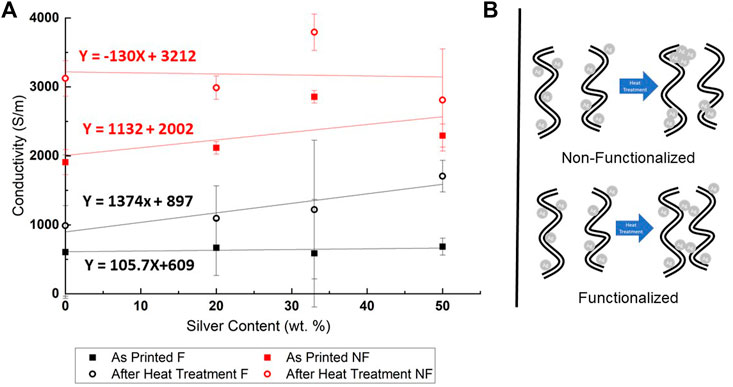
FIGURE 6. (A) Calculated conductivities of functionalized (F) and pristine (NF) silver decorated CNTs, before and after reflow oven heat treatment. (B) Proposed mechanism of nanoparticle agglomeration after sintering of pristine (non functionalized - NF) and functionalized (F) CNTs.
As can be seen, the conductivity of the as printed functionalized lines is three times less than that of the pristine CNTs. Even after the heat treatment, the conductivity of the functionalized CNT lines is still three times less than that of the pristine samples. Both the functionalized and pristine CNT samples show a 40% improvement in conductivity after heat treatment, which can be attributed to solvent and dispersant removal, as there is no macroscopic geometric difference between the samples before and after heat treatment. It should be noted that even before heat treatment, both pristine and functionalized CNT show high conductivity compared to literature (Goh et al., 2019a).
From this disparity in conductivities between the functionalized and pristine CNTs, it is highly likely that the functionalization process significantly harms the CNTs conductivity. This harm is probably caused by the introduction of defects on the CNT walls during the violent acid functionalization (Royan et al., 2013). The carboxylic side groups also act as charge acceptors, withdrawing electrons by induction and resonance, reducing the conduction efficiency in the lattice (Montanheiro et al., 2015). Another possible reason for the increase in resistivity is the possible dispersive effects of the carboxylic functional groups, whether due to steric or polar/non-polar dispersion. Though these side groups improve the dispersion of the CNTs in the ink, their presence creates a less dense CNT network that might actually decrease the probability of CNT-CNT junction formation and increasing the junction resistivity (Montanheiro et al., 2015).
Looking at the trend lines it is evident that for the functionalized CNT samples, especially after heat treatment, specific conductivity is increased with increasing silver content. The same can be observed for the as-printed pristine CNT samples up to 1:2 Ag:CNT mass loading, though to a lesser extent. At 1:1 Ag:CNT mass loading the pristine samples conductivity actually decreases, leaving the samples with a lower specific conductivity than that of the 1:2 Ag:CNT samples. However, after heat treatment, the improvement in conductivity due to silver content diminishes, and even worsen for the 1:1 Ag:CNT pristine samples. The addition of silver nanoparticles to the functionalized CNT samples indeed improves the conductivity of the CNT network up to 1:1 Ag:CNT mass content in comparison to samples without added silver. However, in the case of pristine CNTs, the trend is not as clear.
Unfortunately, the 72% improvement of conductivity in the functionalized CNT samples with a silver mass loading of 1:1 Ag:CNT leaves them with a specific conductivity of 1.71 × 10³ [S/m], which is still nearly two times less than that of the undecorated pristine CNTs (specific conductivity of 3.12 × 10³ [S/m]. The greatest specific conductivity measured was that of the pristine 1:2 Ag:CNT samples, with an average specific conductivity of 3.79 × 10³ [S/m].
Considering the effect of the heat treatment, as-printed functionalized samples do not change their conductivity much with increasing silver content, whereas pristine samples do increase their conductivity with silver decoration. One possible explanation for this phenomenon is the lack of dispersive forces in the pristine samples, allowing their silver decoration to improve their conductivity. In contrast, the carboxylic groups in the functionalized CNTs keep the network’s conductivity constant with increased silver decoration through steric dispersion. This trend is inverted after the heat treatment, where there is little variance in the conductivities of the heat-treated pristine samples with increased silver content, while the conductivity of the heat-treated functionalized CNT networks greatly improves as more silver is added. As was observed under the SEM, the heat treatment of the printed Ag: CNT composites results in a growth in average silver particle diameter, which was much more acute in the case of the pristine samples. Based on the images, it was hypothesized that the lack of ionic bonding between the deposited silver and the CNTs in the case of pristine samples allowed migration of the particles upon heat treatment into the formation of agglomerates. On the other hand, the silver particles that were ionically bound to the functionalized CNTs were less likely to form large agglomerations and instead only managed to increase the average particle size slightly by coalescing with neighboring silver particles in their vicinity. This behavior effectively densifies the conductive CNT network by both brining the tubes closer together and creating new CNT-Ag-CNT junctions. Figure 6B illustrates schematically this hypothesized process of network densification, in comparison to the process of silver particle agglomeration in the pristine samples. It is thus concluded that whatever conductivity improvement after heat treatment in the pristine samples is mainly due to the vaporization and removal of the contaminating species, and not the silver content of the samples. However, in the case of silver decorating functionalized CNTs, the heat treatment greatly improves their conductivity via network densification, which overcomes the dispersive forces of the carboxylic functional groups.
This study evaluated the decoration of MWCNTs with silver nanoparticles as a mean of formulating a conductive carbon-based ink for aerosol jet deposition, examining the effect of the CNT carboxylic functionalization on such decoration both morphologically and electrically. It was found that the pristine samples that underwent heat treatment have a much more drastic particle population change after the reflow oven than the functionalized samples. The assumption is that silver particles in the pristine samples have greater freedom to migrate, as they are not ionically bound to the CNT by carboxyl functionalized sites. Also observed is an increase in ID/IG ratio of both functionalized and pristine MWCNTs following decoration with Ag NP, and this increase is enhanced by functionalization. The effect is attributed to SERS, supported by subsequent microscopy imaging of the samples, showing a difference in the particle sizes between the functionalized and pristine samples. The larger, more closely packed silver nanoparticles decorating the functionalized samples are theorized to have selectively amplified the Raman D-band of the MWCNT, causing a more noticeable increase in the ID/IG ratio.
Regarding conductivity, and especially post-heat treatment results, silver decoration has been shown to significantly improve the conductivity of the functionalized CNTs, with direct correlation to silver mass loadings. In contrast, pristine CNTs did not show such correlation. The improvement in conductivity of the functionalized CNTs is attributed to CNT network densification after heat treatment, as observed via SEM imaging, which does not occur in the case of the pristine samples. However, the improvement was not enough to overcome the intrinsically lower conductivity of the functionalized CNTs in comparison to the pristine samples. Gentler functionalization processes, or at different functionalization degrees, might be able to reduce the deterioration in conductivity of the undecorated samples to increase the improvement in conductivity of the decorated samples. Nevertheless, the ability to control silver nanoparticle size and distribution through CNT functionalization can be proven useful for sensing electrodes, where the absolute conductivity is less important than the change in signal following substrate detection.
The original contributions presented in the study are included in the article/Supplementary Material, further inquiries can be directed to the corresponding author.
All authors contributed to conception and design of the study. OS has prepared the specmens, aquired the data, performed the statistical analysis and wrote the first draft of the manuscript. NL has overviewed and supervised the project, revised and approved the submitted version.
This research was funded by Grant no. 014535 of the Israeli Ministry of Defense - Directorate of Defense Research and Development.
The authors declare that the research was conducted in the absence of any commercial or financial relationships that could be construed as a potential conflict of interest.
The authors also thank the group of Prof. Ariel Ismach, and especially Ravit Dvir-Yeoshua, for its assistance in Raman measurements. At Tel Aviv University, this work was performed in part at the Wolfson Applied Materials Research Center, and at the Tel-Aviv University Center for Nanoscience and Nanotechnology. The authors wish to specially thanks Gal Radovski for from the latter center for his assistance with HR-SEM.
All claims expressed in this article are solely those of the authors and do not necessarily represent those of their affiliated organizations, or those of the publisher, the editors, and the reviewers. Any product that may be evaluated in this article, or claim that may be made by its manufacturer, is not guaranteed or endorsed by the publisher.
The Supplementary Material for this article can be found online at: https://www.frontiersin.org/articles/10.3389/fmats.2022.827740/full#supplementary-material
Aziz, A., Bazbouz, M. B., and Welland, M. E. (2020). Double-Walled Carbon Nanotubes Ink for High-Conductivity Flexible Electrodes. ACS Appl. Nano Mat. 3, 9385–9392. doi:10.1021/acsanm.0c02013
Espera, A. H., Dizon, J. R. C., Chen, Q., and Advincula, R. C. (2019). 3D-printing and Advanced Manufacturing for Electronics. Prog. Addit. Manuf. 4, 245–267. doi:10.1007/s40964-019-00077-7
Fernandes, I. J., Aroche, A. F., Schuck, A., Lamberty, P., Peter, C. R., Hasenkamp, W., et al. (2020). Silver Nanoparticle Conductive Inks: Synthesis, Characterization, and Fabrication of Inkjet-Printed Flexible Electrodes. Sci. Rep. 10, 8878. doi:10.1038/s41598-020-65698-3
Ferrari, A. C., and Robertson, J. (2000). Interpretation of Raman Spectra of Disordered and Amorphous Carbon. Phys. Rev. B 61 (20), 14095–14107. doi:10.1103/physrevb.61.14095
Gall, D. (2016). Electron Mean Free Path in Elemental Metals. J. Appl. Phys. 119, 085101. doi:10.1063/1.4942216
Goh, G. L., Agarwala, S., and Yeong, W. Y. (2019a). Aerosol-Jet-Printed Preferentially Aligned Carbon Nanotube Twin-Lines for Printed Electronics. ACS Appl. Mat. Interfaces 11, 43719–43730. doi:10.1021/acsami.9b15060
Goh, G. L., Saengchairat, N., Agarwala, S., Yeong, W. Y., and Tran, T. (2019b). Sessile Droplets Containing Carbon Nanotubes: a Study of Evaporation Dynamics and CNT Alignment for Printed Electronics. Nanoscale 11, 10603–10614. doi:10.1039/c9nr03261d
Hecht, D., Hu, L., and Grüner, G. (2006). Conductivity Scaling with Bundle Length and Diameter in Single Walled Carbon Nanotube Networks. Appl. Phys. Lett. 89, 133112. doi:10.1063/1.2356999
Hu, L., Choi, J. W., Yang, Y., Jeong, S., La Mantia, F., Cui, L.-F., et al. (2009). Highly Conductive Paper for Energy-Storage Devices. Proc. Natl. Acad. Sci. U.S.A. 106, 21490–21494. doi:10.1073/pnas.0908858106
Ibrahim, K. S. (2013). Carbon Nanotubes-Properties and Applications: a Review. Carbon Lett. 14 (3), 131–144. doi:10.5714/cl.2013.14.3.131
Kamyshny, A., and Magdassi, S. (2019). Conductive Nanomaterials for 2D and 3D Printed Flexible Electronics. Chem. Soc. Rev. 48, 1712–1740. doi:10.1039/c8cs00738a
Ko, W. Y., and Lin, K. (2013). Highly Conductive, Transperant Flexible Films Based on Metal Nanoparticle-Carbon Nanotube Composites. J. Nanomater. 2013, 505292. doi:10.1155/2013/505292
Larrude, D. G., Maia da Costa, M. E. H., and Freire, F. L. (2014). Synthesis and Characterization of Silver Nanoparticle-Multiwalled Carbon Nanotube Composites. J. Nanomater. 2014, 654068. doi:10.1155/2014/654068
Lee, J.-W., Cho, J. Y., Kim, M. J., Kim, J. H., Park, J. H., Jeong, S. Y., et al. (2021). Synthesis of Silver Nanoparticles Embedded with Single-Walled Carbon Nanotubes for Printable Elastic Electrodes and Sensors with High Stability. Sci. Rep. 11, 5140. doi:10.1038/s41598-021-84386-4
Menon, H., Aiswarya, R., and Surendran, K. P. (2017). Screen Printable MWCNT Inks for Printed Electronics. RSC Adv. 7, 44076–44081. doi:10.1039/c7ra06260e
Montanheiro, T. L. D. A., Cristóvan, F. H., Machado, J. P. B., Tada, D. B., Durán, N., and Lemes, A. P. (2015). Effect of MWCNT Functionalization on Thermal and Electrical Properties of PHBV/MWCNT Nanocomposites. J. Mat. Res. 30 (1), 55–65. doi:10.1557/jmr.2014.303
Moon, K.-S., Dong, H., Maric, R., Pothukuchi, S., Hunt, A., Li, Y., et al. (2005). Thermal Behavior of Silver Nanoparticles for Low-Temperature Interconnect Applications. J. Elec Materi 34 (2), 168–175. doi:10.1007/s11664-005-0229-8
Mosses, R., and Brackenridge, S. (2003). A Novel Process for the Manufacturing of Advanced Interconnects. Circuit World 29 (3), 18–21. doi:10.1108/03056120310460775
Murphy, H., Papakonstantinou, P., and Okpalugo, T. I. T. (2006). Raman Study of Multiwalled Carbon Nanotubes Functionalized with Oxygen Groups. J. Vac. Sci. Technol. B 24, 715. doi:10.1116/1.2180257
Oluwalowo, A., Nguyen, N., Zhang, S., ParkPark, J. G., and Liang, R. (2019). Electrical and Thermal Conductivity Improvement of Carbon Nanotube and Silver Composites. Carbon 146, 224–231. doi:10.1016/j.carbon.2019.01.073
Osswald, S., Havel, M., and Gogotsi, Y. (2007). Monitoring Oxidation of Multiwalled Carbon Nanotubes by Raman Spectroscopy. J. Raman Spectrosc. 38, 728–736. doi:10.1002/jrs.1686
Puech, P., Kandara, M., Paredes, G., Moulin, L., Weiss-Hortala, E., Kundu, A., et al. (2019). Analyzing the Raman Spectra of Graphenic Carbon Materials from Kerogens to Nanotubes: What Type of Information Can Be Extracted from Defect Bands? C 5, 69. doi:10.3390/c5040069
Royan, N., Sulong, A. B., Sahari, J., and Suherman, H. (2013). Effect of Acid- and Ultraviolet/Ozonolysis-Treated MWCNTs on the Electrical and Mechanical Properties of Epoxy Nanocomposites as Bipolar Plate Applications. J. Nanomater. 2013, 717459. doi:10.1155/2013/717459
Sarangdevot, K., and Sonigara, B. S. (2015). The Wondrous World of Carbon Nanotubes: Structure, Synthesis, Properties and Applications. J. Chem. Pharm. Res. 7, 916–933.
Shim, W., Kwon, Y., Jeon, S.-Y., and Yu, W.-R. (2015). Optimally Conductive Networks in Randomly Dispersed CNT:graphene Hybrids. Sci. Rep. 5, 16568. doi:10.1038/srep16568
Shimoni, A., Azoubel, S., and Magdassi, S. (2014). Inkjet Printing of Flexible High-Performance Carbon Nanotube Transparent Conductive Films by "coffee Ring Effect". Nanoscale 6, 11084–11089. doi:10.1039/c4nr02133a
Stamplecoskie, K. G., Scaiano, J. C., Tiwari, V. S., and Anis, H. (2011). Optimal Size of Silver Nanoparticles for Surface-Enhanced Raman Spectroscopy. J. Phys. Chem. C 115, 1403–1409. doi:10.1021/jp106666t
Tortorich, R., and Choi, J.-W. (2013). Inkjet Printing of Carbon Nanotubes. Nanomaterials 3, 453–468. doi:10.3390/nano3030453
Wu, Z., Chen, Z., Du, X., Logan, J. M., Sippel, J., Nikolou, M., et al. (2004). Transparent, Conductive Carbon Nanotube Films. Science 305, 1273–1276. doi:10.1126/science.1101243
Yusof, Y., Zaidi, M. I., and Mohd Johan, R. (2016). Enhanced Structural, Thermal, and Electrical Properties of Multiwalled Carbon Nanotubes Hybridized with Silver Nanoparticles. J. Nanomater. 2016, 6141496. doi:10.1155/2016/6141496
Zhang, X., Zhang, J., Quan, J., Wang, N., and Zhu, Y. (2016). Surface-enhanced Raman Scattering Activities of Carbon Nanotubes Decorated with Silver Nanoparticles. Analyst 141, 5527–5534. doi:10.1039/c6an00850j
Keywords: CNT, silver nanoparticles, aerosol jet deposition, additive Manufacturing, electrical Properties
Citation: Schulman O, Samira R and Lachman N (2022) Composites Made of Carbon Nanotubes and Silver Nanoparticles for Conductive Aerosol-Jet Deposition Ink: The Double-Edged Sword of Functionalization. Front. Mater. 9:827740. doi: 10.3389/fmats.2022.827740
Received: 02 December 2021; Accepted: 27 April 2022;
Published: 20 May 2022.
Edited by:
Lazaros Tzounis, Hellenic Mediterranean University, GreeceReviewed by:
Youngseok Oh, Korea Institute of Materials Science, South KoreaCopyright © 2022 Schulman, Samira and Lachman. This is an open-access article distributed under the terms of the Creative Commons Attribution License (CC BY). The use, distribution or reproduction in other forums is permitted, provided the original author(s) and the copyright owner(s) are credited and that the original publication in this journal is cited, in accordance with accepted academic practice. No use, distribution or reproduction is permitted which does not comply with these terms.
*Correspondence: Noa Lachman, bm9hbGFAdGF1ZXgudGF1LmFjLmls
Disclaimer: All claims expressed in this article are solely those of the authors and do not necessarily represent those of their affiliated organizations, or those of the publisher, the editors and the reviewers. Any product that may be evaluated in this article or claim that may be made by its manufacturer is not guaranteed or endorsed by the publisher.
Research integrity at Frontiers
Learn more about the work of our research integrity team to safeguard the quality of each article we publish.