 Xuguang Li1
 Yu Wang
94% of researchers rate our articles as excellent or good
Learn more about the work of our research integrity team to safeguard the quality of each article we publish.
Find out more
ORIGINAL RESEARCH article
Front. Mater., 06 January 2023
Sec. Structural Materials
Volume 9 - 2022 | https://doi.org/10.3389/fmats.2022.1104566
This article is part of the Research TopicPhysico-Mechanical Properties and Treatment Technology of Hazardous GeomaterialsView all 23 articles
This paper aims to reveal the fatigue damage and instability behaviors of mud-shale under multistage increasing-amplitude fatigue loading. The fatigue loading tests combined with real-time acoustic emission (AE) monitoring technique were employed to investigate the influence of water content on the deformation, damage, and fracture characteristics. Testing results show that rock fatigue life decreases with the increase of water content, and the hysteresis curve changes regularly with time. The failure process can be divided into three stages: initial stage, stable development stage and acceleration stage. The acoustic emission output activities were also influenced by the water content. The acoustic emission ring count and acoustic emission energy both decrease with increasing water ratio and the accumulative count and energy are the least for a sample having high water ratio. The acoustic emission activity shows a sudden increase trend at the amplitude-increasing moment, indicating the occurrence of strong damage within rock sample. The damage propagation within a cyclic loading stage is relatively small compared to the stress-increasing moment. The results are helpful to understand the fatigue mechanical responses of water-sensitive soft rock, as well as the slope stability of the open-pit mine. The research results have important theoretical and practical significance for promoting slope treatment and disaster prevention.
Soft rock is extensively distributed in nature, which has an important influence on the stability of slope engineering. The slope stability of soft rock has been paid more and more attention and studied by more and more scholars. In the field of geotechnical engineering, soft rock has unique physical and mechanical properties, exhibits obvious rheological characteristics under the action of external factors, and has obvious time effect (Guo et al., 2012; Li et al., 2012; Cerfontaine and Collin 2018; Hashemnejad et al., 2021; Bai et al., 2022b; Wang et al., 2022a; Wang et al., 2022b; Wang et al., 2022c) Therefore, soft rock has always been a key and difficult problem in the study. In many soft rock open pit slopes, the rock mass is usually subjected to continuous and repeated stress disturbance, which will affect the stability of the slope and cause slope instability accidents and disasters. In practical engineering, cyclic loading and unloading are closer to the actual engineering situation. Exploring the influence of cyclic loading on rock structural deterioration and instability is of importance to ensure the long-term stability of mining slopes.
Plenty of attempts have been performed to reveal the mechanical response of rock subjected to cyclic loads. The effect of stress frequency, stress amplitude, stress level on rock strength (Singh 1988; Singh, 1989), deformation (Voznesenskii et al., 2016; Fan et al., 2019; Bai et al., 2021), hysteresis ratio (Song et al., 2012; Chen et al., 2017; Guo et al., 2018), energy dissipation (Peng et al., 2020; Song et al., 2020) and failure modes (Liu et al., 2018; Vaneghi et al., 2018; Wang et al., 2023) were investigated in the laboratory. Among the factors affecting rock fatigue mechanical behavior, stress amplitude and loading frequency have always been the focus of research. Bagde and Petros, (2005) carried out cyclic loading tests on complete sandstone samples from a coal mine and found that loading frequency and stress amplitude had a great influence on rock dynamic behavior. Liu et al. (2012) conducted a triaxial cycle test on sandstone and found that dynamic frequency has a great influence on dynamic deformation, dynamic stiffness and failure mode. Roberts et al. (2015) studied the creep and expansion behavior of salt rock under fatigue load and revealed the deformation characteristics of salt rock. Momeni et al. (2015) carried out cyclic loading tests on granite samples and found that maximum stress level and frequency have greater influence on fatigue behavior than amplitude. They also found that rock fatigue life increases with increasing frequency and decreasing maximum stress level. Taheri et al. (2017) conducted a cyclic loading test on lignite and found that the cyclic loading and cumulative irreversible axial strain had little effect on the mechanical properties of lignite. Meng et al. (2020) revealed the effect of loading frequency on fracture and acoustic emission modes rock with pre-flaws, and found that rock bridges are prone to fracture at lower dynamic frequencies. Zheng et al. (2020) revealed the dynamic and damage properties of artificial jointed rock samples under triaxial cyclic loads with different dynamic frequency, they found that the loading frequency impacts the irreversible strain, and the axial, radial and volumetric strain exhibit different evolution pattern.
Although the influences of fatigue loading parameters on rock damage and fracture have been widely studied, most of the studies are focusing on intact and pre-flawed hard rock, such as granite, marble, basalt, limestone, diorite, and also the block-in-matrix-rocks (Al-Shayea 2004; Zhou et al., 2015; Xu et al., 2021; Wang et al., 2022d; Wang et al., 2023). Investigations on the fatigue mechanical behaviors of water-sensitive rock, e.g., mud-shale in this work, exposed to cyclic loads are relatively less, especially the influence of water content on the deformation and damage evolution are rarely reported. As a result, this work emphatically investigates the influence of water content on mechanical responses of mud-shale, which is a kind of typical soft work, to reveal the damage and fracture characteristics. This study can give new insight into the fracture and instability of water-sensitive mud-shale and the associated long-term stability predication to soft rock engineering.
The tested rock material was obtained from the west open-pit mining area, which is located in the southwest of Fushun city, Liaoning Province. The Fushun west open pit was built in the early 20th century, is a mining with hundreds of years history of open-pit mine, since last century west open pit mining, formed the things is about 6.6 km long, north and south is about 2.2 km wide, vertical excavation depth of about 400–500 m, large volume of 1.7 billion cubic meters of mine, and known as the largest open pit in Asia, as shown in Figure 1. The coal and oil shale are the two main minerals mined in the West open-pit mine, and Fushun, and the term of “coal capital”, was born from this mine. The tested mud shale is widely distributed in the north boundary of the West open pit slope, field drilling reveals the thickness distribution of the mud shale, as shown in Figure 2.

FIGURE 1. The overview of the Fushun west open pit slope and the sampling site.
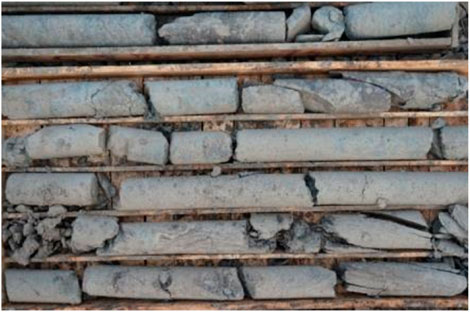
FIGURE 2. Drilling core of the mud-shale at a depth of 80–90 m.
The sample used in this study is a cylinder with a diameter of 50 mm and a height of 100 mm. Considering the test accuracy, all the rock samples in this test are refined and cut and ground with high precision, so as to ensure that the external dimensions of the rock samples are within the corresponding measurement accuracy requirements and meet the requirements of international rock mechanics: 1) The non-parallelism error of the two end faces should not exceed 0.05 mm; 2) The roughness error of the end face shall not exceed 0.02 mm; 3) The maximum deviation of the vertical axis of the end face shall not exceed 0.25. A non-destructive immersion test device is used to prepare mud-shale with different water content, and the water ratio is 0%, 2.11%, 2.56%, 4.36%, and 6.25%, respectively. The mass loss of the mud-shale is also shown in Table 1, it is shown that the loss ratio increases with the increase of water ratio. During the test, it is observed that rock surface material peeling off gradually, and with the infiltration of water, the presence of water on the mud shale pore fissure have softening effect, causing damage to the internal structure of the rock.
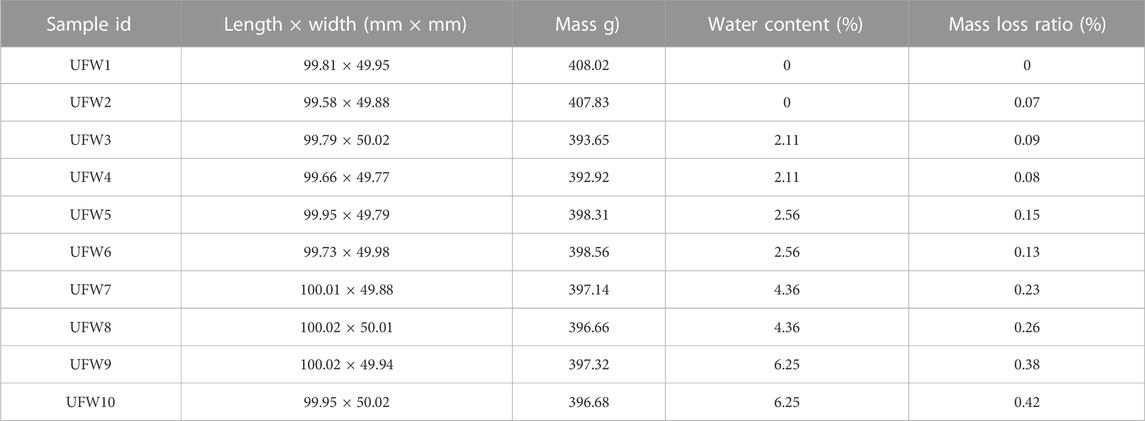
TABLE 1. Description of the basic physical state and loading conditions for the samples.
In order to study the strength characteristics, deformation evolution, and damage development of mud-shale under fatigue loads, a specially designed multi-stage cyclic loading and unloading compression test is designed. The stress-strain relationship curves and acoustic emission characteristics of mud-shale under different loading conditions were obtained by using the GCTS RTR 2000 rock mechanics testing machine. The detailed testing scheme is listed in Table 1. In order to study the water content on rock damage and instability, multi-stage uniaxial cyclic loading testing with a stress-control mode was employed in this work. The disturbed stress is applied with sinusoidal wave and the loading frequency is 0.1 Hz for all the tested rock, the stress amplitude of each cyclic loading stage was increased by 3.0 MPa, 30 cycles were applied at each stage.
Apart from the stress strain tests during the cyclic loading process, real-time acoustic emission technique was also employed to record the fracturing signals in order to record rock deformation, crack propagation, and the failure process. The AE monitoring can provide effective precursor information to predict the fracture and instability of rock mass under stress disturbance. The PAC AE monitoring system was used during the experiment. The maximum sampling rate was 1MSPS, the resolution was 18 bits, and the sampling filter frequency was 125–750 kHz. A kind of nano-30 AE sensor made from the PAC, United States of America, with its diameter of 6 mm × 6 mm and a resonance frequency of 300 kHz, was employed to record AE activities. The AE sampling interval was 50 μs, the sampling threshold was set to be 42 dB, and the sampling frequency range was 102∼104 Hz.
It can be seen from the specially designed loading path that the samples after different water treatment go through different fatigue loading stages and eventually fail. For each stage, a total of 30 cycles of loading and unloading are carried out in each fatigue loading stage. The samples having different water content fail at the seventh, fifth, third and third stages respectively. Therefore, the number of loading cycles experienced by the samples is also different, and the fatigue life is different. The total number of loading cycles of the typical samples with different water content are 154, 121, 65, 61, and 1, respectively, as shown in Figure 3. It can be seen that with the increase of water content, the number of loading cycles gradually decreases, and the fatigue life decreases accordingly. The results show that water content has obvious effect on the strength, deformation and fracture characteristics of shales, and the interaction between water and shales can change the internal structure of the rock and soften it. Therefore, it is not difficult to explain the test results that fatigue life decreases with the increase of water content. In order to further reveal the influence of water content on rock deformation and damage pattern, the stress-strain curves are also plotted, as shown in Figure 4.
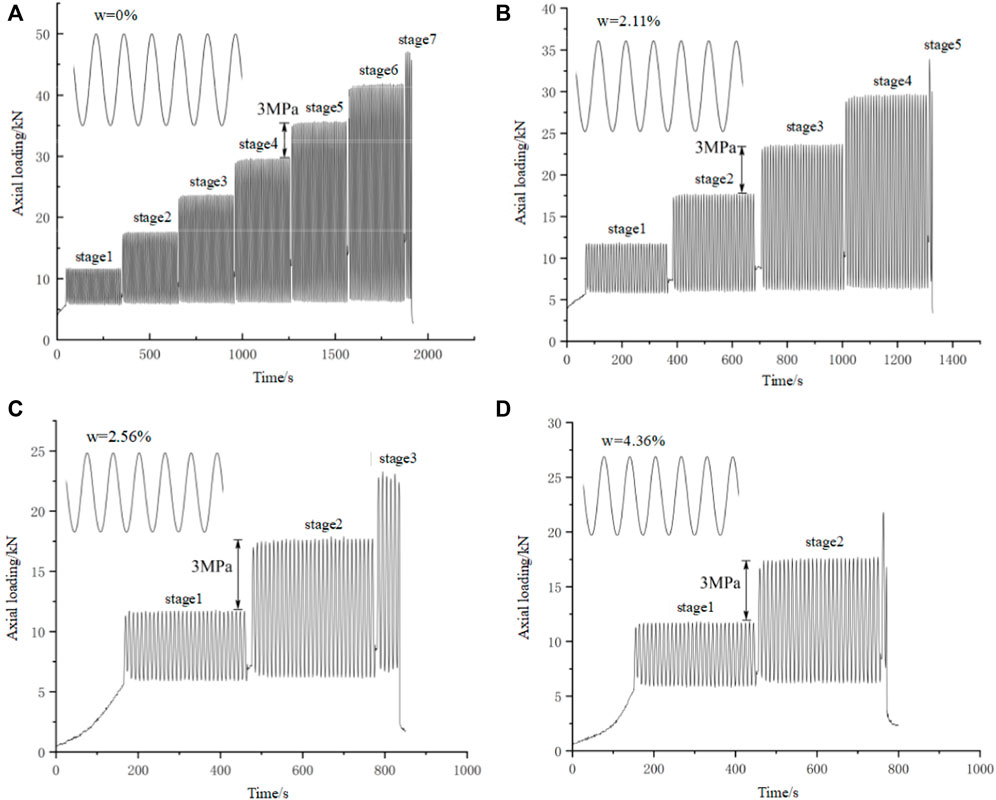
FIGURE 3. Specific stress path with different dynamic frequency for the tested mud shale samples. (A-D) The water content is 0%, 2.21%, 2.56%, and 4.36%, respectively).
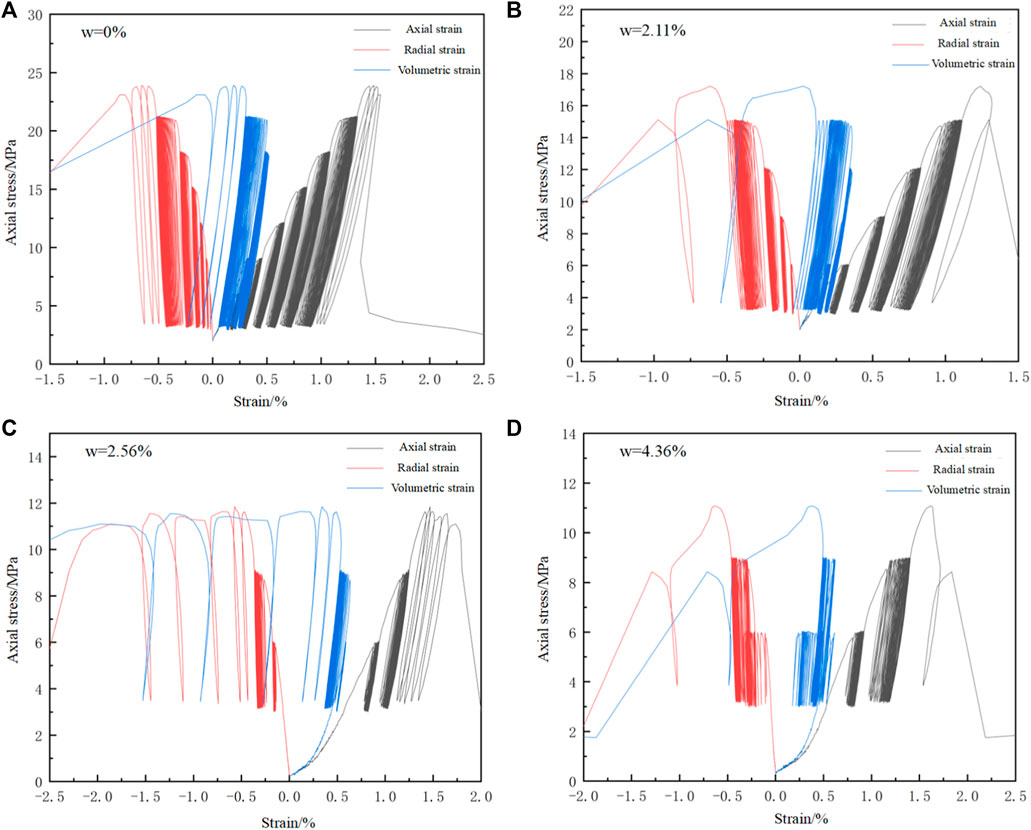
FIGURE 4. Typical axial, radial and volumetric stress strain curves (A-D) The water content is 0%, 2.21%, 2.56%, and 4.36%, respectively).
As can be seen from the stress-strain curve under cyclic loading, with the increase of testing time, the loading curve and unloading curve no longer overlaps. The curve in the loading stage is above the curve in the unloading stage, and the stress and strain are not synchronized, which is due to the plastic deformation inside the rock sample, resulting in the formation of hysteresis loops. The hysteresis curve varies with loading time. For each fatigue loading stage before failure, the hysteresis curve is sparse and then becomes intensive. The sparse shape of hysteresis curve is due to the large plastic deformation caused by the increase of stress amplitude, and then the formed cracks are gradually closed, and the hysteresis curve becomes dense. In each stage before the failure stage, the hysteresis curve shows a sparse to dense trend. However, the last failure stage of fatigue loading is different from the stage before failure, showing that the hysteretic curve of the sample is very sparse until failure occurs. The morphological characteristics of hysteresis curve in the loading process reflect the changes of the deterioration of meso-structure inside rock, which is closely related to the initiation and propagation behavior of cracks. The testing results also reveal that the fatigue damage of the tested rock is maximum at the beginning of each stage, that is, the moment when the stress amplitude increases.
When the moisture content is 6.25%, the rock strength decreases greatly and the damage occurs after only one cycle of loading and unloading. Figure 5 shows its loading curve, it can be seen from Fgi.5 b that the curve morphology is similar to the failure curve under uniaxial compression. Therefore, its loading path and stress-strain curve are listed separately. When the water content is 6.25%, the rock strength is very low.
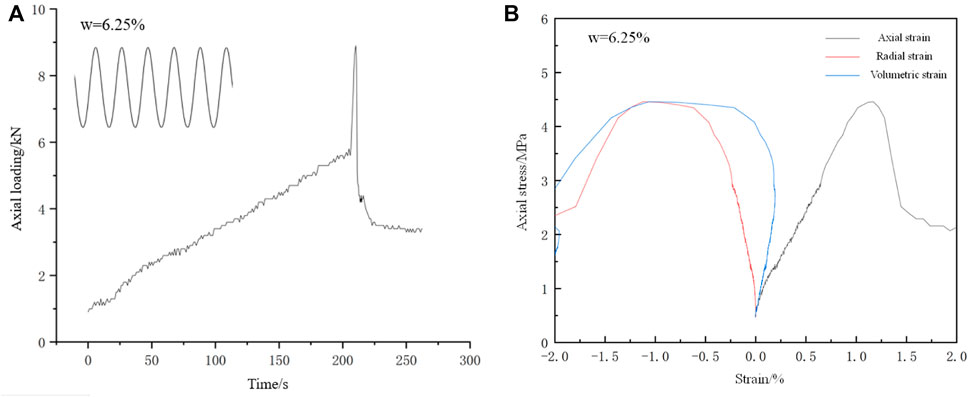
FIGURE 5. The loading path and complete stress strain responses with moisture content of w = 6.25%. (A) The loading path; (B) The axial, radial and volumetric stress strain curves.
In order to further study the influence of water content on its mechanical properties, according to the results of each group of tests, the test results were integrated to obtain the peak stress of shale after different water content treatments. It can be seen that under the same loading conditions, the peak stress after water treatment are 23.9 MPa, 17.3 MPa, 11.85 MPa, 11.1 MPa, 4.5 MPa, respectively. The order of peak stress is σmax (w = 0%) > σmax (w = 2.11%) > σmax (w = 2.56%) > σmax (w = 4.36%) > σmax (w = 6.25%), and the value decreases successively. The peak stress loss rate can be calculated by the peak stress, and the loss rates were 27%, 47.25%, 59.07%, and 81.01%, respectively. As can be seen from Figure 5, the peak stress loss rates of rock samples gradually increased with the increase of water content. When the water content is 6.25%, the peak stress loss rate of rock sample reaches to 80.01%, indicating that water treatment has a significant reduction effect on the mud-shale samples, the water-sensitive property of this rock is strong.
To summarize, the stress-strain curves of different water content are very different, and the peak strength of the rock sample with water content 6.25% is about 19% of that of the rock sample without water treatment. With the increase of water content, mud shale absorbs water and expands easily, and the rock mass structure changes gradually. From the microscopic perspective, the clay-like minerals near the mesenchymal surface of rock, such as chlorite and illite, interact with water, and water molecules enter the pores, resulting in the expansion of clay minerals and resulting in swelling stress. At the same time, in the process of immersion, the wetting angle decreases, and the surface tension of particles in the rock also decreases. The combined effect of several factors reduces the internal bonding force of the rock, showing that the rock softens and decreases its strength on the macro level.
The deformation of rock increases with the increase of loading period, and the increase rate is affected by loading stage and water content. The relationship between the axial, radial and volumetric strains and the testing time is shown by the deformation curve of the rock during the whole test time. As shown in Figure 6, the axial, radial and volumetric strains are small when the number of loading cycles is small. However, after a certain number of loading cycles, the incremental rate of axial, lateral and volumetric strains change obviously until failure. It can be seen that in the several stages before failure, the deformation amount of the fatigue cycle increases steadily in each stage; however, when the applied amplitude changes, that is, when the loading stage changes, the deformation increases substantially.
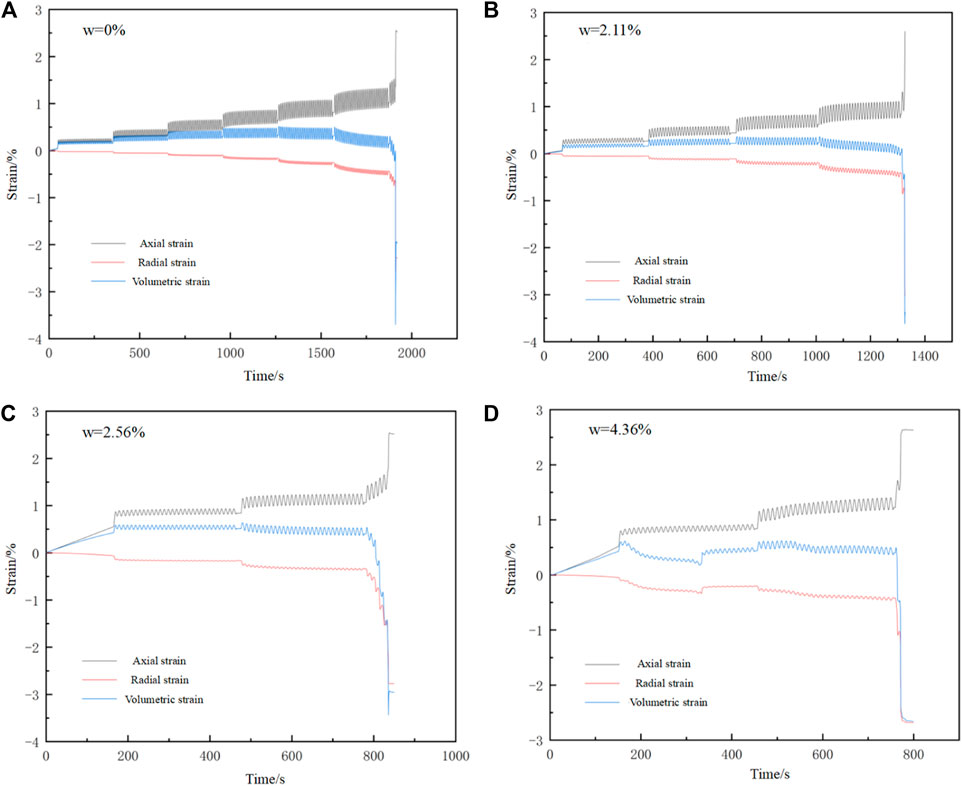
FIGURE 6. Deformation evolution characteristics (A-D) Plots of the axial, radial and volumetric strain for rock with water content of 0%, 2.21%, 2.56%, and 4.36%, respectively).
At the last loading stage, the deformation growth rate reaches the maximum, and the specimen deformation becomes large until failure. During the whole process of failure, the rate of change gradually increases. For rock samples with water content of 2.56%, 4.36%, and 6.25%, the volumetric strain in the first cycle at the time of failure increases significantly compared with the sample with water ratio of 0% and 2.11%. The sample having relative high water content results in relatively large volumetric expansion, indicating that water affects the structure of the sample, ot has obvious softening effect on the rock mass, and the plasticity of the sample is enhanced.
The deformation characteristics of the sample can be described more intuitively by drawing the relation curve between deformation and fatigue cycles, as shown in Figure 7. It can be seen that as the number of fatigue cycles increases, the axial and lateral growth rates increase. In the last stage of fatigue loading, the axial and transverse strains increase sharply with the increase of loading cycles. In the loading process, when the loading phase changes, the deformation increases greatly with the sudden increase of stress. The essence of the rapid increase of specimen deformation is that the sudden increase of stress causes great damage to the rock. In the same stage of initial loading, the deformation gradually tends to be stable. This is because the loading stress is small and the amplitude change is small, and the rock is in the adaptation and adjustment stage of cyclic loading. The essence of specimen deformation is the result of stress adjustment of each component inside the material. At the final failure stage, the deformation of the specimen increases sharply.
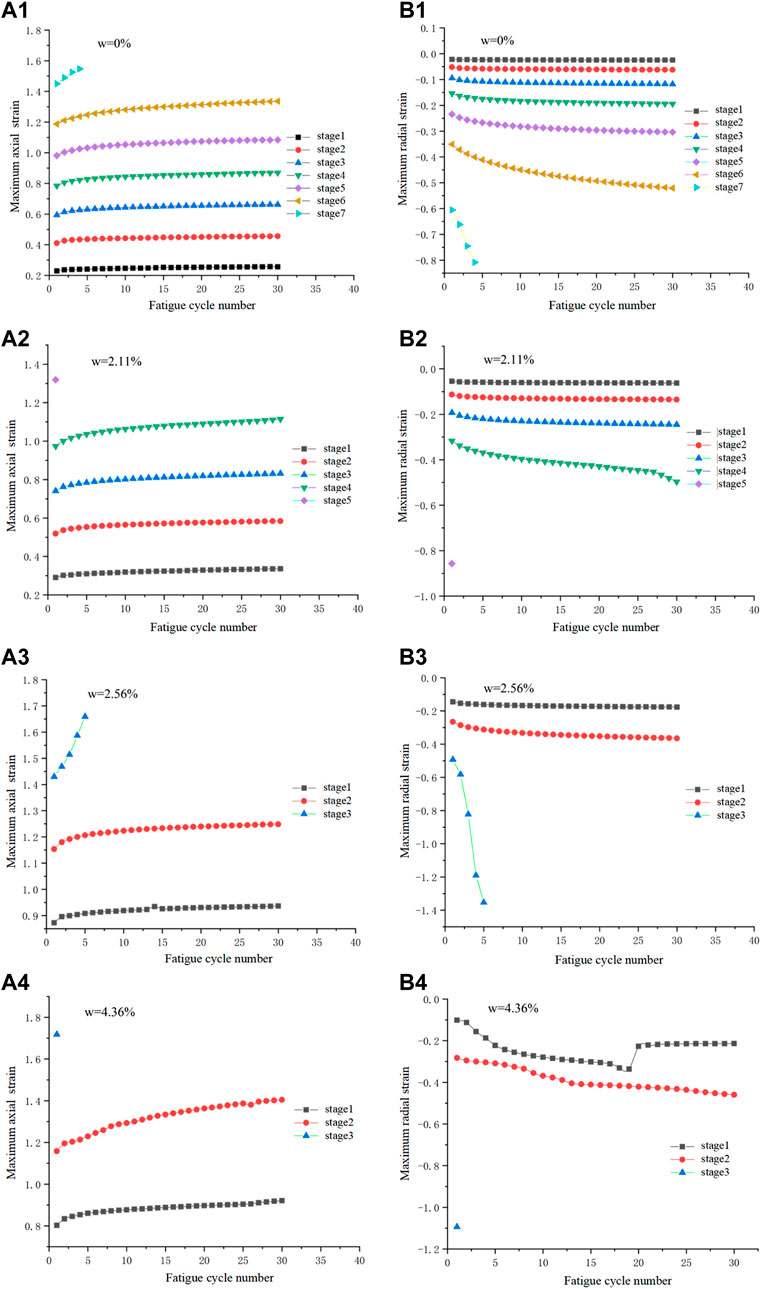
FIGURE 7. Depict of maximum axial and radial strain with cyclic number at various cyclic loading stage (A1-A4) Plots of the maximum axial strain against cycle number for rock with water content of 0%, 2.21%, 2.56%, and 4.36%, respectively; (B1-B4) Plots of the maximum radial strain against cycle number for rock with water content of 0%, 2.21%, 2.56%, and 4.36%, respectively).
To better describe the influence of axial deformation (εa) and radial deformation (εr) on the volumetric strain (εv), the volumetric strain (εv) of the sample was calculated according to the formula (εv = εa+2εr). The volumetric strain reflects the combined effect of axial and radial deformation on specimen deformation, as shown in Figure 8.
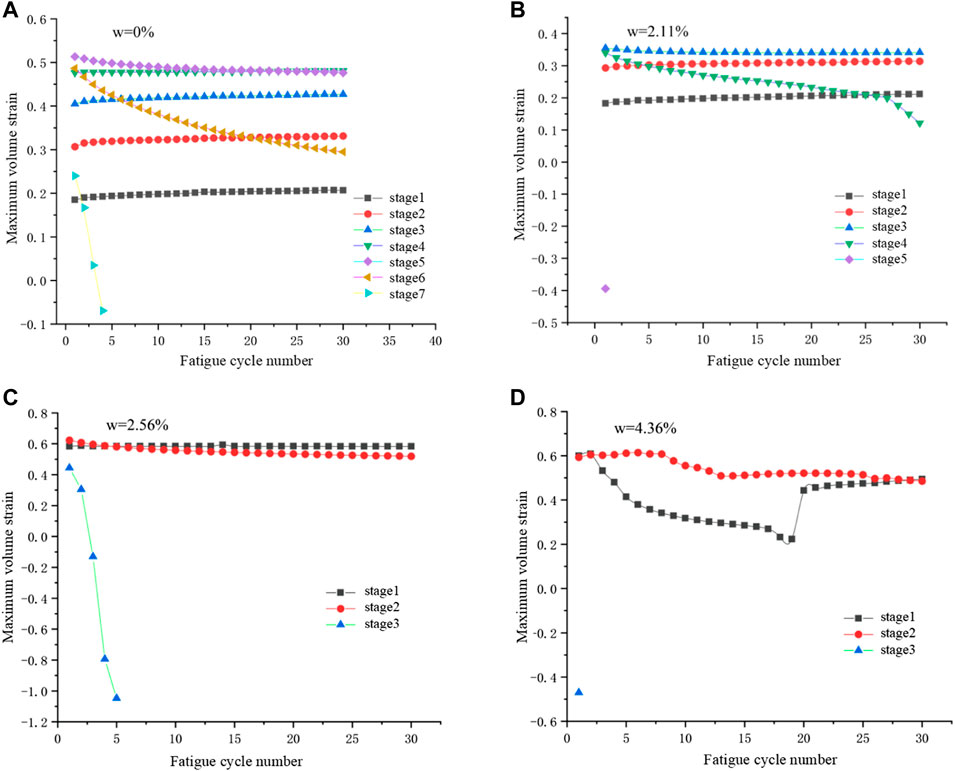
FIGURE 8. The aximum volumetric strain versus cyclic number at various cyclic loading stage (A–D): The rock with water content of 0%, 2.21%, 2.56%, and 4.36%, respectively).
As can be seen from the relationship diagram between loading stage and strain in Figure 9, the axial strain of rock approximately changes linearly with the fatigue loading stage. The change rate of axial cumulative strain at each stage of the loading process basically remains unchanged, which is related to the loading conditions of the sample. The changing rate of the radial cumulative strain increases gradually. As can be seen from the volumetric strain, the maximum volumetric strain experienced compression-dominant stage to the expansion-dominant stage before failure. This phenomenon is more significant for the rock samples with water content of 0% and 2.11%.
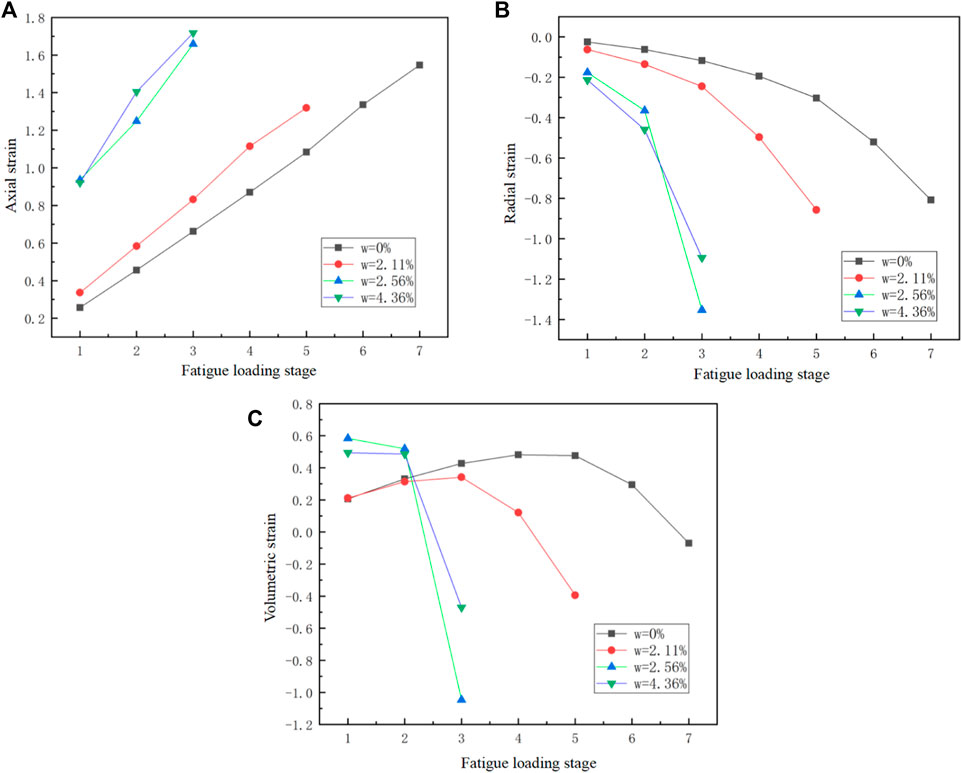
FIGURE 9. Plots of the relationship between the maximum axial strain (A), maximum radial strain (B), and the volumetric strain (C) against fatigue loading stage.
The stress-strain curves reflect the macroscopic fracture evolution characteristics of rock samples. The acoustic emission activities recorded during the deformation of samples provides effective information for understanding the meso-fracture process of rocks. Figure 10 shows the relationship between the number of AE rings, axial stress and the experimental time. It can be seen from the change of acoustic emission ringing number during the whole loading process that the acoustic emission ringing number increases obviously at the beginning of each fatigue loading stage due to the sudden increase of axial stress. The sudden increase of axial stress leads to crack propagation in the rock sample. In the fatigue loading stage, the acoustic emission ringing number increases rapidly in the first several cyclic loading stages. However, the acoustic emission ringing counts increased faster in the last few loading stages. The occurrence and increase of AE ringing count are caused by the damage of the meso-structure inside the rock sample. The AE ring count gradually increases with the increase of the number of loading cycles. The progressive increase of the AE cumulative ringing count also indicates a sudden increase in AE ringing count at the beginning of each fatigue loading stage. As can be seen from the curve of AE cumulative ringing count, its value is increasing, indicating that the cumulative damage, crack initiation, propagation and coalescence behaviors of rock samples.
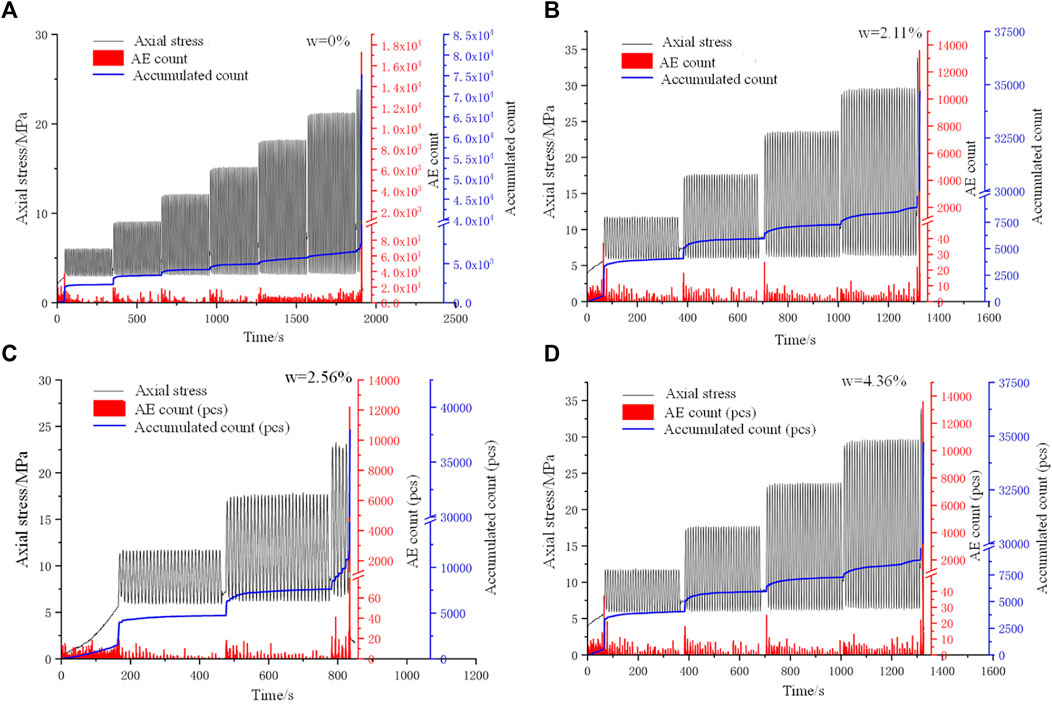
FIGURE 10. The AE ring count and AE accumulative ring count distribution versus experimental time. (A-D) The tested rock samples with water content of 0%, 2.21%, 2.56%, and 4.36%, respectively).
By comparing the AE ringing count curves for samples with different water ratio, it can be found that the cumulative acoustic emission ringing count decreases with the increase of water ratio. Especially for the sample having a water ratio of 4.36%, the ringing count is significantly reduced compared with the samples having other water content. At the first few stages before the sample failure, the AE ringing count activities present sporadic distribution, and the value is very small, and the AE phenomenon is very weak.
In order to further reveal the influence of water content on AE output, the relationships between the energy/cumulative energy count, and fatigue loading stage are plotted in Figure 11. For the AE non-destructive testing, the energy of AE signal is a parameter related to the amplitude and amplitude distribution of the signal. It is defined from the signal waveform, rather than the actual physical energy released by the AE source. However, AE energy is still of great significance for measuring and evaluating the fracture and damage degree of materials. It can be seen from the curves that at the beginning of each loading stage, the energy count has a sudden increase, and the cumulative energy count jumps up in each stage, showing obvious energy growth. This is due to the sudden increase of stress at the following fatigue loading stage, the occurrence structural failures, and the release of a large number of stress waves, leading to the rapid growth of the AE energy accumulation curve. Throughout the whole failure process, the AE energy count increases with the increase of loading stage. The cumulative AE energy counts changed in two stages, first increasing stably and then increasing rapidly. The stable stage is the steady damage of the internal structure and the gradual expansion of cracks, while the sudden increase stage is the process of the final crack penetration. In addition, through comparing the different curves, the energy release is larger for a sample having low water content than those having high water content.
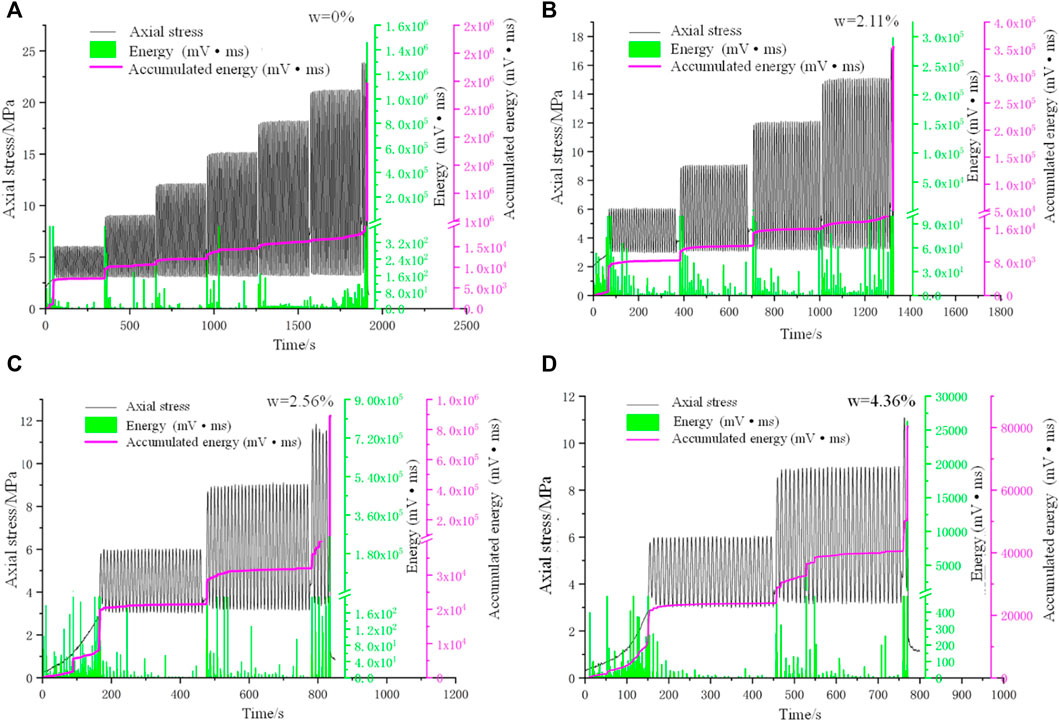
FIGURE 11. Plots of the AE energy and accumulative energy distribution against experimental time. (A-D) The tested rock samples with water content of 0%, 2.21%, 2.56%, and 4.36%, respectively).
The damage and failure mechanism of soft rock has been studied by many scholars, and it is widely believed that there are a large number of defects in soft rock, such as joints, cracks and pores, which affect the propagation path and related failure modes (Jiang et al., 2016; Liu et al., 2018; Bai et al., 2022a). At present, plenty of studies have been performed on soft rock, and the mechanical properties, energy loss, and deformation characteristics of soft rock under cyclic loading have attracted extensive attention. However, almost all of the research is about the natural dry conditions. It should be noted that the engineering soft rocks are frequently encountered with precipitation and groundwater seepage, especially is affected by seasonal changes. Its strength and other mechanical properties can change significantly, which impacts the stability of open pit slope. In this work, we consider the actual engineering state of mud-shale, rock samples with different water contents were produced. Cyclic loading and unloading tests were carried out on mud shale under different water ratio. Through the analysis of stress-strain and acoustic emission data, the evolution law of deformation and failure of mud shale under different water ratio was revealed. The effect of water content on damage mechanics and acoustic emission characteristics of shale is deeply explored.
In this study, it is found that water will cause the changes in the internal structure of mud-shale, which has a softening effect on it. With the increase of water content, the mass loss rate shows the characteristics of gentle at first and then rising sharply. In addition, different from previous studies, the cyclic mechanical properties of soft rock are discussed in more detail in this study. It is found that rock strength loss rate decreases gradually with the gradual increase of water content. The axial, radial and volumetric deformation show different trends. According to the volumetric strain, the sample will undergo dilatation before failure. In addition, the samples with low water content produced more ringing/energy counts than those with relatively high water content. It should be noted that soft rock has obvious rheological characteristics, and its creep deformation will seriously affect the stability of slope. In the further studies, deep investigations should be carried out to study creep and damage characteristics of mud shale and establish damage constitutive model. In addition, the influence of complicated fatigue loading paths, e.g., frequency, amplitude, waveform type, on the damage and instability of mud-shale need to be clariid in the next studies.
In this work, macroscopic mechanical tests combined with acoustic emission monitoring was performed on mud shale to reveal the influence of water content on the stress strain responses, deformation, and AE activities. Based on the above analysis, some key conclusions can be drawn as below:
1) With the gradual increase of water content, the number of loading cycles gradually decreases and the fatigue life decreases, indicating that the water ratio has an impact on the strength, deformation and fracture characteristics of shale.
2) The morphology of hysteresis curve changes with loading time. The hysteresis curve is sparse and becomes intensive in each fatigue loading stage before failure, while it is sparse in the final failure stage. At the same loading frequency, the axial strain changes approximately linearly with the fatigue loading stage, while the radial cumulative strain increases gradually. The maximum volume strain first increases steadily, then decreases steadily, and finally decreases sharply to a negative value. Accordingly, the failure process of the sample can be divided into three stages: initial stage, stable development stage and acceleration stage.
3) With the increase of water ratio, the cumulative AE ringing count and AE energy increase accordingly. In the first few stages before failure, the ringing count of AE presents sporadic distribution, and the value is very small, and the AE phenomenon is very weak. However, in the last several stages, the AE ringing count is more active. There is a good correspondence between the whole process of AE energy and ringing count. Especially, the change of AE energy is consistent with ring count, indicating that ringing count and energy are basically proportional to each other in an AE signal event.
The raw data supporting the conclusions of this article will be made available by the authors, without undue reservation.
XL, review and editing; JW, methodology, conceptualization; HY, experiments, data analysis; YW, supervision, funding acquisition, project administration.
Geological Survey Project of CGS (DD20221730), and National Natural Science Foundation of China (52174069).
The authors declare that the research was conducted in the absence of any commercial or financial relationships that could be construed as a potential conflict of interest.
All claims expressed in this article are solely those of the authors and do not necessarily represent those of their affiliated organizations, or those of the publisher, the editors and the reviewers. Any product that may be evaluated in this article, or claim that may be made by its manufacturer, is not guaranteed or endorsed by the publisher.
Al-Shayea, N. A. (2004). Effects of testing methods and conditions on the elastic properties of limestone rock. Eng. Geol. 74 (1-2), 139–156. doi:10.1016/j.enggeo.2004.03.007
Bagde, M. N., and Petroš, V. (2005). Fatigue properties of intact sandstone samples subjected to dynamic uniaxial cyclical loading. Int. J. Rock Mech. Min. Sci. 42, 237–250. doi:10.1016/j.ijrmms.2004.08.008
Bai, B., Bai, F., Li, X., Nie, Q., Jia, X., and Wu, H. (2022a). The remediation efficiency of heavy metal pollutants in water by industrial red mud particle waste. Environ. Technol. Innovation 28, 102944. doi:10.1016/j.eti.2022.102944
Bai, B., Wang, Y., Rao, D., and Bai, F. (2022b). The effective thermal conductivity of unsaturated porous media deduced by pore-scale SPH simulation. Front. Earth Sci. 10, 943853. doi:10.3389/feart.2022.943853
Bai, B., Zhou, R., Cai, G., Hu, W., and Yang, G. (2021). Coupled thermo-hydro-mechanical mechanism in view of the soil particle rearrangement of granular thermodynamics. Comput. Geotechnics 137, 104272. doi:10.1016/j.compgeo.2021.104272
Cerfontaine, B., and Collin, F. (2018). Cyclic and fatigue behaviour of rock materials: Review, interpretation and research perspectives. Rock Mech. Rock Eng. 51 (2), 391–414. doi:10.1007/s00603-017-1337-5
Chen, X., Huang, Y., Chen, C., Lu, J., and Fan, X. (2017). Experimental study and analytical modeling on hysteresis behavior of plain concrete in uniaxial cyclic tension. Int. J. Fatigue 96, 261–269. doi:10.1016/j.ijfatigue.2016.12.002
Fan, J., Jiang, D., Liu, W., Wu, F., Chen, J., and Daemen, J. (2019). Discontinuous fatigue of salt rock with low-stress intervals. Int. J. Rock Mech. Min. Sci. 115, 77–86. doi:10.1016/j.ijrmms.2019.01.013
Guo, H., Ji, M., Zhang, Y., and Zhang, M. (2018). Study of mechanical property of rock under uniaxial cyclic loading and unloading. Adv. Civ. Eng. 2018, 1–6. doi:10.1155/2018/1670180
Guo, Z. B., Li, E. Q., Liu, J. W., and Wang, J. (2012). Study on deformation mechanism of deep soft rock roadway in daqiang coal mine of tiefa coal industry. Adv. Mater. Res. 542, 34–41. doi:10.4028/www.scientific.net/AMR.542-543.34
Hashemnejad, A., Aghda, S. M. F., and Talkhablou, M. (2021). Introducing a new classification of soft rocks based on the main geological and engineering aspects. Bull. Eng. Geol. Environ. 80 (6), 4235–4254. doi:10.1007/s10064-021-02192-8
Jiang, D., Fan, J., Chen, J., Li, L., and Cui, Y. (2016). A mechanism of fatigue in salt under discontinuous cycle loading. Int. J. Rock Mech. Min. Sci. 86, 255–260. doi:10.1016/j.ijrmms.2016.05.004
Li, Z. J., Li, S. B., and Zhao, X. L. (2012). Floor heave controlling technology of deep soft rock roadway. Appl. Mech. Mater. 170, 68–71. doi:10.4028/www.scientific.net/AMM.170-173.68
Liu, E., Huang, R., and He, S. (2012). Effects of frequency on the dynamic properties of intact rock samples subjected to cyclic loading under confining pressure conditions. Rock Mech. rock Eng. 45 (1), 89–102. doi:10.1007/s00603-011-0185-y
Liu, Y., Dai, F., Dong, L., Xu, N., and Feng, P. (2018). Experimental investigation on the fatigue mechanical properties of intermittently jointed rock models under cyclic uniaxial compression with different loading parameters. Rock Mech. Rock Eng. 51 (1), 47–68. doi:10.1007/s00603-017-1327-7
Meng, H. J., Wang, Y., Zhang, B., and Gao, S. H. (2020). Investigation on the effect of dynamic frequency on fracture evolution in preflawed rock under multistage cyclic loads: Insight from acoustic emission monitoring. Geofluids 2020, 1–15. doi:10.1155/2020/8891395
Momeni, A., Karakus, M., Khanlari, G. R., and Heidari, M. (2015). Effects of cyclic loading on the mechanical properties of a granite. Int. J. Rock Mech. Min. Sci. 77, 89–96. doi:10.1016/j.ijrmms.2015.03.029
Peng, K., Zhou, J., Zou, Q., and Song, X. (2020). Effect of loading frequency on the deformation behaviours of sandstones subjected to cyclic loads and its underlying mechanism. Int. J. Fatigue 131, 105349. doi:10.1016/j.ijfatigue.2019.105349
Roberts, L. A., Buchholz, S. A., Mellegard, K. D., and Düsterloh, U. (2015). Cyclic loading effects on the creep and dilation of salt rock. Rock Mech. Rock Eng. 48 (6), 2581–2590. doi:10.1007/s00603-015-0845-4
Singh, S. K. (1989). Fatigue and strain hardening behaviour of graywacke from the flagstaff formation, New South Wales. Eng. Geol. 26, 171–179. doi:10.1016/0013-7952(89)90005-7
Singh, S. K. (1988). Relationship among fatigue strength, mean grain size and compressive strength of a rock. Rock Mech. Rock Eng. 21, 271–276. doi:10.1007/bf01020280
Song, D., Wang, E., and Liu, J. (2012). Relationship between EMR and dissipated energy of coal rock mass during cyclic loading process. Saf. Sci. 50 (4), 751–760. doi:10.1016/j.ssci.2011.08.039
Song, S., Liu, X., Tan, Y., Fan, D., Ma, Q., and Wang, H. (2020). Study on failure modes and energy evolution of coal-rock combination under cyclic loading. Shock Vib. 2020, 1–16. doi:10.1155/2020/5731721
Taheri, A., Squires, J., Meng, Z., and Zhang, Z. (2017). Mechanical properties of Brown coal under different loading conditions. Int. J. Geomechanics 17 (11), 06017020. doi:10.1061/(asce)gm.1943-5622.0000993
Vaneghi, R. G., Ferdosi, B., Okoth, A. D., and Kuek, B. (2018). Strength degradation of sandstone and granodiorite under uniaxial cyclic loading. J. Rock Mech. Geotechnical Eng. 10 (1), 117–126. doi:10.1016/j.jrmge.2017.09.005
Voznesenskii, A., Kutkin, Y., Krasilov, M., and Komissarov, A. (2016). The influence of the stress state type and scale factor on the relationship between the acoustic quality factor and the residual strength of gypsum rocks in fatigue tests. Int. J. Fatigue 84, 53–58. doi:10.1016/j.ijfatigue.2015.11.016
Wang, Y., Mao, T., Xia, Y., Li, X., and Yi, X. (2022b). Macro-meso fatigue failure of bimrocks with various block content subjected to multistage fatigue triaxial loads. Int. J. Fatigue 163, 107014. doi:10.1016/j.ijfatigue.2022.107014
Wang, Y., Su, Y., Xia, Y., Wang, H., and Yi, X. (2022a). On the effect of confining pressure on fatigue failure of block-in-matrix soils exposed to multistage cyclic triaxial loads. Fatigue & Fract. Eng. Mater. Struct. 45 (9), 2481–2498. doi:10.1111/ffe.13760
Wang, Y., Tan, P. F., Han, J., and Li, Peng. (2023). Energy-driven fracture and instability of deeply buried rock under triaxial alternative fatigue loads and multistage unloading conditions: Prior fatigue damage effect. Int. J. Fatigue 168, 107410. doi:10.1016/j.ijfatigue.2022.107410
Wang, Y., Yi, X. F., Li, P., Cai, M. F., and Sun, T. (2022c). Macro-meso damage cracking and volumetric dilatancy of fault block-in-matrix rocks induced by freeze–thaw-multistage constant amplitude cyclic (F-T-MSCAC) loads. Fatigue & Fract. Eng. Mater. Struct. 45 (10), 2990–3008. doi:10.1111/ffe.13798
Wang, Y., Zhu, C., He, M., Wang, X., and Le, H. (2022d). Macro-meso dynamic fracture behaviors of xinjiang marble exposed to freeze thaw and frequent impact disturbance loads: A lab-scale testing. Geomechanics Geophys. Geo-Energy Geo-Resources 8 (5), 154–218. doi:10.1007/s40948-022-00472-5
Xu, J., Sun, H., Cui, Y., Fei, D., Lan, H., Yan, C., et al. (2021). Study on dynamic characteristics of diorite under dry–wet cycle. Rock Mech. Rock Eng. 54 (12), 6339–6349. doi:10.1007/s00603-021-02593-x
Zheng, Q., Liu, E., Sun, P., Liu, M., and Yu, D. (2020). Dynamic and damage properties of artificial jointed rock samples subjected to cyclic triaxial loading at various frequencies. Int. J. Rock Mech. Min. Sci. 128, 104243. doi:10.1016/j.ijrmms.2020.104243
Keywords: cyclic loads, mud-shale, fatigue deformation, acoustic emission, instability precursor
Citation: Li X, Wu J, Yang H and Wang Y (2023) On the effect of water content on fatigue mechanical behaviors of mud-shale under stress disturbance conditions. Front. Mater. 9:1104566. doi: 10.3389/fmats.2022.1104566
Received: 21 November 2022; Accepted: 21 December 2022;
Published: 06 January 2023.
Edited by:
Xianze Cui, China Three Gorges University, ChinaReviewed by:
Qian Yin, China University of Mining and Technology, ChinaCopyright © 2023 Li, Wu, Yang and Wang. This is an open-access article distributed under the terms of the Creative Commons Attribution License (CC BY). The use, distribution or reproduction in other forums is permitted, provided the original author(s) and the copyright owner(s) are credited and that the original publication in this journal is cited, in accordance with accepted academic practice. No use, distribution or reproduction is permitted which does not comply with these terms.
*Correspondence: Yu Wang, d3l6aG91QHVzdGIuZWR1LmNu
Disclaimer: All claims expressed in this article are solely those of the authors and do not necessarily represent those of their affiliated organizations, or those of the publisher, the editors and the reviewers. Any product that may be evaluated in this article or claim that may be made by its manufacturer is not guaranteed or endorsed by the publisher.
Research integrity at Frontiers
Learn more about the work of our research integrity team to safeguard the quality of each article we publish.