 Shixuan Yi*
- Structural Engineer, Guangzhou Metro Design & Research Institute Co., Ltd., Guangzhou, China
This study applied the three-dimensional finite different method (FDM) to model a single pile subjected to passive loading due to a new embankment in extensively soft soil. Four important parameters (pile bending stiffness, distance between the long edge of the loading area and the pile (D), embankment height, and cushion thickness) were investigated to evaluate their effects on the deformations and stresses on the passive pile. The displacement of the pile shaft, vertical displacement of the foundation soil, excess pore water pressure (EPWP), and lateral earth pressure were analyzed. The numerical results showed that the lateral displacement of the pile was significantly affected by the four parameters. The maximum lateral displacement decreased dramatically for the high-stiffness pile. A cushion thickness of <1 m slightly increased the lateral displacement of the pile. Increased D value and decreased embankment height significantly reduced the lateral displacement of the pile. The vertical displacement of the loading area was unaffected by pile stiffness. The distribution shape of the vertical displacement was close to symmetrical with increasing D value. The embankment height and cushion thickness significantly affected the vertical displacement. Due to the low permeability of the foundation soil and short construction time, the EPWP was not fully dissipated with varying pile stiffness and D values. A decreased pile stiffness increased the lateral earth pressure at the pile, while increasing embankment height and cushion thickness increased the lateral earth pressure.
Introduction
Pile foundations unavoidably experience lateral soil movement due to nearby excavation, surcharge load, tunneling, and moving slopes, which differs from the vertical (e.g., superstructure) and horizontal (e.g., wind) loads acting on the pile head. Piles experiencing these forces are referred to as passive piles, the design of which generally consider pile-soil relative stiffness, rotational constraints, and possible dragging (Guo, 2003). Guo et al. (2017) reported that soil movement and profile were critical for passive pile design. Particularly, the failure of passive piles was generally governed by lateral deformation rather than the bearing capacity. The impact of lateral displacement is complex due to the complexity of pile-soil interactions. Many studies have investigated the deformations and stresses of passive piles under different situations.
Field tests (Ong, 2018), model tests (Sabbagh et al., 2019; Al-abboodi et al., 2020; Karkush and Jaffar, 2020), theoretical studies (Zhang et al., 2020a; Bellezza, 2020; Bai et al., 2021; Ramalakshmi, 2021), and numerical analyses (Karim, 2013; Karim et al., 2014; Abo-Youssef et al., 2021; Li et al., 2021; Bai et al., 2022a) on passive piles have provided valuable results. Karkush et al. (2020) conducted model tests to study single piles adjacent to embankment construction and found that the vertical load acting on top of the passive pile increased the soil resistance. Zhang et al. (2020b) proposed a load transfer model for analyzing the pile-soil interaction and provided a semi-analytical solution. Al-abboodi and Sabbagh (2019) used Plaxis3D to investigate the group piles under soil movement in sand layers and identified a discrepancy between the predicted and test results. However, the study did not properly consider the relative lateral displacement between pile and soil and the density variation of sand. Cole (2003) reported that passive characteristics were often neglected in the design. The prediction methods lacked validation by field test data. Therefore, field tests are essential to investigate passive piles behavior. Yi and Liu (2022) performed field tests to study the effects of embankment load on the behaviors of the adjacent pile. Lateral deformation of the pile, lateral earth pressure, and excess water pressure were measured and analyzed during the construction of a 4 m thick embankment.
However, it is impractical to perform intensive field tests with changing parameters due to limited time, high cost, and poor repeatability (Bai et al., 2022b; Gu et al., 2022b; Shan et al., 2022; Yuan et al., 2022). Numerical methods allow comparative analyses by varying the parameters, which is a popular approach to overcoming the disadvantages of field tests. Yang et al. (2017) used 2D FEM models to conduct a parametric study. The results showed that the displacement in pile top under fast loading was about 1.4 times that under staged loading. Li et al. (2019) performed a series of field tests and established a 3D FEM model to analyze the behavior of piles subjected to surcharge loading. They found that the earth pressure facing the loading region was larger than that opposite the loading region. Zhang and Sun (2020) analyzed the deformation and migration law of soft soil for the pile under backfill surcharge using 3D FEM models. The results showed that the distance should be >120 m to reduce the impact of external load on the pile. Gu et al. (2022a) reported the results of a comprehensive investigation of a passive pile constructed in extensively deep soft soil using the three-dimensional finite difference method. They reported a much smaller horizontal resistance of the foundation soil compared to the proposed value based on the design code in the situation of large lateral deformations and high surcharge load.
The present study used the three-dimensional finite different method (FDM) to conduct a parametric study of passive piles subjected to adjacent surcharge load. The FDM model was established based on the numerical model proposed by Gu et al. (2022a), which was validated by the field measurements provided by Yi and Liu (2022). A series of 3D FDM models was developed to investigate the effect of four important factors (pile bending stiffness, distance between the long edge of the loading area and the pile, embankment height, and cushion thickness) on the behavior of a single steel pipe pile installed in extensively soft soil and subjected to adjacent surcharge loading.
Numerical simulation
The three-dimensional fast Lagrangian analysis of continuum FLAC3D (Itasca, 2018) was applied to study the behavior of a single pile installed in extensively soft soil under surcharge loading. The details of the field test and numerical model validated by the field test were described by Yi and Liu (2022) and Gu et al. (2022a), respectively. Briefly, the field test and numerical model applied in the present parametric study were as follows. Table 1 summarizes the parameter of the FDM models used to investigate the influence of the four important factors (pile bending stiffness, distance between the long edge of the loading area and pile, embankment height, and cushion thickness) on the behavior of passive pile. The successive values of four factors in the prototype FDM corresponding to the field test were 1.61 GPa, 1m, 4.8m, and 1.0 m. When one of the factors varied during the parametric study, the other factors were the same as in the prototype.
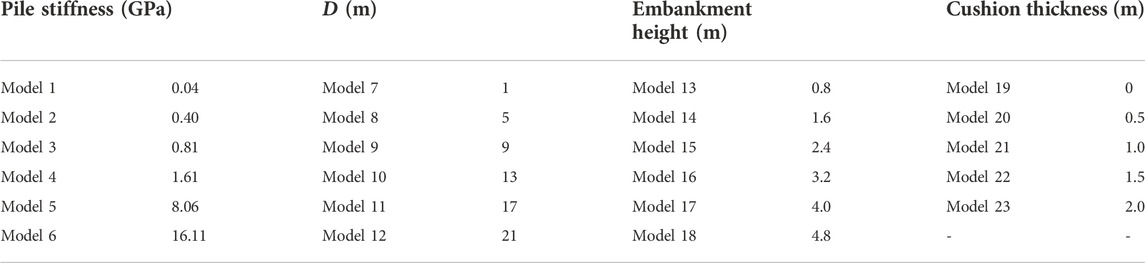
TABLE 1. Summary of FDM model parameters.
Figure 1 shows a photograph and general layout of the field test. A hollow cylindrical steel pipe pile with a 630 mm outer diameter and 35 m length (welded in three parts during piling) was manufactured to investigate the pile-soil interaction. The pile was 1 m away from the edge of the loading area (D value = 1 m in the real field test). Six inclinometer tubes 70 mm in outer diameter and 30 m in length were prepared to monitor the soil and pile deformation. Earth pressure cells and piezometers were also used to measure the earth pressure and pore water pressure (PWP), respectively. A 4-m high embankment was constructed in five lifts (each lift was 0.8 m thick and maintained for 3 days until the next lift) to simulate surcharge loading. The embankment fill length, width, and slope gradient were 24 m, 16 m, and 1:1.5, respectively. After all the instruments and structures were installed, the embankment was constructed (Bai et al., 2022b). The laws of lateral displacement of the pile, vertical displacement, excess pore water pressure (EPWP), and lateral earth pressure on the pile were investigated according to the parametric change in FDM. The monitored positions in the FDM are shown in Figure 1B.
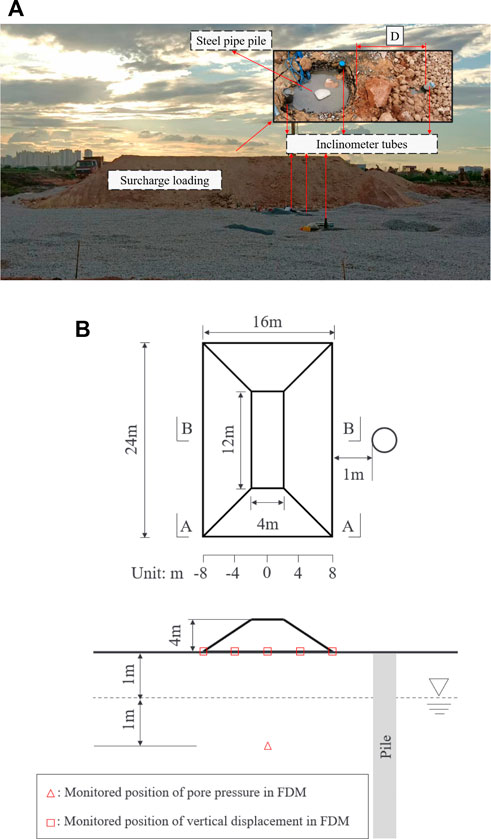
FIGURE 1. Schematic diagram of the real field test: (A) construction photograph; (B) general layout.
Figure 2 shows the profile and plan view of the numerical model in FDM that was calibrated against the real field test. The model was 46 m wide, 50 m deep, and 162.63 long. A zone-type element was used to simulate the foundation soil and surcharge loading (modeled as elastic materials). The gravel, sandy silt, and silty sand all used the Mohr-Coulomb constitutive model, while the Drucker-Prager constitutive model was used to model the sea-land sedimentary silt and mud. The pile-type and shell-type elements modeled as elastic materials were used to simulate the inclinometer tubes and steel pipe pile, respectively. The numerical model divided the 37 m of soft soil into six layers to capture the actual soil properties. The bottom and side surfaces of the foundation soil were fixed by normal velocity in the FDM to simulate the actual boundary conditions in the field. The zone-, pile- and shell-type elements were generated first, and their properties were assigned according to Table 1. The initial force balance of the model under gravity was conducted. Underground water was then introduced by setting the water table at 1 m below the ground surface. The PWP at the bottom surface of the first layer was then set to zero in the numerical model. Next, the fluid command was activated, and fluid balance was conducted after the fluid properties were assigned. The fluid density, modulus, and porosity were 1000 kg/m3, 2.18e9 Pa, and 0.60, respectively. The permeability of the second, third, fourth, and fifth soil layers were 1e-10, 1e-8, 1e-2, and1e-2 m/s, respectively. Surcharge loading was then carried out by activating the elastic fill layer in stages. The information was recorded by writing the fish function and history command.
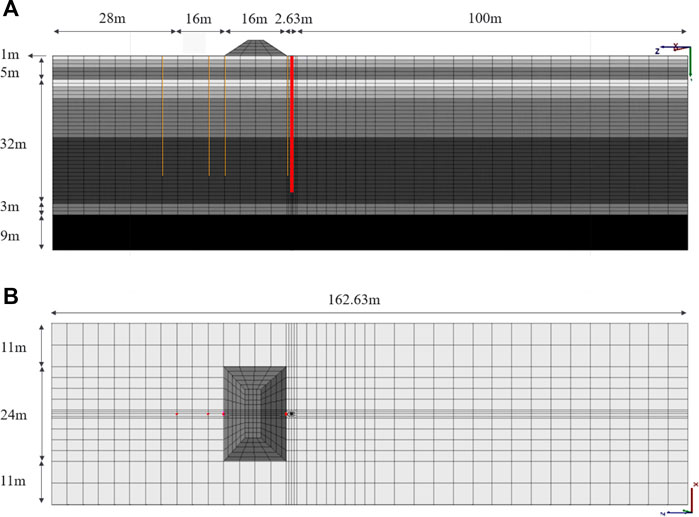
FIGURE 2. 3D FDM model of the real field test: (A) profile view; (B) plan view.
Results and discussion
Based on the literature review and test results, the following four critical factors were identified for a parametric study of the behavior of a single pile subjected to surcharge loading in extensively soft soil: 1) pile bending stiffness, 2) distance between the long edge of the loading area and the pile (D), 3) embankment height, and 4) cushion thickness.
Effect of pile stiffness
Figure 3 shows the variations in the lateral displacement of the pile at depths for different bending stiffness after the fifth loading. The lateral displacement at the ground surface increased with increasing bending stiffness. The displacement of the pile shaft decreased along the pile depth regardless of the bending stiffness. The maximum lateral displacements were 189.40, 198.74, 214.05, 236.11, 238.61, and 241.12 mm for bending stiffnesses of 0.04, 0.4, 0.81, 1.61, 8.06, and 16.11 GPa, respectively, and all appeared at the top of the pile. The decrease in pile bending stiffness significantly decreased the maximum lateral displacement of the pile compared to the real field test model in the FDM (i.e., a bending stiffness of 1.61 GPa), while only a slight increase in maximum lateral displacement was observed with increased bending stiffness. The vertical movement of the soil mainly appeared in the central loading area, as shown in Figure 4, and the distance had already existed between the loading area and the pile; thus, the soil movement pushing the pile was approximately 3 m below the ground surface combined with displacement vector of the foundation soil in the FDM. Therefore, the high-stiffness pile pushed by soil movement increased the maximum displacement, while the low-stiffness pile was the opposite due to gravel with relatively high performance in the first layer. However, the lateral displacement of the pile was almost unchanged at depths >8 m.
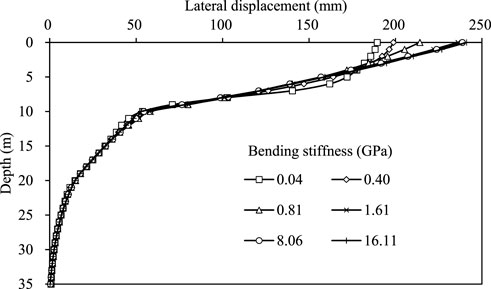
FIGURE 3. Lateral displacements of pile shafts with different bending stiffnesses after the fifth loading.
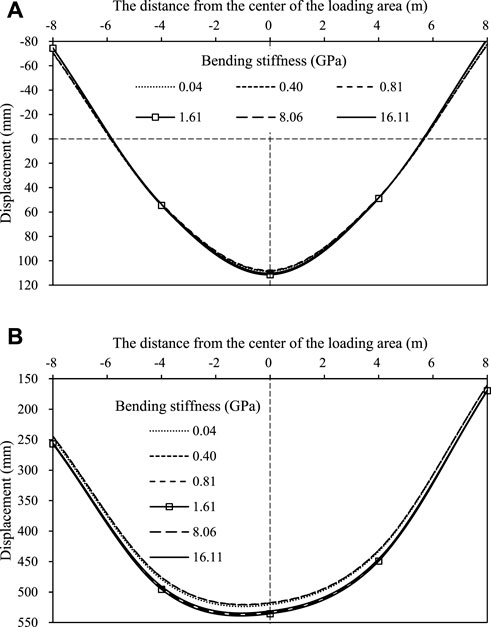
FIGURE 4. Foundation soil final vertical displacement in the bottom surface of the loading area at different pile bending stiffnesses at the (A) A-A and (B) B-B sections.
Figure 4 shows the variation in the final vertical displacement of the foundation soil at the ground surface in the loading area for different pile bending stiffnesses. The A-A section (short edge of the loading area) and the B-B section (center of the loading area) were monitored and shown in Figure 1. As shown in Figure 4A, the settlement (i.e., positive values) developed in the middle zone of the A-A section, with a distribution length of 12 m. In contrast, the corner of the A-A section developed an uplift (i.e., negative values) of 4 m in width. The distribution of vertical displacement was basically symmetrical in the A-A section due to its position away from the pile compared to the B-B section. Contrarily, the distribution of vertical displacement in the B-B section was not symmetrical due to its close proximity to the pile. The maximum settlement values in the A-A section were 108.68, 108.21, 107.78, 111.46, 110.72, and 110.26 mm for bending stiffnesses of 0.04, 0.4, 0.81, 1.61, 8.06, and 16.11 GPa, respectively. The maximum average uplift values were 74.50, 73.84, 74.08, 78.40, 78.48, and 78.17 mm bending stiffnesses of 0.04, 0.4, 0.81, 1.61, 8.06, and 16.11 GPa, respectively. As shown in Figure 4B, only positive values (i.e., settlement) were observed in the B-B section and were generally larger than those in the A-A section. The maximum settlement values in the B-B section were 520.65, 517.93, 517.51, 535.50, 533.28, and 531.21 mm for bending stiffnesses of 0.04, 0.4, 0.81, 1.61, 8.06, and 16.11 GPa, respectively. The vertical displacement for the low-stiffness pile in the B-B section was slightly larger than that of the high-stiffness pile, with a maximum variation of about 3.4% for a bending stiffness increase from 0.81 to 1.61 GPa. Therefore, the pile bending stiffness slightly impacted the final vertical displacement of the foundation soil at the ground surface in the loading area.
Figure 5 shows the excess pore water pressure (EPWP) versus the construction time for different bending stiffness. The monitored position of PWP was 1 m below the water table, as shown in Figure 1B). The EPWPs increased rapidly after the placement of each new lift and then slowly dissipated with time. The EPWP may not completely dissipate due to the extremely low permeability of the foundation soil and the limitation of construction time. Therefore, the EPWP continuously accumulated after each new lift was placed. The tendencies and values of EPWP at different bending stiffness were similar. Using a bending stiffness of 11.61 GPa as an example, the EPWP increments were approximately 33.9, 23.2, 12.2, 8.0, and 4.5 kPa after each lift loading, respectively. The EPWP increment decreased significantly and was nonlinear with increased surcharge loading. The results showed that the EPWP was nearly not dependent on the bending stiffness.
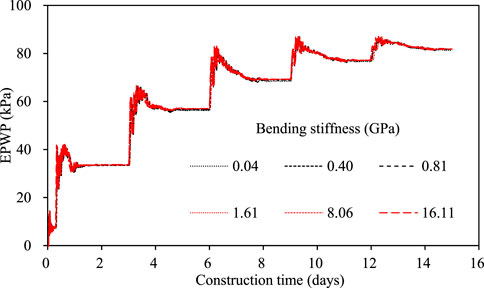
FIGURE 5. Variation in EPWP with construction time for different bending stiffnesses.
Figure 6 shows the variation in the lateral earth pressure with depth for different bending stiffness after the fifth loading. The lateral earth pressure acting at the pile was selected from the horizontal stress of the adjacent foundation soil zone in the numerical model. Lateral earth pressures at depths >2 m depth were almost unchanged for different bending stiffness, except for a bending stiffness of 0.04 GPa. The lateral earth pressure <2 m of ground surface decreased with increasing bending stiffness. The increment of lateral earth pressure <2 m of the ground surface reduced with increasing bending stiffness. Particularly, the lateral earth pressure changed slightly as the bending stiffness increased from 8.06 to 16.11 GPa. The lateral earth pressure values for the bending stiffness of 0.04 GPa were positive for different depths and typically increased with increased depth at the end of the fifth lift loading. The lateral earth pressure values for all bending stiffnesses were negative at a depth of 9 m, except for the bending stiffness of 0.04 GPa. The suction effect may explain the negative earth pressure, mainly in piles with relatively high bending stiffnesses.
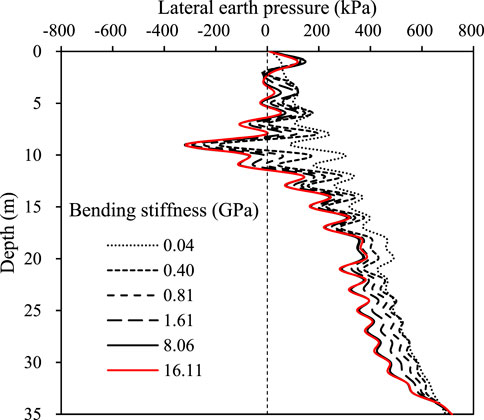
FIGURE 6. Distribution of lateral earth pressure with depth at different bending stiffnesses after the fifth loading.
Effect of D
The foundation soil directly contacted and pushed the passive pile under the surcharge load. The distance between the long edge of the loading area and the pile (D = 1, 5, 9, 13, 17, and 21 m) was important and selected as the critical factor in investigating its influence on the passive pile. Figure 7 shows the variations in lateral displacement with depth for different D values after the fifth loading. The lateral displacements of the pile for different D values decreased with increasing depth, with the fastest lateral displacement reduction rate observed at depths >10 m. The lateral displacement reduction rate of the pile was relatively slow at depts of 10–20 m; moreover, the lateral displacement of the pile did not change significantly with increasing D value for depths >20 m. Both the lateral displacement of the pile and its reduction rate decreased with increasing D value. The maximum lateral displacements of the pile were at the ground surface regardless of the D value, at 236.11, 144.13, 94.01, 68.10, 50.32, and 39.88 mm for D values of 1, 5, 9, 13, 17, and 21 m, respectively.
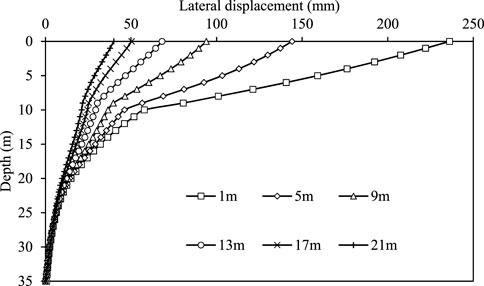
FIGURE 7. Lateral displacement of the pile shaft for different D values after the fifth loading.
Figure 8 shows the variations in the final vertical displacement of the foundation soil at the ground surface in the loading area for different D values. The shapes of settlement (i.e., positive values) and uplift (i.e., negative values) in Figure 8 are similar to those in Figure 4. The maximum settlement values in the A-A section were 111.46, 111.09, 110.54, 108.95, 107.03, and 104.30 mm for D values of 1, 5, 9, 13, 17, and 21 m, respectively. The maximum average uplift values were 78.40, 71.82, 72.25, 72.54, 73.50, and 75.16 mm for D values of 1, 5, 9, 13, 17, and 21 m, respectively. The maximum settlement values in the B-B section were 517.51, 559.34, 554.20, 551.29, 548.81, and 545.76 mm for D values of 1, 5, 9, 13, 17, and 21 m, respectively. The maximum settlement value in the A-A section decreased slightly with increased D value, except in the uplift zone. The maximum settlement value in the B-B section decreased slightly with increased D values except for the D value at 1 m. The vertical displacement shape for both sections tended to be symmetrical with increasing D value due to the gradually increasing distance of the loading area from the pile.
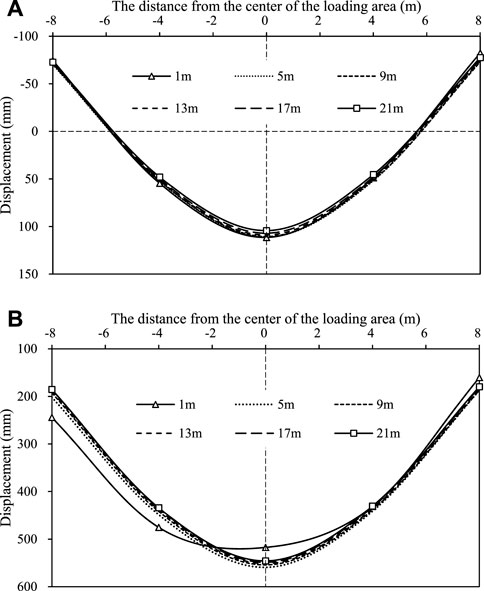
FIGURE 8. Foundation soil final vertical displacement in the bottom surface of the loading area for different D values at the (A) A-A and (B) B-B sections.
Figure 9 shows the EPWP versus the construction time for different D values. The change in EPWP for different D values was slight, at approximately 33, 57, 69, 76, and 80 kPa at the end of each lift for different D values. The changes in EPWP were approximately 33, 24, 12, 7, and 4 kPa after each lift loading, respectively. The EPWP decreased with increasing surcharge loading. The EPWP increased significantly after each new lift loading and then dissipated to a value within the maintenance time of 3 days due to the closing of the water table. The value of the EPWP accumulated after each new lift loading due to the extremely low permeability and limitation of construction time. The results showed that the distance between the long edge of the loading area and pile D slightly affected the EPWP generation and dissipation.
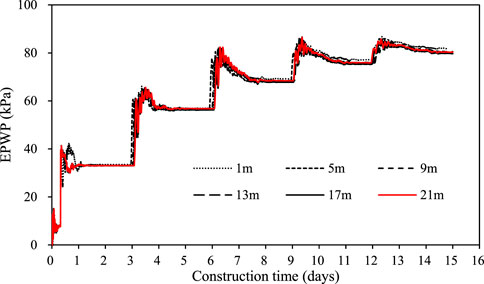
FIGURE 9. Variation in EPWP with construction time for different D values.
Figure 10 shows the variation in lateral earth pressure with depth at different D values after the fifth loading. Lateral earth pressures at 2–15 m depth increased with increasing D values except for the D value at 1 m. At depths of 15–25 m, the pressures decreased slightly with increasing D values. The lateral earth pressure was almost unchanged at different D values for other depths. Due to the existing pile, the lateral earth pressure changed irregularly when the loading area was close to the pile; i.e., a D value of 1 m. The lateral earth pressure for all D values was negative at a depth of approximately 9 m depth to the suction effect. Therefore, the D value significantly affected the lateral earth pressure on the pile.
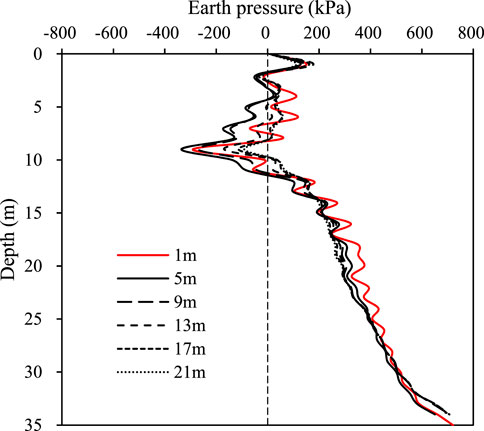
FIGURE 10. Distribution of earth pressure with depth for different D values after the fifth loading.
Effect of embankment height
Figure 11 shows the lateral displacement of the pile according to depth and embankment height. Each load (maintained for 3 days) equaled an embankment height of 0.8 m on the loading area until the total height reached the desired embankment height. The embankment height significantly affected the lateral displacement of the pile, especially at ground level. The maximum lateral displacement values for embankment heights of 0.8, 1.6, 2.4, 3.2, 4.0, and 4.8 m were 25.82, 72.47, 136.96, 194.27, 236.11, and 278.72 mm, respectively. The maximum lateral displacement was at the top of the pile. The lateral displacement and its increment increased and decreased with the increasing embankment height, respectively. The lateral displacement decreased with increasing depth, with the fastest reduction at depths of >10 m depth.
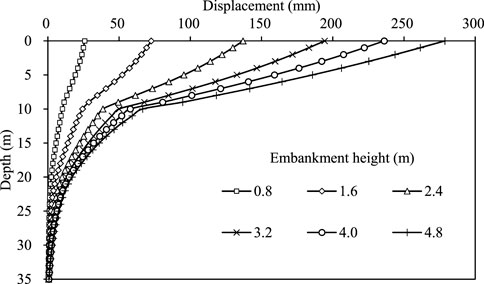
FIGURE 11. Lateral displacement of the pile shaft for different embankment heights.
Figure 12 shows the variation in the final vertical displacement of the foundation soil at ground level in the loading area for different embankment heights. As shown in Figure 12A, the settlement (i.e., positive value) and uplift (i.e., negative value) in the A-A section increased with increasing embankment height. For example, the maximum settlement value in the A-A section increased from 18.17 to 123.98 mm as the embankment height increased from 0.8 to 4.8 m, and from 11.30 to 89.13 mm as the embankment height increased from 0.8 to 4.8 m. As shown in Figure 12B, all displacement values in the B-B section were positive (i.e., settlement). The settlement increased with increasing embankment height. The maximum settlement value in the B-B section increased from 68.73 to 673.72 mm as the embankment height increased from 0.8 to 4.8 m. Therefore, the vertical displacement in the loading area was sensitive to the embankment height.
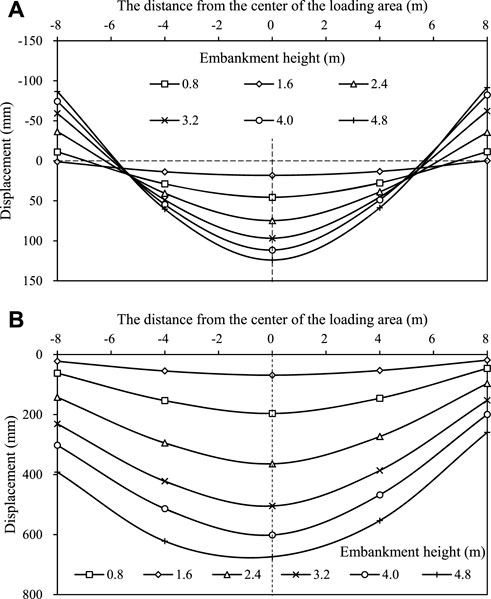
FIGURE 12. Foundation soil final vertical displacement in the embankment’s bottom surface under different embankment heights at the (A) A-A and (B) B-B sections.
Figure 13 shows the variation in EPWP with construction time for different embankment heights. The EPWP increased increasing embankment height. The EPWP values after the construction of embankment heights of 0.8, 1.6, 2.4, 3.2, 4.0, and 4.8 m were 33.78, 58.03, 72.18, 81.29, 87.71, and 91.30 kPa, respectively. Due to the position closing the water table and low permeability, the EPWP dissipated. Therefore, the EPWP depended on the embankment height.

FIGURE 13. Variation in EPWP with construction time for different embankment heights.
Figure 14 shows the variation in lateral earth pressure with depth at different embankment heights at the end of loading. The lateral earth pressures at depths of 2–15 m increased with increasing embankment height, while depths <15 m changed slightly with changing embankment height. The biggest change was at a depth of 9 m due to stress concentration. The lateral earth pressure values for all embankment heights were negative values at a depth of approximately 9 m due to the suction effect. Therefore, the embankment height significantly impacted the lateral earth pressure on the pile.
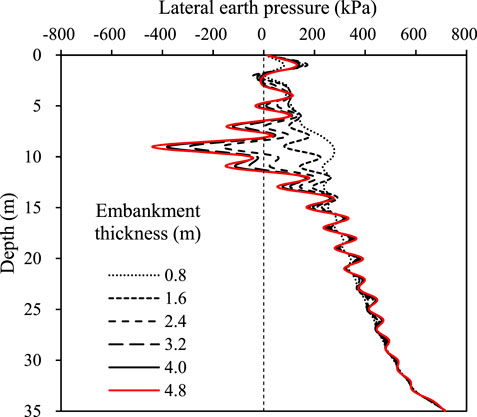
FIGURE 14. Distribution of earth pressure with depth at different embankment heights at the end of loading.
Effect of cushion thickness
In the real field test, a 1 m thick gravel cushion was placed on the ground surface as the first layer. This section discusses the effect of the replacement method on improving the foundation; i.e., the influence of the thickness of the soil replacement cushion. Figure 15 shows the lateral displacement of the pile shaft for different cushion thicknesses. The lateral displacement of the pile increased with increasing cushion thickness. The lateral displacements at the top of the pile for cushion thicknesses of 0, 0.5, 1.0, 1.5, and 2.0 m were 255.40, 241.21, 236.11, 154.48, and 133.80 mm, respectively. The lateral displacement of the pile decreased significantly with increasing cushion thickness from 1 to 1.5 m. The lateral displacement showed a relatively large decrease with increasing cushion thickness from 1.5 m to 2.0 m. However, the lateral displacement reduction was slight for increasing cushion thickness from 0 to 1 m. These findings demonstrated an effective cushion thickness of 1.5 m based on the measurements of lateral displacement.
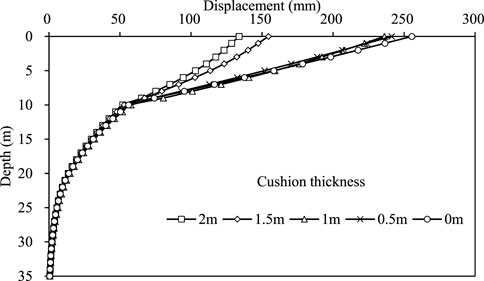
FIGURE 15. Lateral displacement of the pile shaft for different cushion thicknesses at the end of loading.
Figure 16 shows the variation in the final vertical displacement of the foundation soil at the ground surface in the loading area for different embankment heights. As shown in Figure 16A, the settlement and uplift values increased with increased cushion thickness from 0 to 1 m and decreased with an increased cushion thickness from 1 to 2 m. As shown in Figure 16B), the settlement value decreased with increased cushion thickness from 1 to 2 m and was stable with increased cushion thickness from 0 to 1 m. The vertical displacement was negative in section B-B at a cushion thickness of 2 m. Thus, cushion thickness improved the vertical displacement of the loading area.
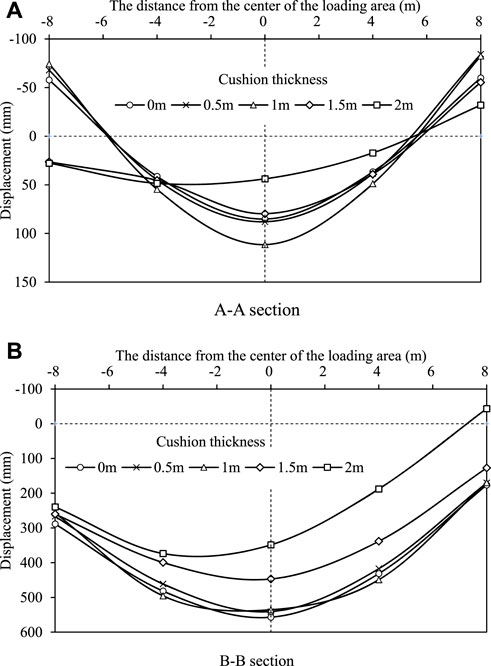
FIGURE 16. Foundation soil final vertical displacement in the embankment’s bottom surface under different embankment heights at the (A) A-A and (B) B-B sections.
Figure 17 shows the variation in EPWP with construction time for different cushion thicknesses. All EPWP increased significantly after each lift loading and dissipated due to low permeability and the limitation of construction time. The increase in cushion thickness from 1 to 2 m resulted in decreased EPWPs; moreover, a decrease in cushion thickness from 1 to 0 m also decreased the EPWP. However, the change in EPWP was slight when the cushion thickness decreased from 0.5 to 0 m, which can be attributed to a change in drainage capacity with increasing cushion thickness. The thin cushion did not carry the load at a shallow depth (i.e., 2 m from the ground surface).
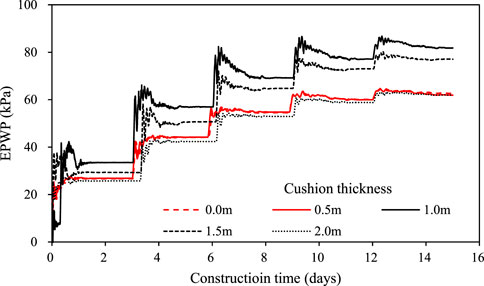
FIGURE 17. Variation in EPWP with construction time for different cushion thicknesses.
Figure 18 shows the variation in lateral earth pressure with depth for different cushion thicknesses at the end of loading. The lateral earth pressure at a depth of 6–12 m decreased with increasing cushion thickness, while its value at <12 m depth slightly changed changes in cushion thickness. However, a slight decrease in lateral earth pressure at a depth of 6–12 m depth was observed when the cushion thickness decreased from 1 to 0 m. The biggest change was observed at a depth of 9 m due to the stress concentration. The lateral earth pressure values for all cushion thicknesses were negative at depths of approximately 9 m depth due to the suction effect. Therefore, the cushion thickness slightly affected the lateral earth pressure on the pile at cushion thicknesses <1 m.
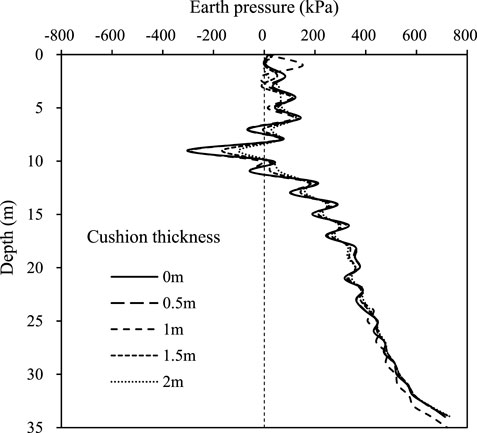
FIGURE 18. Distribution of earth pressure with depth for different cushion thicknesses at the end of loading.
Conclusion
This study investigated four essential factors (pile bending stiffness, distance between the long edge of the loading area and pile D, embankment height, and cushion thickness) in a series of three-dimensional finite element method (FEM) models to assess their effects on the characteristic of a single pile installed in extensively soft soil and subjected to passive loading due to the adjacent surcharge load. Based on the results obtained from the numerical models, the following conclusions can be drawn:
1) Compared to the real field test modeled in FDM, decreased and increased bending stiffness significantly reduced and slightly increased the pile’s maximum lateral displacement, respectively. The effect of cushion thickness on lateral displacement was contrary to the bending stiffness. Increased D value and decreased embankment height remarkably decreased the pile’s lateral displacement.
2) Variation in pile bending stiffness did not affect the vertical displacement at the ground surface in the loading area. Increased D values made the distribution shape of the vertical displacement closer to symmetrical. The embankment height and cushion thickness significantly affected the vertical displacement.
3) Due to the low permeability of the foundation soil and the limitation of the construction time, variation in pile bending stiffness and D value hardly affected EPWP dissipation and generation. Increased embankment height increased the EPWP.
4) Pile bending stiffness significantly affected the lateral earth pressure, with increasing stiffness decreasing the pressure. Decreased D values up to 1 m increased the lateral earth pressure. The embankment height significantly affected the lateral earth pressure. A cushion thickness of <1 m did not affect the lateral earth pressure.
Data availability statement
The raw data supporting the conclusion of this article will be made available by the author without undue reservation.
Author contributions
SY was the first author and was responsible for the analysis and writing.
Funding
This research was funded by the National Natural Science Foundation of China (grant no. 51908150). The above support was appreciated.
Conflict of Interest
SY was employed by Guangzhou Metro Design & Research Institute Co., Ltd.
The author declare that the research was conducted in the absence of any commercial or financial relationships that could be construed as a potential conflict of interest.
Publisher’s note
All claims expressed in this article are solely those of the authors and do not necessarily represent those of their affiliated organizations, or those of the publisher, the editors, and the reviewers. Any product that may be evaluated in this article, or claim that may be made by its manufacturer, is not guaranteed or endorsed by the publisher.
References
Abo-Youssef, A., Morsy, M. S., ElAshaal, A., and ElMossallamy, Y. M. (2021). Numerical modelling of passive loaded pile group in multilayered soil. Innov. Infrastruct. Solut. 1 (6), 101–113. doi:10.1007/s41062-021-00464-6
Al-abboodi, I., Sabbagh, T. T., and Al-salih, O. (2020). Response of passively loaded pile groups-an experimental study. Geomechanics Eng. 333 (20), 333–343.
Al-abboodi, I., and Sabbagh, T. T. (2019). Numerical modelling of passively loaded pile groups. Geotech. Geol. Eng. (Dordr). 2747 (37), 2747–2761. doi:10.1007/s10706-018-00791-z
Bai, B., Fan, B., Li, X., Nie, Q., Jia, X., and Wu, H. (2022a). The remediation efficiency of heavy metal pollutants in water by industrial red mud particle waste. Environ. Technol. Innovation 28, 102944. doi:10.1016/j.eti.2022.102944
Bai, B., Wang, Y., Rao, D., and Fan, B. (2022b). The effective thermal conductivity of unsaturated porous media deduced by pore-scale SPH simulation. Front. Earth Sci. (Lausanne) 10. doi:10.3389/feart.2022.943853
Bai, B., Zhou, R., Cai, G., Hu, W., and Yang, G. (2021). Coupled thermo-hydro-mechanical mechanism in view of the soil particle rearrangement of granular thermodynamics. Comput. Geotech. 137 (8), 104272. doi:10.1016/j.compgeo.2021.104272
Basack, S., Indraratna, B., and Rujikiatkamjorn, C. (2016). Modeling the performance of stone column–reinforced soft ground under static and cyclic loads. J. Geotech. Geoenviron. Eng. 142, 04015067. doi:10.1061/(asce)gt.1943-5606.0001378
Bellezza, I. (2020). Closed-form expressions for a rigid passive pile in a two-layered soil. Géotechnique Lett. 242 (10), 242–249. doi:10.1680/jgele.19.00250
Cole, R. T. (2003). Full-scale effects of passive earth pressure on the lateral resistance of pile caps. USA: Brigham Young University.
Deb, K., Dhar, A., and Purohit, S. (2016). “A simulation-optimization model for Stone column-supported embankment stability considering rainfall effect,” in AIP Conference Proceedings, 01 February 2016.
Fattah, M. Y., Zabar, B. S., and Hassan, H. A. (2016). Experimental analysis of embankment on ordinary and encased stone columns. Int. J. Geomech. 16, 04015102. doi:10.1061/(asce)gm.1943-5622.0000579
Gu, M., Cai, X., Fu, Q., Li, H., Wang, X., and Mao, B. (2022a). Numerical analysis of passive piles under surcharge load in extensively deep soft soil. Buildings 12, 1988. doi:10.3390/buildings12111988
Gu, M., Mo, H., Qiu, J., Yuan, J., and Xia, Q. (2022b). Behavior of floating stone columns reinforced with geogrid encasement in model tests. Front. Mat. 9, 980851. doi:10.3389/fmats.2022.980851
Guo, W. (2003). “A simplified approach for piles due to soil movement,” in Proceedings of the 12th Panamerican Conference on Soil Mechanics and Geotechnical Engineering, Germany, 2003.
Guo, W. D., Qin, H., and Ghee, E. (2017). Modeling single piles subjected to evolving soil movement. Int. J. Geomech. 17, 04016111. doi:10.1061/(asce)gm.1943-5622.0000803
Kadhim, S., Parsons, R. L., and Han, J. (2015). Stability analysis of embankments supported by geosynthetic encased stone columns. IFCEE 2318, 2318–2327.
Kalantari, B., and Tavan, Y. (2019). 2d fem analysis of stone column-supported embankment and studying the effects of various parameters on its stability using cam-clay model. Comput. Geotechnics 68, GT4. doi:10.1016/j.compgeo.2015.03.014
Karim, M., Lo, S.-C., and Gnanendran, C. (2014). Behaviour of piles subjected to passive loading due to embankment construction. Can. Geotech. J. 303 (51), 303–310. doi:10.1139/cgj-2012-0468
Karim, M. R. (2013). Behaviour of piles subjected to passive subsoil movement due to embankment construction–A simplified 3D analysis. Comput. Geotechnics 1 (53), 1–8. doi:10.1016/j.compgeo.2013.04.004
Karkush, M., Aljorany, A., and Jaffar, G. (2020). Behavior of passive single pipe pile in sandy soil. IOP Conf. Ser. Mater. Sci. Eng. 737, 012106. doi:10.1088/1757-899X/737/1/012106
Karkush, M. O., and Jaffar, G. S. (2020). Simulation the behavior of passive rigid pile in sandy soil. J. Eng. Technol. Sci. 449 (52), 449–467. doi:10.5614/j.eng.technol.sci.2020.52.4.1
Li, H.-q., Wei, L.-m., Feng, S.-y., and Chen, Z. (2019). Behavior of piles subjected to surcharge loading in deep soft soils: Field tests. Geotech. Geol. Eng. (Dordr). 4019 (37), 4019–4029. doi:10.1007/s10706-019-00890-5
Li, H., Liu, S., Yan, X., Gu, W., and Tong, L. (2021). Effect of loading sequence on lateral soil-pile interaction due to excavation. Comput. Geotechnics 104134 (134), 104134. doi:10.1016/j.compgeo.2021.104134
Malarvizhi, S., and Ilamparuthi, K. (2007). Comparative study on the behavior of encased stone column and conventional stone column. Soils Found. 873 (47), 873–885. doi:10.3208/sandf.47.873
Ong, D. (2018). Detrimental effects of lateral soil movements on pile behaviour. Geotech. Eng. 85 (49), 85–95.
Qin, H., and Guo, W. D. (2016). Response of piles subjected to progressive soil movement. Geotechnical Test. J. 39, 1. doi:10.1520/GTJ20140148
Ramalakshmi, M. (2021). Force-displacement response of bridge abutments under passive push. Mater. Today Proc. 883 (43), 883–887. doi:10.1016/j.matpr.2020.07.202
Sabbagh, T. T., Al-Salih, O., and Al-Abboodi, I. (2019). Experimental investigation of batter pile groups behaviour subjected to lateral soil movement in sand. Int. J. Geotechnical Eng. 14, 705–716. doi:10.1080/19386362.2019.1585596
Şahinkaya, F., Vekli, M., and Çadır, C. C. (2017). Numerical analysis under seismic loads of soils improvement with floating stone columns. Nat. Hazards (Dordr). 891 (88), 891–917. doi:10.1007/s11069-017-2897-0
Shan, Y., Zhao, J., Tong, H., Yuan, J., Lei, D., and Li, Y. (2022). Effects of activated carbon on liquefaction resistance of calcareous sand treated with microbially induced calcium carbonate precipitation. SOIL Dyn. Earthq. Eng. 161, 107419. doi:10.1016/j.soildyn.2022.107419
Yang, M., Shangguan, S., Li, W., and Zhu, B. (2017). Numerical study of consolidation effect on the response of passive piles adjacent to surcharge load. Int. J. Geomech. 17, 04017093. doi:10.1061/(asce)gm.1943-5622.0000991
Yi, S., and Liu, J. (2022). Field investigation of steel pipe pile under lateral loading in extensively soft soil. Front. Mat. 9, 480. doi:10.3389/fmats.2022.971485
Yuan, J., Lei, D., Shan, Y., Tong, H., Fang, X., and Zhao, J. (2022). Direct shear creep characteristics of sand treated with microbial induced calcite precipitation. Int. J. Civ. Eng. 20, 763–777. doi:10.1007/s40999-021-00696-8
Zhang, H., Shi, M., and Guo, Y. (2020a). Semianalytical solutions for abutment piles under combined active and passive loading. Int. J. Geomech. 20, 04020171. doi:10.1061/(asce)gm.1943-5622.0001804
Zhang, H., Shi, M., Yang, L., and Guo, Y. (2020b). A semianalytical solution for passively loaded piles adjacent to surcharge load. Adv. Civ. Eng. 1 (2020), 1–19. doi:10.1155/2020/2398389
Keywords: passive pile, surcharge load, bending stiffness, embankment height, cushion thickness
Citation: Yi S (2022) Parametric study of passive piles subjected to adjacent surcharge load in extensively deep soft soil. Front. Mater. 9:1080547. doi: 10.3389/fmats.2022.1080547
Received: 26 October 2022; Accepted: 15 November 2022;
Published: 01 December 2022.
Edited by:
Xianze Cui, China Three Gorges University, ChinaCopyright © 2022 Yi. This is an open-access article distributed under the terms of the Creative Commons Attribution License (CC BY). The use, distribution or reproduction in other forums is permitted, provided the original author(s) and the copyright owner(s) are credited and that the original publication in this journal is cited, in accordance with accepted academic practice. No use, distribution or reproduction is permitted which does not comply with these terms.
*Correspondence: Shixuan Yi, eWlzaGl4dWFuQGR0c2p5LmNvbQ==