 Wei Tan1
 Songxiang Zhu
 Lingyun Kong
95% of researchers rate our articles as excellent or good
Learn more about the work of our research integrity team to safeguard the quality of each article we publish.
Find out more
ORIGINAL RESEARCH article
Front. Mater. , 24 November 2022
Sec. Structural Materials
Volume 9 - 2022 | https://doi.org/10.3389/fmats.2022.1079431
This article is part of the Research Topic Recent Advances in Testing and Modeling of Performance-related Mechanical Properties of Asphalt Mixtures View all 6 articles
Efficient demulsification is vital for the application of emulsified asphalt in road construction. In this paper, the effects of the main chemical components of the aggregates (CaCO3, MgO, Fe2O3, SiO2, Al2O3) on the demulsification process of emulsified asphalt were studied by experiment and simulation using a Gompertz model. The findings indicate that the surface energy, specific surface area, and pH of the chemical components of the aggregates are the most important factors influencing the demulsification speed of the emulsified asphalt. The choice of the aggregate’s main chemical components can accelerate demulsification speed, with the acceleration effect of Al2O3 on anionic (SDBS) emulsified asphalt and MgO on cationic (STAC) emulsified asphalt both reaching 60%. The fit between the Gompertz model and the experimental viscosity curve is greater than 0.93, which verifies the utility of using the Gompertz approach for studying emulsified asphalt-aggregate mortar viscosity changes. A demulsification evaluation function
The use of asphalt in road construction has significant environmental impacts (Ma et al., 2016). To address this issue, emulsified asphalt cold recycling technology was developed. This has several advantages, including gradation control, cost savings on road materials, environmental protection, and low cost. Cold recycling of asphalt mixture has been demonstrated in practice to be applicable to the middle and lower layers or base of high-grade highways and the surfaces of middle and low-traffic volume roads (Wang 2021). However, the low demulsification speed of emulsified asphalt, particularly early in the process, restricts the use of emulsified asphalt mixtures (Baoju et al., 2022). The demulsification process of emulsified asphalt is determined by a range of factors, such as aggregate properties (Xu et al., 2017; Wang et al., 2021), the types and dosage of emulsified asphalt (Jin et al., 2013; Li and Wang 2014; Xiao et al., 2019; Li et al., 2021), temperature (Baoju et al., 2022), additives (Jiang et al., 2021), pH (Fajun et al., 2020), oil-water interface tension (Tao et al., 2015), and various combinations of materials and construction characteristics (Baoju et al., 2022). The aggregate typically accounts for more than 90% of the weight of the asphalt mixture (Pan et al., 2017). Therefore, aggregate is an important component of asphalt road coverings, and the chemical composition of aggregate significantly impacts the demulsification speed of emulsified asphalt.
The physical and chemical properties of aggregates significantly influence the interface interaction between aggregates and binders, and this governs attempts to create strong, durable, and cost-effective asphalt mixtures (Busang and Maina 2022). Low adhesion between emulsified asphalt mortar and aggregate can result in poor characteristics of the emulsified asphalt mixture (Zhang et al., 2020) (Wang et al., 2020), By observing the surface energy and shear strength of the interface, the surface morphology of the coarse aggregate positively correlates with the adhesion of the cement emulsified asphalt mixture. It has an indirect impact on the water stability of the mixture. Using the principle of equivalent surface area (Li et al., 2020), discovered that aggregate gradation significantly impacts demulsification speed. However, once the volume ratio reaches 1, and the proportion of gradation less than 0.075 mm reaches 25%–30%, the demulsification speed changes little (Xu and Luo 2022). Investigated the rheological properties of emulsified asphalt and mineral powder. The
As a growth curve function, the Gompertz model can accurately predict the occurrence, development, maturation, and growth limits, and the fit with measured values is better than other traditional models (Satoh and Matsumura 2019). (Raposeiras et al., 2016) used the Gompertz model to predict macroscopic changes in texture in asphalt pavement layers (Jiu-peng et al., 2015). Analyzed the variation law of the viscosity of emulsified asphalt mortar with time through the Gompertz model and predicted the time required for the demulsification of the modified asphalt emulsion to completely demulsify. These studies have shown that the Gompertz model can be used to predict the performance of asphalt mixtures.
Emulsified asphalt mortars are non-Newtonian fluids that shear thin at low shear rates. The viscosity of the cement decreases as shear time increases and increases as shear time decreases. As a result, the viscosity of emulsified asphalt mortar changes in three stages: thixotropic, equilibrium, and demulsification. There have been few studies that use the Gompas model to predict the demulsification stage. As a result, by investigating the growth law of the viscosity of the dope during the demulsification stage, this paper establishes the Gompas model of viscosity change with time. The Gompers model evaluates the demulsification speed of emulsified asphalt mortar scientifically and objectively.
In this paper, we have studied the effect of the properties of the aggregate chemical composition on the demulsification speed through measurements of the specific surface area, surface energy, and pH. The grey relational analysis (GRA) was used to identify the main influencing factors. Viscosity and conductivity tests on emulsified asphalt mortar were carried out to help establish a Gompertz viscosity growth model. The mechanism determining the influence of aggregate chemical composition on the speed of emulsified asphalt mortar demulsification was investigated, and an emulsified asphalt demulsification evaluation function was established as a basis for calculating demulsification time. The findings provide a theoretical foundation for improving the quality and performance of emulsified asphalt on roads.
The main objective of this study was to provide theoretical insight into the influence of aggregate composition on the demulsification of emulsified asphalt. The research framework is given below, and Figure 1 shows the process flow.
1) CaCO3, MgO, Fe2O3, SiO2, and Al2O3 were used as test materials in the aggregate-specific surface area, surface energy, pH, and mixing ratio tests.
2) The effect of the properties of the chosen aggregate materials on the demulsification process was investigated by experiment, including measurements of the specific surface area, surface energy, pH, and mixing ratio of the aggregate. Grey relational analysis was used to identify the principal influencing factors.
3) Viscosity and conductivity tests were used to investigate the effect of aggregate chemical composition on the demulsification process.
4) A Gompertz model was established based on the results of the viscosity experiments, and the fit between the experimental results and the Gompertz model was determined to validate the model.
5) A demulsification evaluation function
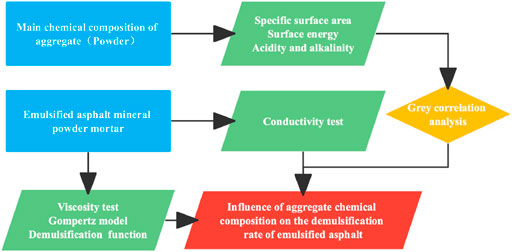
FIGURE 1. Study process flow flowchart.
An examination of aggregates commonly found in asphalt pavement. The aggregate is ground into mineral powder, which is then sieved, and the mineral powder with a particle size of 300 mesh (0.053∼0.075 mm) is taken for testing. S1-Dry River Bottom Limestone, S2-Small River Side Limestone, S3-Digging Limestone, S4-Fifteen Standard Limestone, and X-Basalt from Nanjing, Jiangsu are the limestones used for the aggregates. The XRF method was used to determine the chemical composition of mineral powder (X-ray fluorescence analysis). Thermo Fisher Scientific (China) Co., LTD., the provided XRF equipment. Figure 2 depicts the aggregates’ chemical composition content test results. According to research, the aggregate content of the five chemical components, MgO, Al2O3, CaO, Fe2O3, and SiO2, is greater than 95%.
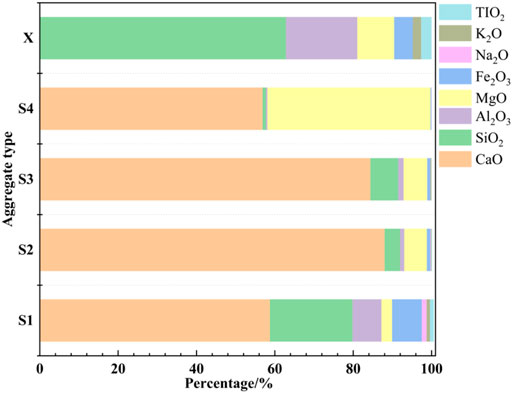
FIGURE 2. Main chemical composition of aggregate.
Therefore, limestone and basalt are commonly used aggregates in asphalt mixtures, and the main chemical components are CaO, MgO, Fe2O3, SiO2, and Al2O3 (Cala et al., 2019). However, when CaO encounters water, a strong chemical reaction occurs, generating CaCO3, so in this study, we use CaCO3 in place of CaO for experiments. Thus, our study uses CaCO3, MgO, Fe2O3, SiO2, and Al2O3 to represent the main chemical components of aggregates. It is reasonable to select a combination of these five common chemical components to approximate the chemical composition of the aggregate. These five aggregate powders (Figure 3) were purchased from the Aladdin Chemical Reagents Company e-commerce platform. The properties of the as-purchased powders are shown in Table 1.
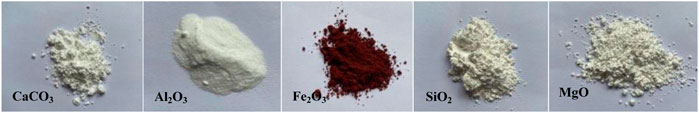
FIGURE 3. The five materials selected to represent the main chemical components of aggregate.
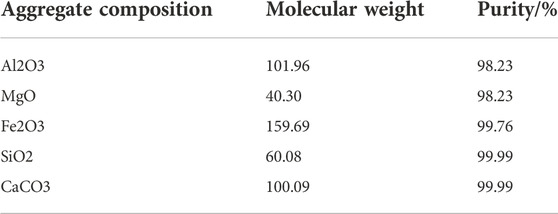
TABLE 1. Properties of the as-purchased aggregate material powders.
Brunauer-Emmett-Teller (BET) specific surface area analysis tests were used to determine the specific surface area index of the five oxide components of the aggregate following China National Standard GB/T19587–2004. A V-Sorb 2800P specific surface area and pore size analyzer was used for the tests. The samples were analyzed under nitrogen in a positive displacement working device (adsorption-desorption isotherm at 77 K). Before analysis, the samples were dried at 80°C for 36 h.
The contact angle method was used to determine the surface energy of the aggregate chemicals. The contact angle (Figure 4) is the angle through the liquid interior where the liquid-gas interface meets the solid surface (Singh and Singh 2022; Xiao et al., 2022), and can be regarded as a representative measure of the surface energy of powdered solids (Çıtak and Yarbaş 2022; Bangera and Appaiah 2019). Because of the voids in the pipette containing the oxide powder, when capillary action occurs, the liquid can spontaneously penetrate the voids, and the penetration time (t) and penetration height (h) are related to the difference between the oxide powder and the liquid, which is related to the contact angle. The contact angle can be calculated from t and h using the Washburn equation (Washburn 1921).
where h is the penetration height (cm), t is the penetration time (s), C1 is the surface energy of the liquid (mJ·m−2), r is the effective radius of the capillary (μm), θ is the contact angle (°), andη is the viscosity of the liquid (mN·m−2·s−1). The effective radius of the capillary is calculated using a low surface energy solid (i.e., when
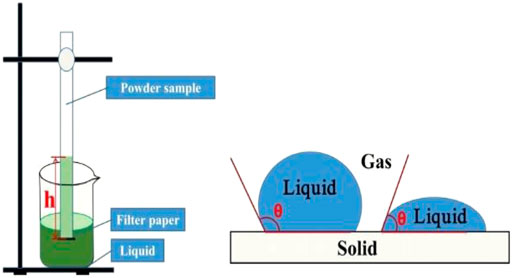
FIGURE 4. Determining the contact angle.
Because the Washburn equation characterizes the surface energy of liquids, the surface energy of a solid must first be calculated using adhesion work theory. The following is calculation method:
where Cl is the surface free energy of the liquid (mJ·m−2), θ is the contact angle between the liquid and solid (°), and l = liquid, and s = solid,
Table 2 shows the calculated surface energy parameters for the aggregate materials in the four test liquids (distilled water, toluene, formamide, and ethanol). Figure 4 depicts the experimental setup.
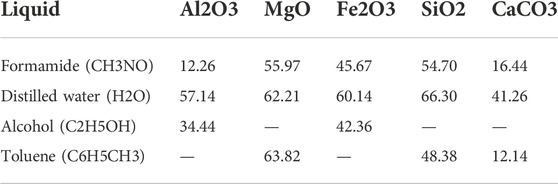
TABLE 2. Calculated aggregate powder contact angles
A pH test instrument was used to determine the pH of the aggregate powder solutions. The solution concentration was 2%. All solutions were prepared by mixing the aggregate powder with distilled water, heating it to above 100°C for 40 min before letting it cool for 24 h, and measuring the pH.
This study focuses on cationic and anionic emulsified asphalts in which the matrix asphalt is SK-70# designed to comply with the relevant standard conditions in the Technical Standards for the Construction of Asphalt Pavements on Highways (JTGF40–2004). Tests showed that the basic characteristics of the asphalt materials (Table 3) meet the specification requirements. The Aladdin Reagent Company supplied the emulsifiers (Figure 5): Stearyl Trimethyl ammonium chloride (STAC, cationic) and Sodium dodecyl benzene sulfonate (SDBS, anionic). Table 4 lists their properties. The additives, anhydrous CaCl2, and polyvinyl alcohol were also procured from Aladdin Reagent Company.
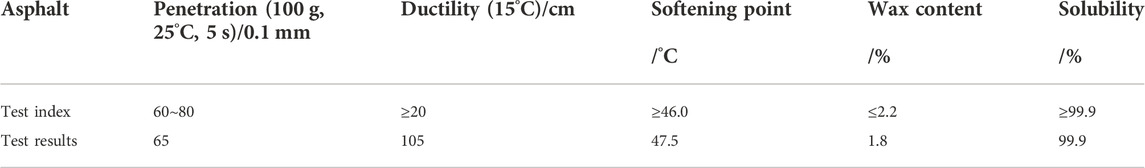
TABLE 3. Properties of the asphalt mixtures.
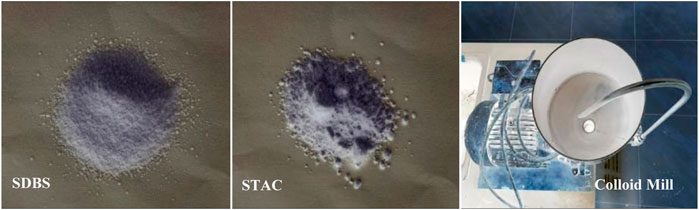
FIGURE 5. The SDBS and STAC emulsifiers and the Herbert Rink colloid mill.
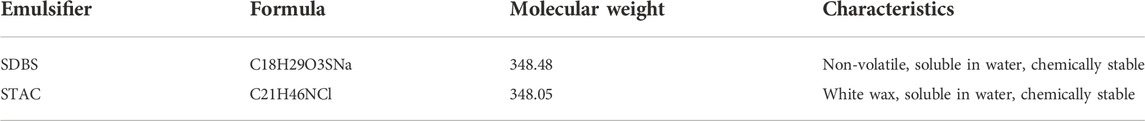
TABLE 4. SDBS and STAC emulsifiers.
The emulsified asphalts were prepared using a Herbert Rink colloid mill (Figure 5). A total of ten groups of emulsified asphalt solutions were prepared according to different emulsifier admixtures (STAC: 3%; SDBC: 3%) with an oil-to-water ratio of 5:5. The preparation conditions are given in Table 5, As stated above, tests showed that the performance of the mixtures met the relevant specifications. Taking the preparation of the SDBS emulsified asphalts as an example, the flow chart is shown in Figure 6. The preparation process and procedures are as follows:
1) The SK-70# base asphalt is heated to around 140°C in the oven and then set aside.
2) To make a soap solution, dodecyl anion emulsifier and anhydrous calcium chloride auxiliary (0.1%) were mixed in a given proportion in water at about 60°C, and sodium hydroxide was used to adjust the pH to 11.
3) The soap solution was sheared in a prepared colloid mill for 3 min. Then the weighed SK-70# base asphalt was slowly added to the mill. After 8 min of shearing in the mill, the emulsified asphalt was cooled and then bottled and stored (Figure 7).
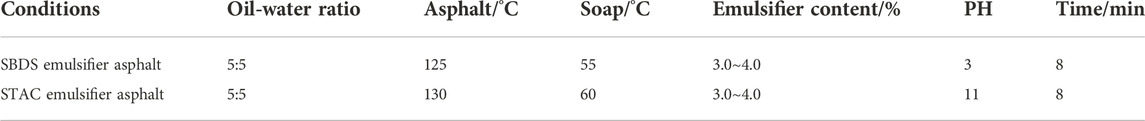
TABLE 5. Preparation conditions for the SDBS and STAC emulsified asphalts.
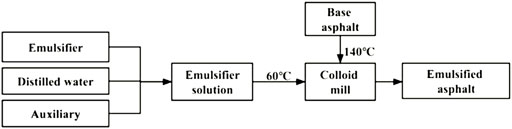
FIGURE 6. Production process flow of the emulsified asphalt.
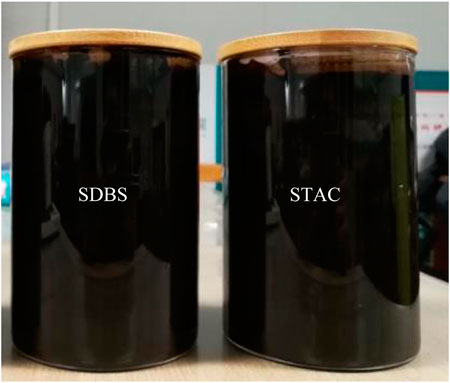
FIGURE 7. SDBS and STAC emulsified asphalts.
Section 3.2 emulsified asphalt samples of STAC and SDBS are mixed with one of the aggregate powders (Al2O3, SiO2, MgO, Fe2O3, or CaCO3). If the percentage of oxide mass in the mortar mass exceeds 50%—i.e., the mixing ratio is too high, and the emulsified asphalt mortar prematurely demulsifies (Figure 8). The emulsified asphalt mortar will separate and bleed if the mixing ratio is too low. As a result, we conducted several experiments to adjust the mixing ratio several times to ensure the emulsified asphalt mortar’s fluidity and uniformity. Figure 9 depicts the final mixing ratio of each emulsified asphalt mortar.
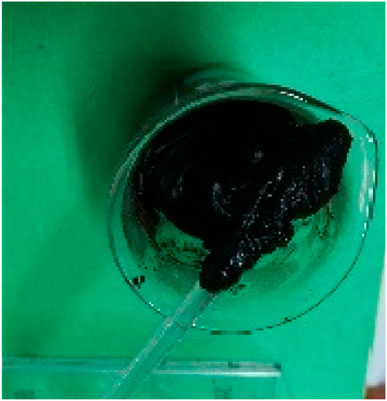
FIGURE 8. Premature demulsification of the emulsified asphalt mortar results.
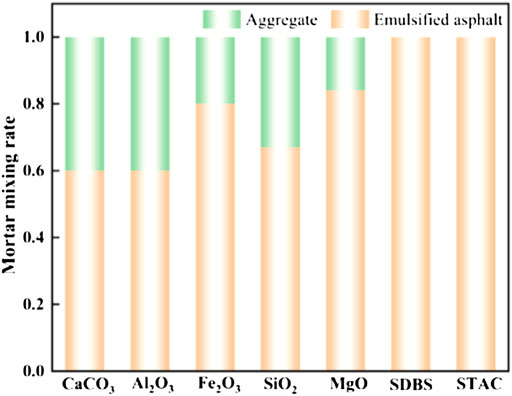
FIGURE 9. Emulsified asphalt-aggregate mortar ratio.
The effects of the Al2O3, CaCO3, Fe2O3, MgO, and SiO2 content on the demulsification process of emulsified asphalt were studied via a viscosity test. When the oxide and emulsified asphalt are mixed under the action of external conditions, the emulsified asphalt begins to demulsify; a thick asphalt film is formed on the surface of the oxide, and the viscosity increases with time. The demulsification process of emulsified asphalt-aggregate mortar can be divided into three stages: the thixotropic stage, the equilibrium stage, and the demulsification stage (James 2006). We are concerned primarily with the change in viscosity during the final demulsification stage. The viscosity test was carried out using a Brookfield rotational viscometer at a speed of 60 rpm and a range of 100 MPa·s.
Conductivity, the reciprocal of resistivity, is a physical quantity used to characterize the ability of a substance to conduct electricity. Its unit is S/cm. As the concentration of the solutions used in this study is small, the conductivity readings are in the µS/cm range.
As conductivity is affected by factors such as ion species and temperature (Hanxi et al., 2021), we calibrated our readings with respect to temperature and concentration. We defined the mass ratio of the mass of the emulsified asphalt solution to the chemical composition of the aggregate as the aggregate ratio, which we set to 20:1. Different emulsified asphalts containing Al2O3, SiO2, MgO, Fe2O3, or CaCO3 were tested. The experimental scheme was designed to provide the conductivity value of the solution at 25°C.
The DDSJ-308A conductivity meter was used for testing. Of emulsified asphalt, 50 ml was added to the centrifuge tube, followed by aggregate powder to produce an aggregate ratio of 20:1. The mixture was centrifuged at 3,000 r/min and room temperature for 4, 8, 12, 16, 20, 24, 28, 32, 36, 40, 44, 48, and 52 min with the supernatant extracted for conductivity measurements at each interval. Before each measurement, the conductivity meter was preheated for 5 min.
The Gompertz model is a growth curve that predicts change (Pelinovsky et al., 2022) and is a good predictor of emulsified asphalt mortars’ growth and development process. In this study, we employ the Gompertz model to investigate the viscosity growth law of emulsified asphalt during the demulsification stage to determine the demulsification speed of emulsified asphalt mortar.
The Gompertz model expression for emulsified asphalt-aggregate mortar is as follows:
where t denotes time, y denotes viscosity at time t, and K, a, and b denote model parameters. The three-segment method can be used to determine the solution for the three-parameter values (a, b, and K) in the Gompertz model. The sum of the three time periods is as follows:
From Eqs 6, 7, 8, k, a, and b can be obtained as:
Following the establishment of the emulsified asphalt mortar demulsification model, the undetermined coefficients a, b, and K in the Gompertz model are fitted using the measured viscosity values of the mortar of the chemical composition of the aggregate.
The chemical composition characteristics of aggregates include specific surface area, surface energy, and pH. Specific surface area refers to the total area possessed by a unit mass of substances and is inversely proportional to the particle size (Esping 2008). The specific surface area test (Figure 10A) shows that the specific surface area of MgO powder is much larger than that of other chemical components, indicating that its particle size is the smallest. Surface energy is defined as the reversible work in creating a unit area and can be used to quantify aggregate-asphalt adhesion (Huang et al., 2022). The surface energy test (Figure 10B) showed that the surface energy of the five powders followed the sequence Al2O3>CaCO3>Fe2O3>MgO>SiO2. The pH test shows that Al2O3, CaCO3, Fe2O3, and MgO are alkaline, while SiO2 is weakly acidic (Figure 10C).

FIGURE 10. Aggregate physical properties and grey relation analysis. (A) Specific surface area, (B) Surface energy, (C) pH test, (D) Gray relation analysis.
Figure 10D: D/B1: Demulsification rate and Specific surface area, D/B2: Demulsification rate and pH value, D/B3: Demulsification rate and Surface energy.
Grey relational analysis (GRA) provides a quantitative measure for the development and change of a system and is widely used in multi-objective optimization (Vigneshkumar and Sekar, 2021; Lee et al., 2019; Sundar Singh Sivam et al., 2021). The emulsified asphalt-aggregate system is a typical Grey system, with the system output being the demulsification rate of the emulsified asphalt mortar (Ju-Long 1982). The grey relational analysis holds all of the gray system’s inputs to the same standard and investigates the degree of correlation between the input and the output while largely avoiding the issue of coupling between the inputs. The results of the Grey correlation analysis show that the correlation between specific surface area, surface energy, pH, and the demulsification speed of emulsified asphalt is more than 50% (Figure 10D), with the surface energy of the aggregate, chemical components being the key factor affecting the rate of demulsification, followed by specific surface area and pH of these components. The GRA results confirm that the characteristics of aggregate, chemical components are important factors affecting the demulsification speed of emulsified asphalt mortar.
Figure 11 depicts the results of the viscosity test. Emulsified asphalt mortars with aggregate chemicals (Al2O3, CaCO3, Fe2O3, MgO, or SiO2) have a higher viscosity, which increases with time. The overall viscosity is significantly higher than that of comparable emulsified asphalts without aggregates. The Al2O3 system has the highest viscosity in the anionic (SDBS) emulsified asphalt-aggregate system, indicating that the acceleration effect of Al2O3 on the emulsified asphalt demulsification speed is more significant, and there is greater adhesion between the aggregate and asphalt. Al2O3 has the highest surface energy (Section 4.1; Figure 10B). This increases the adsorption speed of the emulsified asphalt on the surface of Al2O3, improves adhesion, speeds up demulsification, and causes a significant increase in viscosity. On the other hand, the viscosity of the MgO and SiO2 systems tends to be stable. While MgO has a large specific surface area and small particle size and can be uniformly dispersed into the liquid during stirring, it has a negatively-charged surface, and because anionic emulsified asphalt is also negatively charged, there is electrostatic repulsion between the two (Berg 2010), resulting in a slow increase in viscosity.
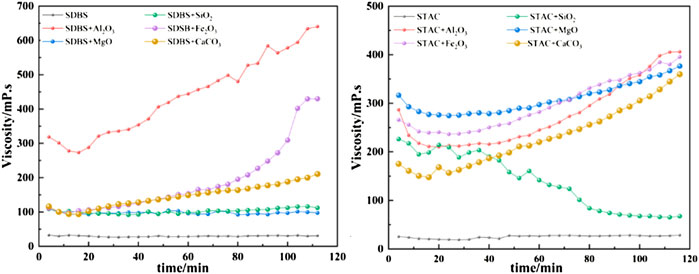
FIGURE 11. Viscosity growth curves for the anionic (SDBS) and cationic (STAC) emulsified asphalt mortars.
In the cationic (STAC) emulsified asphalt-aggregate system, the viscosity growth of the MgO system is at the maximum level within 0–78 min, and the acceleration effect of MgO is more obvious. Here, since cationic emulsified asphalt is positively charged, the strong electrostatic attraction between it and negatively charged MgO (Savel’ev and Yagodnikov 2022) makes the emulsified asphalt quickly adsorb to the surface of MgO, resulting in accelerated demulsification and enhanced adhesion. In addition, the specific surface area is small, and the particle size is small, so it can easily uniformly disperse into the liquid in a short time, resulting in the cationic emulsified asphalt being more easily adsorbed on its surface. After 78 min, the viscosity of the Al2O3 and Fe2O3 systems is higher than that of the MgO system. This is due to the higher surface energy of Al2O3 and Fe2O3 than MgO. Prolonged stirring allows the emulsified asphalt to fully adsorb on the surface of Al2O3 and Fe2O3, resulting in a faster increase in viscosity. The viscosity of the SiO2 system, on the other hand, decreases over time. This is due to the positively charged surface of SiO2, which has an electrostatic repulsive force with the positively charged cationic emulsified asphalt. As the stirring time increases, the more fully the SiO2 contacts the cationic emulsified asphalt, the greater the repulsive force, resulting in a decrease in viscosity.
The tests show that the anionic (SDBS) emulsified asphalt has greater adhesion to Al2O3, while the cationic (STAC) emulsified asphalt has good adhesion to Al2O3, CaCO3, Fe2O3, and MgO.
Figure 12 shows the average rate of viscosity increase of the emulsified asphalt-aggregate mortar calculated from the data shown in Figure 11. To varying degrees, the addition of aggregates accelerates the demulsification speed of emulsified asphalt mortar. In the anionic (SDBA) emulsified asphalt-aggregate system, the effect due to the addition of Al2O3 is Fe2O3 is particularly remarkable. In the case of the cationic (STAC) emulsified asphalt-aggregate system, Al2O3 and CaCO3 show noticeably higher rates than the other aggregates.
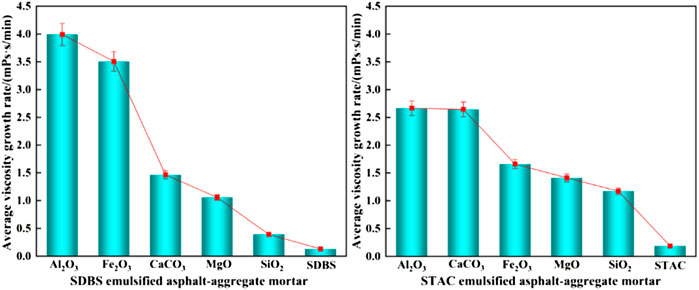
FIGURE 12. Average rate of viscosity increase.
Table 6 shows the Gompertz model parameters a, b, and K for the emulsified asphalt-aggregate system calculated according to the approach described in Section 3.4.
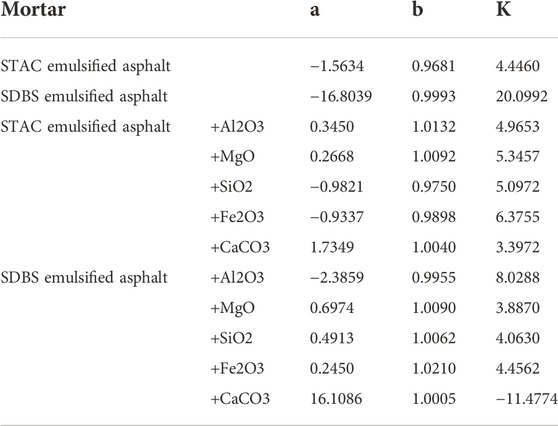
TABLE 6. Calculated values of the parameters of the Gompertz model for the different emulsified asphalt-aggregate systems.
The data in Table 6 were used to build Gompertz model curves for emulsified asphalt aggregate mortar systems (Figures 13, 14). A comparison between the Gompertz model curves and the experimental data showed a good fit with coefficients of determination (R2) of >0.92, demonstrating that the Gompertz equation is a good model for viscosity change and supporting the contention that it can provide a theoretical basis for a quantitative study of the time of demulsification, which is the next step.
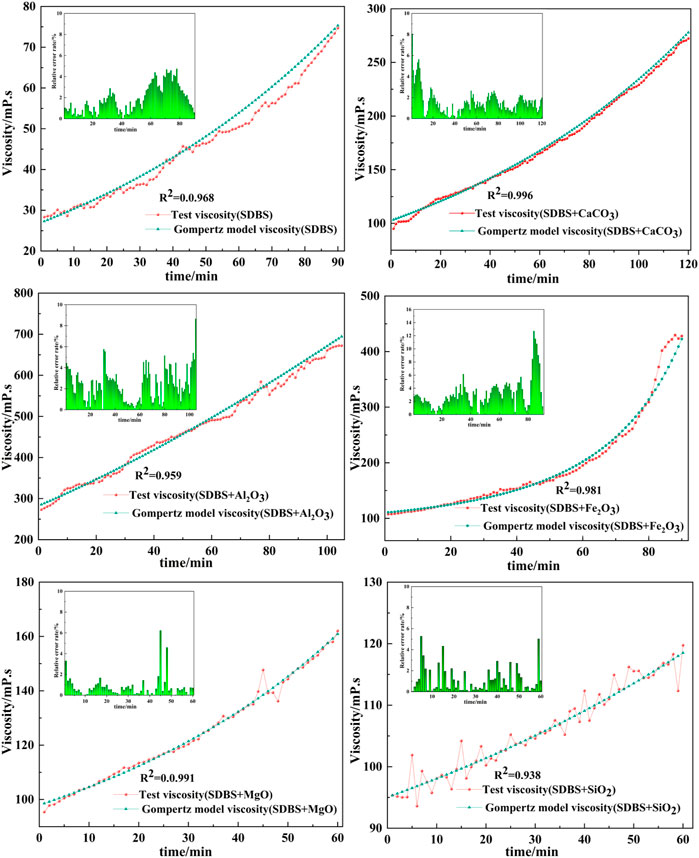
FIGURE 13. Fit of Gompertz model curves and experimental data for viscosity versus time for the SDBS emulsified asphalt mortars.
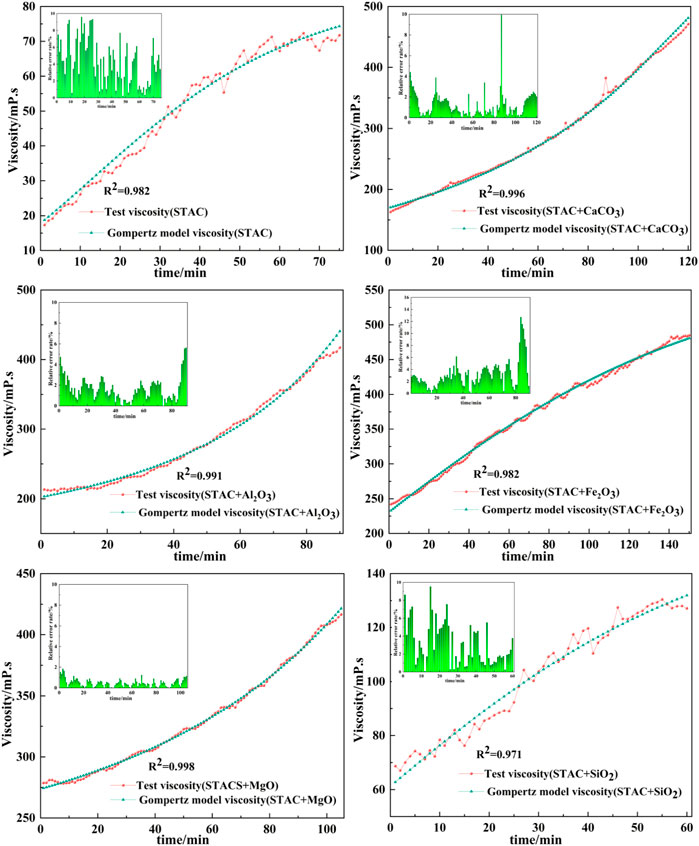
FIGURE 14. Fit of Gompertz model curves and experimental data for viscosity versus time for the STAC emulsified asphalt mortars.
In Section 4.3, in the process of fitting with the Gompertz model, the slope of the viscosity-time curve is always greater than 0, indicating that the viscosity of the emulsified asphalt-aggregate mortar is increasing, and the demulsification time is defined by the rate of change of the viscosity. To use these results to evaluate demulsification, we must first establish the relationship between the parameters of the Gompertz model and the demulsification time. To do so, we must first investigate the demulsification time. This was accomplished through conductivity tests, the results of which are shown in Figure 15, with the time to demulsify defined as the time when the conductivity reaches a stable value (Figure 16). According to the results of this test, Al2O3 has a significant acceleration effect on demulsification of the anionic (SDBS) emulsified asphalt system. According to the results of the viscosity tests, MgO has a significant effect on the acceleration of demulsification of the cationic (STAC) emulsified asphalt system.
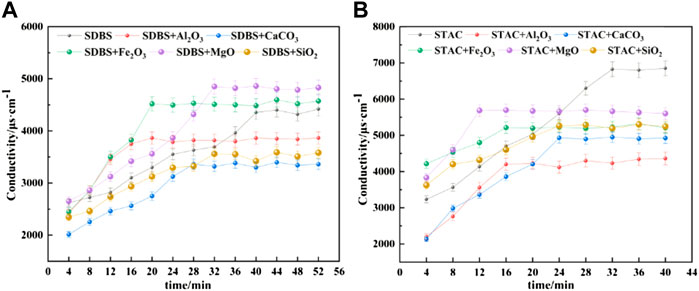
FIGURE 15. Change of conductivity of the emulsified asphalt-aggregate systems with time. When the conductivity reaches a stable value, demulsification is said to have occurred. (A) SDBS emulsified asphalt. (B) STAC emulsified asphalt.
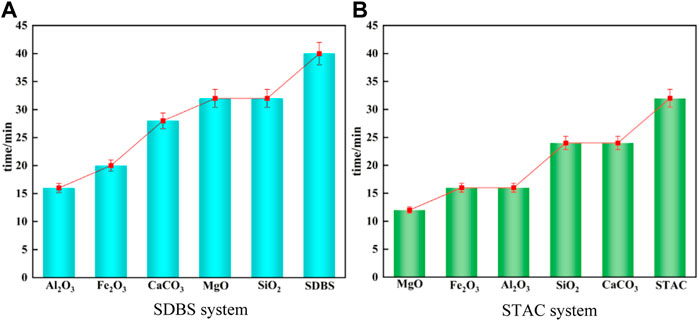
FIGURE 16. Demulsification time of the emulsified asphalt aggregate systems calculated from the conductivity measurements. (A) SDBS emulsified asphalt. (B) STAC emulsified asphalt.
If we assume that the emulsified asphalt has reached complete demulsification at the time t, then within the range of
We can now define the evaluation function
When
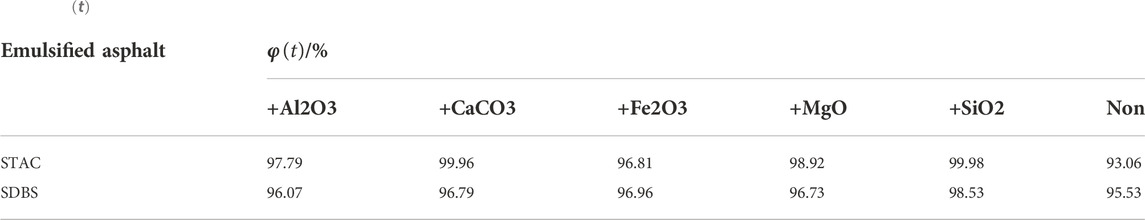
TABLE 7.
In the cationic (STAC) emulsified asphalt-aggregate system, the
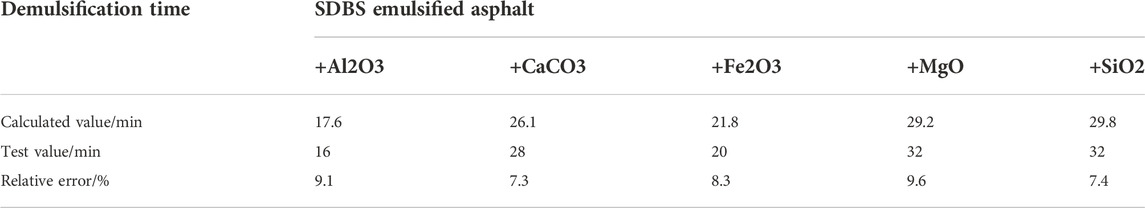
TABLE 8. Demulsification time of the SDBS emulsified asphalts.

TABLE 9. Demulsification time of the STAC emulsified asphalt.
Emulsified bitumen is a liquid physically-miscible system in which the dispersed phase (droplets of bitumen binder) is dispersed in a dispersion medium (water) by mechanical and melting action (Hu et al., 2017). The mechanism of the demulsification process of emulsified asphalt is currently believed to be that the water phase in the emulsion rapidly wets the aggregate surface, forming a layer of adsorbed water film on its surface. At the same time, the hydrophilic group of the emulsifier molecule is adsorbed tightly on the aggregate surface through capillary action. The hydrophobic group of the emulsifier molecule then drives the asphalt droplets to the surface of the aggregate, and they absorb together to complete the demulsification (Jin et al., 2013). In this way, the chemical composition of the aggregate directly affects the demulsification time of the emulsified asphalt.
The majority of research on the mechanism of demulsification has focused on aggregate surface morphology (Wang et al., 2020), gradation (Xu et al., 2017), and strength and shape (Hassan et al., 2021). Although (Tang et al., 2018) used UV spectroscopy to investigate the effect of aggregate chemical composition on the demulsification of emulsified asphalt, the effect of viscosity has largely been ignored. In this study, we discovered that the chemical composition of the aggregate has an accelerating effect on the demulsification of emulsified asphalt. Based on existing theoretical research on aggregates, the main chemical components of aggregates are studied instead of aggregates, and the demulsification mechanism of an emulsified asphalt-aggregate system can be studied from a microscopic perspective, with reliable test results. Al2O3 improves the demulsification speed of anionic (SDBS) emulsified asphalt by 60%, MgO improves the demulsification speed of cationic (STAC) emulsified asphalt by 60%, and other chemical components improve to varying degrees (Figure 17).
FIGURE 17. Acceleration effect of demulsification of the different aggregates over that of asphalt without any aggregates. (A) SDBS emulsified asphalt. (B) STAC emulsified asphalt.
This paper focuses on the effect of aggregate chemical composition on the demulsification process of emulsified asphalts. The main conclusions are as follows:
(1) The aggregate’s main chemical composition significantly affects the demulsification rate, with the degree of effect going in the following order: surface energy > pH > specific surface area.
(2) The acceleration effect of the chemical composition of the aggregate on the demulsification rate differs between the aggregates and the asphalt systems, with the degree of effect of the anionic emulsified asphalt system (SDBS) following the order: Al2O3 > Fe2O3 > CaCO3 > MgO > SiO2, and for cationic (STAC) emulsified asphalt systems: Al2O3 > CaCO3 > Fe2O3 >MgO > SiO2.
(3) Al2O3 and MgO have a high affinity for anionic (SDBS) and cationic (STAC) emulsified asphalts, respectively, and their viscosity values are relatively high, so they have good compatibility.
(4) The Gompertz model has high accuracy in qualitatively describing the change in viscosity of the emulsified asphalt aggregate system (R2 > 0.93).
(5) Demulsification was quantified using a function related to the Gompertz model parameters,
The original contributions presented in the study are included in the article/supplementary material, further inquiries can be directed to the corresponding author.
WT: Conceptualization, project administration, writing-review and editing. SZ: Conceptualization, methodology, software, investigation, writing-original draft, writing-review and editing. LK: Validation, software, writing-review and editing. YP: Validation, formal analysis, writing-review and editing. LX: Validation, formal analysis, writing-review and editing. YF: Validation, formal analysis, writing-review and editing.
The authors would like to acknowledge the financial support provided by the National Natural Science Foundation of China (NSFC) (Grant No. 51508062).
Author YF was employed by Chongqing Airport Group.
The remaining authors declare that the research was conducted in the absence of any commercial or financial relationships that could be construed as a potential conflict of interest.
All claims expressed in this article are solely those of the authors and do not necessarily represent those of their affiliated organizations, or those of the publisher, the editors and the reviewers. Any product that may be evaluated in this article, or claim that may be made by its manufacturer, is not guaranteed or endorsed by the publisher.
Bangera, A. E., and Appaiah, K. (2019). A conditional justification for the determination of surface energy of solids using contact angle methods. Mat. Chem. Phys. 234, 168–171. doi:10.1016/j.matchemphys.2019.06.008
Baoju, L., Jinyan, S., Yitian, H., Yuanxia, Y., Junyi, J., and Zhihai, H. (2022). Factors influencing the demulsification time of asphalt emulsion in fresh cement emulsified asphalt composite binder. Road. Mat. Pavement Des. 23 (2), 477–490. doi:10.1080/14680629.2020.1828151
Berg, J. C. (2010). An introduction to interfaces & colloids: The bridge to nanoscience. Singapore: World Scientific.
Busang, S., and Maina, J. (2022). Influence of aggregates properties on microstructural properties and mechanical performance of asphalt mixtures. Constr. Build. Mat. 318, 126002. doi:10.1016/j.conbuildmat.2021.126002
Cala, A., Caro, S., Lleras, M., and Rojas-Agramonte, Y. (2019). Impact of the chemical composition of aggregates on the adhesion quality and durability of asphalt-aggregate systems. Constr. Build. Mat. 216, 661–672. doi:10.1016/j.conbuildmat.2019.05.030
Çıtak, A., and Yarbaş, T. (2022). Using contact angle measurement technique for determination of the surface free energy of B-SBA-15-x materials. Int. J. Adhes. Adhes. 112, 103024. doi:10.1016/j.ijadhadh.2021.103024
Esping, O. (2008). Effect of limestone filler BET(H2O)-area on the fresh and hardened properties of self-compacting concrete. Cem. Concr. Res. 38 (7), 938–944. doi:10.1016/j.cemconres.2008.03.010
Fajun, Z., Zhexi, T., Zhongqi, Y., Hongzhi, S., Yanping, W., and Yufei, Z. (2020). Research status and analysis of stabilization mechanisms and demulsification methods of heavy oil emulsions. Energy Sci. Eng. 8 (12), 4158–4177. doi:10.1002/ese3.814
Hanxi, W., Jitian, S., Jianling, X., and Lianxi, S. (2021). Study on clogging mechanisms of constructed wetlands from the perspective of wastewater electrical conductivity change under different substrate conditions. J. Environ. Manag. 292, 112813. doi:10.1016/j.jenvman.2021.112813
Hassan, H. M. Z., Wu, K., Huang, W., Chen, S., Zhang, Q., Xie, J., et al. (2021). Study on the influence of aggregate strength and shape on the performance of asphalt mixture. Constr. Build. Mat. 294, 123599. doi:10.1016/j.conbuildmat.2021.123599
Hu, X., Lei, Y., Wang, H., Jiang, P., Yang, X., and You, Z. (2017). Effect of tack coat dosage and temperature on the interface shear properties of asphalt layers bonded with emulsified asphalt binders. Constr. Build. Mat. 141, 86–93. doi:10.1016/j.conbuildmat.2017.02.157
Huang, T., Luo, J., Luo, R., and Tu, C. (2022). Investigation on the relationship between the surface texture index and the surface free energy of aggregate. Constr. Build. Mat. 325, 126759. doi:10.1016/j.conbuildmat.2022.126759
James, A. (2006). Overview of asphalt emulsion. Transp. Res. Circ. E-C102 Asph. Emuls. Technol., 1–15.
Jiang, S., Li, J., Zhang, Z., Wu, H., and Liu, G. (2021). Factors influencing the performance of cement emulsified asphalt mortar–A review. Constr. Build. Mat. 279, 122479. doi:10.1016/j.conbuildmat.2021.122479
Jin, S. R., Zhang, K., Pang, J. X., and Song, S. S. (2013). Synthesis and application research of op-10/cationic surfactant composite asphalt emulsifier. Appl. Mech. Mat. 2559, 664–668. doi:10.4028/www.scientific.net/AMM.364.664
Jiu-peng, Z., Hong-bin, Z., Jian-zhong, P., and Zi-jun, L. (2015). Evaluation of asphalt demulsification and viscosity of modified asphalt emulsion mortar based on Gompertz model. J. Transp. Eng. 15, 1–7. doi:10.19818/j.cnki.1671–1637.2015.05.001
Ju-Long, D. (1982). Control problems of grey systems. Syst. Control Lett. 1 (5), 288–294. doi:10.1016/S0167–6911(82)80025-X
Lee, C., Lee, J. W., Ryu, S. G., and Oh, J. H. (2019). Optimum design of a large area, flexure based XYθ mask alignment stage for a 12-inch wafer using grey relation analysis. Robot. Computer-Integrated Manuf. 58, 109–119. doi:10.1016/j.rcim.2019.02.005
Li, C., Tang, T., Zheng, T., Hong, W., Wang, F., Liu, G., et al. (2021). Preparation and characterization of a new negatively charged PTFE fiber membrane for separating oil-in-water emulsions containing cationic emulsifiers. Fibers Polym. 22, 3025–3034. doi:10.1007/S12221–021–0390–6
Li, Y., Liang, H., Lin, J., Fan, L., Li, Y., and Wei, H. (2020). Experimental study on demulsification speed of emulsified asphalt based on equivalent surface area principle. E3S Web Conf. 198, 01044. doi:10.1051/e3sconf/202019801044
Li, Y., and Wang, P. (2014). Effect of emulsified asphalt content on mechanical property of cement and emulsified asphalt mortar. Appl. Mech. Mat. 3308, 1132–1136. doi:10.4028/www.scientific.net/AMM.587–589.1132
Ma, F., Sha, A., Lin, R., Huang, Y., and Wang, C. (2016). Greenhouse gas emissions from asphalt pavement construction: A case study in China. Int. J. Environ. Res. Public Health 13 (3), 351. doi:10.3390/ijerph13030351
Pan, P., Wu, S., Hu, X., Liu, G., and Li, B. (2017). Effect of material composition and environmental condition on thermal characteristics of conductive asphalt concrete. Mat. (Basel) 10 (3), 218. doi:10.3390/ma10030218
Pelinovsky, E., Kokoulina, M., Epifanova, A., Kurkin, A., Kurkina, O., Tang, M., et al. (2022). Gompertz model in COVID-19 spreading simulation. Chaos, Solit. Fractals 154, 111699. doi:10.1016/j.chaos.2021.111699
Raposeiras, A. C., Rojas-Mora, J., Piffaut, E., Movilla-Quesada, D., and Castro-Fresno, D. (2016). Development of an estimative model for the optimal tack coat dosage based on aggregate gradation of hot mix asphalt pavements. Constr. Build. Mat. 118, 1–10. doi:10.1016/j.conbuildmat.2016.05.045
Satoh, D., and Matsumura, R. (2019). Monotonic decrease of upper limit estimated with Gompertz model for data described using logistic model. Jpn. J. Ind. Appl. Math. 36 (1), 79–96. doi:10.1007/s13160–018–0333–9
Savel’ev, A. M., and Yagodnikov, D. A. (2022). Mechanism of electric charging of aluminum oxide particles when burning solid fuels. J. Propuls. Power 38, 771–782. doi:10.2514/1.B38669
Singh, M. K., and Singh, A. (2022). “Chapter 16 - contact angle and surface wettability measurement,” in Characterization of polymers and fibres. (Cambridge, UK: Woodhead Publishing), 359–385. doi:10.1016/B978–0–12–823986–5.00013–0
Singh, S., Sundar, S. P., Saravanan, K., Harshavardhana, N., and Kumaran, D. (2021). Multi response optimization of setting input variables for getting better cylindrical cups in sheet metal spinning of Al 6061 – T6 by Grey relation analysis. Mat. Today Proc. 45, 1464–1470. doi:10.1016/j.matpr.2020.07.453
Tang, F., Xu, G., Ma, T., and Kong, L. (2018). Study on the effect of demulsification speed of emulsified asphalt based on surface characteristics of aggregates. Materials 11 (9), 1488. doi:10.3390/ma11091488
Tao, J., Shi, P., Fang, S., Li, K., Zhang, H., and Duan, M. (2015). Effect of rheology properties of oil/water interface on demulsification of crude oil emulsions. Ind. Eng. Chem. Res. 54 (17), 4851–4860. doi:10.1021/acs.iecr.5b00639
Vigneshkumar, M., and Sekar, P. (2021). Multi-objective optimization of process parameters in dry sliding wear characteristics of Al/sic composites using Taguchi grey relation analysis. Mat. Today Proc. 45, 1882–1886. doi:10.1016/j.matpr.2020.09.133
Wang, H. (2021). Research status and trend of cold recycling technology for emulsified asphalt. Int. J. Civ. Eng. Mach. Manuf. 6 (2).
Wang, L., Shen, A., and Yao, J. (2020). Effect of different coarse aggregate surface morphologies on cement emulsified asphalt adhesion. Constr. Build. Mat. 262, 120030. doi:10.1016/j.conbuildmat.2020.120030
Wang, Z., Liang, Q., Yan, F., and Bian, G. (2021). Strength improvement of cement emulsified asphalt mixture through aggregate gradation design. Constr. Build. Mat. 299, 124018. doi:10.1016/j.conbuildmat.2021.124018
Washburn, E. W. (1921). The dynamics of capillary flow. Phys. Rev. 17 (3), 273–283. doi:10.1103/physrev.17.273
Xiao, J., Jiang, W., Ye, W., Shan, J., and Wang, Z. (2019). Effect of cement and emulsified asphalt contents on the performance of cement-emulsified asphalt mixture. Constr. Build. Mat. 220, 577–586. doi:10.1016/j.conbuildmat.2019.06.051
Xiao, M., Yang, F., Im, S., Dlamini, D. S., Jassby, D., Mahendra, S., et al. (2022). Characterizing surface porosity of porous membranes via contact angle measurements. J. Membr. Sci. Lett. 2 (1), 100022. doi:10.1016/j.memlet.2022.100022
Xu, O., Wang, Z., and Wang, R. (2017). Effects of aggregate gradations and binder contents on engineering properties of cement emulsified asphalt mixtures. Constr. Build. Mat. 135, 632–640. doi:10.1016/j.conbuildmat.2016.12.095
Xu, W., and Luo, R. (2022). Evaluation of interaction between emulsified asphalt and mineral powder using rheology. Constr. Build. Mat. 318, 125990. doi:10.1016/j.conbuildmat.2021.125990
Keywords: emulsified asphalt, aggregate, Gompertz model, conductivity, demulsification
Citation: Tan W, Zhu S, Kong L, Peng Y, Xu L and Fu Y (2022) Influence of aggregate chemical composition on the demulsification rate of emulsified asphalt. Front. Mater. 9:1079431. doi: 10.3389/fmats.2022.1079431
Received: 26 October 2022; Accepted: 14 November 2022;
Published: 24 November 2022.
Edited by:
Derun Zhang, Huazhong University of Science and Technology, ChinaReviewed by:
Lei Xi, Hubei University of Technology, ChinaCopyright © 2022 Tan, Zhu, Kong, Peng, Xu and Fu. This is an open-access article distributed under the terms of the Creative Commons Attribution License (CC BY). The use, distribution or reproduction in other forums is permitted, provided the original author(s) and the copyright owner(s) are credited and that the original publication in this journal is cited, in accordance with accepted academic practice. No use, distribution or reproduction is permitted which does not comply with these terms.
*Correspondence: Lingyun Kong, a29uZ2xpbmd5dW5AY3FqdHUuZWR1LmNu
Disclaimer: All claims expressed in this article are solely those of the authors and do not necessarily represent those of their affiliated organizations, or those of the publisher, the editors and the reviewers. Any product that may be evaluated in this article or claim that may be made by its manufacturer is not guaranteed or endorsed by the publisher.
Research integrity at Frontiers
Learn more about the work of our research integrity team to safeguard the quality of each article we publish.