
94% of researchers rate our articles as excellent or good
Learn more about the work of our research integrity team to safeguard the quality of each article we publish.
Find out more
ORIGINAL RESEARCH article
Front. Mater., 19 December 2022
Sec. Semiconducting Materials and Devices
Volume 9 - 2022 | https://doi.org/10.3389/fmats.2022.1063763
This article is part of the Research Topic2022 Retrospective: Semiconducting Materials and DevicesView all 5 articles
 Stefano Carli1,2*
 Michele Bianchi1,3
 Michele Di Lauro1
 Mirko Prato4Andrea Toma5Marco Leoncini5Anna De Salvo1,6Mauro Murgia1,7
 Luciano Fadiga1,6†Fabio Biscarini1,3†
Organic Electrochemical Transistors (OECTs) are suitable for developing ultra-sensitive bioelectronic sensors. In the organic electrochemical transistors architecture, the source-drain channel is made of a conductive polymer film either cast from a formulated dispersion or electrodeposited from a monomer solution. The commercial poly(3,4-ethylenedioxidethiophene)/poly(styrene sulfonate) (PEDOT:PSS) water dispersion is the workhorse of organic bioelectronics for its high conductance, low impact and ease of processability. In this study, a hybrid organic electrochemical transistors channel fabrication strategy is presented, where electrochemical deposition of a PEDOT/X (with X indicating the counterion) is performed on a dispersion-cast PEDOT:PSS film. Six different counterions where used: X = PSS, Nafion, Hyaluronate, Dextran sulfate, Dexamethasone phosphate and tauroursodeoxycholic acid, each potentially endowing organic electrochemical transistors with additional functions such as ion exchange and pharmacological activity upon release of X. The PEDOT/X-PEDOT:PSS bilayers were characterized by means of electrochemical impedance spectroscopy (EIS), atomic force microscopy (AFM), X-ray photoelectron spectroscopy (XPS) and focused ion beam tomography combined with scanning electron microscopy (FIB-SEM). In addition, their respective organic electrochemical transistorss were characterized and compared to PEDOT:PSS organic electrochemical transistors. Our results show that the hybrid bilayer strategy is viable to fabricate multifunctional organic electrochemical transistorss with biologically-relevant function, thereby retaining the outstanding figures of merit of commercial PEDOT:PSS.
Among conductive polymers, poly(3,4-thylenedioxythiophene)/poly(styrene sulfonate) (PEDOT:PSS) is well known for its high thermal and electrochemical stability. This material exhibits good mixed electronic and ionic conductance, making it the workhorse conductive polymer in organic electronics and, in particular, in bioelectronics to fabricate organic electrochemical transistors (OECTs) (Lövenich, 2014; Inal et al., 2018). Commercial formulation of PEDOT:PSS, like the well-known CLEVIOS™ PH-1000 (Heraeus Deutschland GmbH & Co. KG) are widely adopted as route to conductive coatings, as their electronic conductivity exceeds the value of 1,000 S cm−1 upon treatment with some additives, like DMSO, EG or H2SO4 (Ouyang et al., 2004; Shi et al., 2015). The interest towards alternative compounds to PEDOT:PSS has considerably grown during recent years. Tailoring is done by replacing the polymeric chains of poly(styrene sulfonate) with other counterions (familiarly termed “dopants” in the literature). Tekoglu et al. (2019) prepared a water dispersion of PEDOT doped with deoxyribonucleic acid (DNA) by polymerization of EDOT in the presence of DNA. Their idea was that DNA units in PEDOT:DNA endow the blend with biospecific recognition, thereby resulting of interest in the field of bio-sensing (Bobacka et al., 2000). OECTs based on PEDOT:Nafion were recently reported, owing to the high ionic conductance of the ionomer Nafion which, once incorporated in PEDOT, yields either conductive fibers or a water dispersion (Carli et al., 2020; Hofmann et al., 2020). Inclusion of alternatives to poly(styrene sulfonate) can result beneficial to improve the biocompatibility of the conductive polymer films. For instance, the group of Mecerreyes synthesized water dispersions of PEDOT incorporating some glycosaminoglycans (GAGs) like hyaluronic acid, heparin, and chondroitin sulfate (Boehler et al., 2017). These polymer blends exhibited improved biocompatibility with respect to PEDOT:PSS and were effective in slowing down neurodegenerative processes in vivo animal models (Mantione et al., 2016). Similar results were observed for films of PEDOT doped with dextran sulfate (PEDOT:DS), which were obtained by casting a dispersion of the chemically prepared conductive polymer (Harman et al., 2015). Nevertheless, the conductivity of these alternative blends remains well below the conductivity exhibited by PEDOT:PSS. For example, the conductivity of PEDOT:DS was in the range from 6 to 20 S cm−1, whereas PEDOT:GAGs exhibited a conductivity lower than 0.1 S cm−1 (Harman et al., 2015; Stevens et al., 2015; Mantione et al., 2016). Conductivity on the order of 3–6 S cm−1 were also reported for PEDOT:Nafion fibers and water dispersion, respectively (Carli et al., 2020; Hofmann et al., 2020). Thus, PEDOT:PSS still remains the material of choice for the fabrication of high transconductance OECTs. The extremely high conductance of PEDOT:PSS coatings after treatment with polar solvents or strong acids is the result of an effective phase segregation which separates the insulating poly(styrene sulfonate) chains from conductive PEDOT oligomers (Shi et al., 2015). In addition, it is widely reported that some post-deposition treatments produce extensive crystalline domains leading to a substantial increase of the conductivity (Ouyang et al., 2004; Ouyang, 2013). It is likely that the treatment adopted to increase the conductivity of PEDOT:PSS are less effective with the alternative blends. Moreover, it is observed that polymeric anions used during the chemical oxidation to obtain a water dispersion of a PEDOT derivative are more effective because the extra-negative charge in polymers makes them act as surfactants. Monomeric anions do not provide sufficient solubility and stability to the dispersion.
Electrodeposition of PEDOT is widely adopted for manufacturing conductive coatings of metal electrodes. It is commonly used to decrease the total impedance of neural microelectrodes, and to produce alternative counter electrodes in dye sensitized solar cells (Cogan, 2008; Carli et al., 2013; Ellis et al., 2013; Boehler et al., 2020; Boehler et al., 2017; Carli et al., 2019a). PEDOT grows directly on the electroactive area by applying a suitable anodic potential for the oxidation of the monomer EDOT (Randriamahazaka et al., 1999; Soto et al., 2008). The advantage of the electrodeposition method, compared to chemical synthesis, is that it allows to obtain a virtually infinite number of PEDOT/X composites, where X stands for a generic counterion. Unlike oxidative chemical synthesis, also monomeric anions can be used to balance the positive charges on PEDOT generated by electropolymerization.
A systematic study of electrochemical deposition of PEDOT/PSS on Pt microelectrodes with various deposition charges evidenced the linear relationship between the film thickness and the consumed charge. The highest charge density, 600 mC cm−2, yielded PEDOT/PSS film thickness on the order of 3 μm (Guex et al., 2015). The area of electrodeposited film was comparable to the geometrical area of the Pt electrode, confirming that PEDOT/PSS tends to grow vertically rather than horizontally. Then, to increase the thickness of the PEDOT film, electrodeposition can be iterated to grow a second layer of PEDOT/X onto previously electrodeposited conductive polymer films (Esrafilzadeh et al., 2013; Boehler and Asplund, 2015; Castagnola et al., 2017). The nature of the counterion seems to influence the correlation between the increased area of electrodeposited PEDOT and the higher deposition charge (Harris et al., 2016; Harris et al., 2015; Harris et al., 2013).
This “template growth” of electrodeposited PEDOT/X films on the metal electrodes makes challenging to bridge drain and source electrodes by electrodeposition because of the large (normally tens of microns) channel lengths in current OECT layouts. Indeed, the use of electrodeposition to fabricate OECT devices is limited to a few reports, starting from the prototypical OECT described by Wrighton and co-workers where polypyrrole was electrodeposited across a channel 1.4 μm long (Kittlesen et al., 1984). Recently, OECTs with 15–30 μm channel length were fabricated by electropolymerization of self-doped conjugated PEDOT (Gerasimov et al., 2021; Gerasimov et al., 2019). Electrodeposition of PEDOT has been also performed with alternate current (AC) to yield OECTs with 10 μm channel length (Ji et al., 2019b; Ji et al., 2019a).
The evidence discussed above suggests that merging dispersion cast deposition of PEDOT:PSS formulations with electrodeposition of PEDOT/X could be viable to fabricate PEDOT/X based OECTs featuring large channel lengths. This was pioneered by Hai et al. (2018) who fabricated an OECT sensor specific for human influenza A virus by electrodepositing a functionalized PEDOT layer on a spin-cast PEDOT:PSS film.
In the present study, this concept was systematically explored by expanding the possibility to fabricate OECTs with a channel length as long as 100 μm, and endowed with additional functional properties linked to the choice of the counterion X. The integrated approach consists of two consecutive steps: first, a thin film of PEDOT:PSS (PH-1000) was deposited by drop casting across the OECT channel, then a second layer of PEDOT/X was electrodeposited on the cast PEDOT:PSS film. To validate this method and show its versatility, six different counter ions X were deposited and investigated. In detail, the two ionomers poly(4-styrenesulfonate) and Nafion were chosen because of their well-known good ion transport properties. The two polysaccharides hyaluronic acid and dextran sulfate, respectively, were adopted as bio-dopants for PEDOT, since their excellent biocompatibility may be exploited for interfacing the device with living matter. The natural hyaluronic acid is abundantly present in almost all biological fluids and tissues (Kogan et al., 2008), and dextran sulfate has historically been used as anticoagulant (Hall and Ricketts, 1952). Finally, the synthetic corticosteroid dexamethasone and tauro-ursodeoxycholic acid (a natural component of human bile acids pool) were incorporated in neural microelectrodes with the aim to reduce the inflammatory response of the surrounding tissue after implantation (S. Carli et al., 2019b; Kleber et al., 2017). Thus, dexamethasone phosphate and tauro-ursodeoxycholic acid were chosen to demonstrate that bioactive molecules can be incorporated also in OECT-based implants, enabling the possibility of releasing anionic bioactive molecules locally on demand or triggered by some altered physiological condition. It should be underlined that the approach pioneered by Isaksson et al., 2007, based on organic electrochemical injection pumps (OEIP), is used to deliver cationic bioactive molecules while it has not been shown for anionic and neutral moieties (Isaksson et al., 2007).
To gain insights on the electrochemical and electrical properties of the PEDOT/X-PEDOT:PSS bilayer, full characterization was obtained by means of cyclic voltammetry (CV), electrochemical impedance spectroscopy (EIS), atomic force microscopy (AFM), X-ray photoelectron spectroscopy (XPS) and focused ion beam tomography combined with scanning electron microscopy (FIB-SEM). Finally, the comparison between OECTs fabricated with the commercial PH-1000 solution and the devices assembled in conjunction to the electrodeposition method is provided. The scope is to demonstrate that, through the dual step method, it is possible to introduce multiple functional dopants in PEDOT while preserving the optimal characteristics of state-of-the-art PEDOT:PSS based devices.
PEDOT:PSS solution (Clevios PH-1000) was purchased from Heraeus Precious Metals GmbH & Co. (Leverkusen, Germany). The nominal solid content and PEDOT-to-PSS ratio of the PH-1000 solution are 1%–1.3% and 1:2.5 by weight, respectively. 2,3-dihydrothieno[3,4-b]-1,4-dioxin (EDOT), sodium polystyrene sulfonate (NaPSS), Nafion 117 solution (≈5% in a mixture of lower aliphatic alcohols and water), hyaluronic acid sodium salt from rooster comb, dextran sulfate sodium salt, dexamethasone 21-phosphate disodium salt, (3-glycidyloxypropyl)-trimethoxysilane (GOPS), dimethyl sulfoxide (DMSO), and sodium chloride (NaCl) were purchased from Sigma-Aldrich (Italy). Tauroursodeoxycholic acid sodium salt was purchased from Glentham Life Sciences Ltd., United Kingdom. Ultrapure water (Milli-Q, Millipore, United States). All experimental data were refined using OriginPro 2020 software.
The test pattern used in this study consisted of a pair of gold source/drain electrodes (channel width = 400 μm, channel length = 100 μm, width-to-length ratio W/L = 4) patterned onto a flexible polyimide substrate (Phoenix S.R.L., Italy) (Carli et al., 2020). The commercial solution of PH-1000 was treated with DMSO and GOPS at the volume ratio 5% and 0.2%, respectively, and diluted with Milli-Q water (1:10 by volume). Before use, this solution was ultra-sonicated at room temperature for 5 min 0.5 μl of the diluted solution of PH-1000 were deposited by drop casting on the top of the device area. After 30 min at room temperature, the device was heated at 120°C for 30 min and cooled to room temperature. Electrodepositions of PEDOT/X films were carried out by immerging the PH-1000 coated device in a water solution of EDOT (0.01 M) and poly(4-styrenesulfonate), Nafion, hyaluronic acid, dextran sulfate, dexamethasone phosphate or tauroursodeoxycholic acid. For sake of clarity, OECT channels fabricated with the aqueous solution of PEDOT:PSS will be indicated by the acronym PH-1000. OECT channels prepared by the electrodeposition of PEDOT/X on PH-1000 will be abbreviated with PSS, NAF, HA, DS, DP, and TU to indicate electrodeposition of PEDOT in the presence of sodium poly(4-styrenesulfonate), Nafion sodium salt, sodium hyaluronate, dextran sulfate, dexamethasone-phosphate and tauro-ursodeoxycholic acid sodium salt, respectively. In the case of PSS and NAF the monomer solutions were prepared according to a previously reported study (Carli et al., 2019a). Electrodeposition solution for HA and DS coatings were prepared by dissolving hyaluronic acid or dextran sulfate under vigorous stirring in Milli-Q water at a concentration of 0.35% and 0.37% by weight, respectively. DP and TU deposition solution were prepared in accordance with our previous work (S. Carli et al., 2019b). Potentiostatic mode was used during the electrodeposition, which consisted of a two-step chronoamperometric experiment: during the first capacitive step a potential of +0.2 V was maintained for 5 s and, subsequently, the potential was switched at 1 V, at which the faradaic oxidation of EDOT can be observed. The source and drain electrodes were shorted together, and the channel was used as the working electrode. The total charge consumed during the entire process was limited to 25 mC cm−2 or 100 mC cm−2.
A Reference 600 potentiostat (Gamry Instruments, United States) was used for electrodepositions and for the electrochemical characterization. All electrochemical measurements were made in saline (NaClaq 0.9% w/w) in a three-electrode cell with the device set as the working electrode, a large-area platinum counter electrode and a Ag|AgCl (3 M KCl) reference electrode. All potentials were reported with respect to Ag|AgCl (+0.197 V vs. normal hydrogen electrode, NHE). During EIS measurements, a sine wave (10 mV RMS amplitude) was superimposed at the potential of 0 V while varying the frequency from 105 to 0.4 Hz. For CV analysis, the working electrode potential was swept between +0.2 and −0.8 V, at a scan rate of 20 mV s−1. The source and drain electrodes were shorted together, and the channel was used as the working electrode. The software ZSimpWin V 3.2 (EChem Software) was used for equivalent circuit modeling of EIS data within the frequency range of 105–0.4 Hz and χ2 values in the range of 10−4–10–5 were used to estimate the goodness of the fit.
Atomic Force Microscopy (AFM) images were acquired using a Park XE7 AFM System (Park Systems, Suwon, Korea) operating in non-contact mode, in air at room temperature. Pre-mounted silicon cantilevers were used (OMCL-AC160TS, Olympus Micro Cantilevers, Tokyo, Japan; tip curvature radius ∼7 nm, k ∼ 26 N/m and Al backside coating). The Root Mean Square roughness (RMS) was extracted and averaged from several regions in the channel area of the OECT device. At least two topography images for each scan size, i.e., 1 μm2 × 1 μm2, 2.5 μm2 × 2.5 μm2, 5 μm2 × 5 μm2, and 10 μm2 × 10 μm2, were acquired and analyzed with the Park Systems XEI Software (Park Systems, Suwon, Korea). Before extracting the RMS values, all images were flattened using a second order regression in X direction and a first order regression in Y direction. Gwyddion 2.56 free analysis software was used to calculate the average grain size: the lateral size of at least 30 grains from two different 1 μm2 × 1 μm2 images from each sample was acquired and averaged using the distance measuring tool. All values are reported as mean ± standard deviation.
XPS spectra were acquired using a monochromatic Al Κα source operated at 20 mA and 15 kV. High-resolution spectra were collected at a pass energy of 20 eV and an energy step of 0.1 eV, and the Kratos charge neutralizer system was used on all specimens.
SEM characterization was performed through a FEI Helios NanoLab 650 dual beam FIB/SEM system. The very same machine was used to carve 7 µm2 × 7 µm2 trenches by employing Ga+ ions at 30 keV and 0.43 nA of beam energy and ion current, respectively. The cross-section walls were subsequently cleaned by lowering the ion current intensity (0.23, 0.80, and 0.40 nA) in order to investigate smoother surfaces. SEM images were then acquired with a 2 kV accelerating voltage, 50 pA current and 50 V of beam deceleration voltage.
A two-channel source-measure unit (Keysight B2912A) was used to characterize OECTs using saline as the electrolyte and a Pt foil as the gate electrode. Transient current pulses of OECTs were acquired by measuring the drain-source current (Ids) vs. time, fixing the drain-source potential (Vds) at −0.8 V and switching on the gate-source potential (Vgs) from 0 V to +0.2 V at a fixed time and maintaining Vgs = +0.2 for 1 s.
A sketch of the procedure to fabricate both PH-1000- and PEDOT/X-based OECTs is depicted in Figure 1. As first step, a layer of PEDOT:PSS was deposited by drop casting a diluted solution of PH-1000 added with DMSO to increase its conductivity (Shi et al., 2015). The highly conductive PH-1000 film represents an optimal electrochemical surface for the subsequent electrodeposition of the PEDOT/X films.
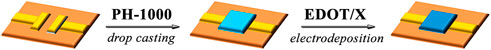
FIGURE 1. Schematic representation of the mixed-layer approach that consists of two steps, i.e., the drop casting of PH-1000 and the subsequent electrodeposition of PEDOT/X at 25 or 100 mC cm−2 charge densities. The yellow lines, the orange and blue parts are referred to the pair of gold source/drain electrodes, the insulating polyimide substrate and to PEDOT respectively.
To ensure comparable numbers of charge carriers, all PEDOT/X composites were prepared in potentiostatic mode under controlled charge, considering that the amount of electrodeposited PEDOT is strictly related to the faradaic charge consumed during the electrochemical oxidation of the monomer EDOT (Roncali, 1992). In particular, two representative deposition charges (Qdep) of 25 mC cm−2 and 100 mC cm−2 were adopted. Moreover, the same voltage was applied during the electrodeposition of all PEDOT/X materials in order to ensure that the surface morphology of the resulting film is not affected by this experimental parameter (Xia et al., 2007).
It has been also reported that the faradaic charge (QCV) extracted from the cathodic sweep of CV traces (see Supplementary Figure S1; Supplementary Table S2) is related to the number of electrons which are needed to reduce the portion of PEDOT accessed by the electrolyte (Efimov et al., 2001). This number corresponds to the amount of charge carriers in PEDOT, assuming that the extraction of one electron yields an active site (hole) in the conductive polymer. PH-1000 films exhibited a QCV value on the range of 25–26 μC, whereas a value of about 35–40 μC was observed for all electrodeposited films at Qdep = 25 mC cm−2, confirming that a similar amount of charge carriers was introduced by the electrodeposition of PEDOT/X (see Supplementary Table S2). This further corroborates the fact that upon electrodeposition under controlled charge the same mass of PEDOT is deposited regardless of the counterion X−, as discussed above (Efimov et al., 2001; Boehler and Asplund, 2015). A similar trend was observed for electrodeposited films at Qdep = 100 mC cm−2 albeit in this case the QCV increased to 55–60 mC cm−2. The extra amount of charge carriers Qratio introduced by the electrodeposition of PEDOT/X with respect to the native PH-1000 layer, is defined by Eq. 1:
where QCV(PEDOT/X) and QCV(PH-1000) are the faradaic charges extracted from the CV traces after and before the electrodeposition of PEDOT/X films, respectively. It was found that the electrodeposition at 25 mC cm−2 and 100 mC cm−2 yields a Qratio value of about 0.5 and 1.2, respectively, to indicate that the extra amount of charge carriers introduced by PEDOT/X becomes higher than that of PH-1000 only at the deposition charge of 100 mC cm−2 (see Figure 2A). The typical impedance response of PH-1000 films is reported in Figure 2B, which outlines a frequency independent region over the frequency range from 100 kHz to ≈50 Hz and a transition from resistive to capacitive behavior at frequencies lower than ≈50 Hz |Z| (see also Supplementary Figures S3, S4) (Carli et al., 2020). The further incorporation of the electrodeposited PEDOT/X films preserved the main features observed for PH-1000 but extended the frequency independent region, especially in the case of films obtained at the highest deposition charge Qdep = 100 mC cm−2 (Figure 2B; Supplementary Figures S3, S4). This is consistent with the absence of any relevant charge transfer resistance at the interface between the pristine PH-1000 and the newly deposited PEDOT/X films. Indeed, it was reported that a widening of the frequency independent region is consistent with an optimal electrochemical interface, i.e., rapid and efficient charge transfer, between two different PEDOT films electrodeposited with a multiple layer approach (Castagnola et al., 2017). In addition, similar results were obtained by increasing the electrodeposition time, to provide thicker films of PEDOT (Kayinamura et al., 2010). Electrodeposition of PEDOT/X produced also the decrease of |Z| at low frequencies, which is indicative of an improved overall capacitance. This can be understood considering that at frequencies lower than 1 Hz, all PEDOT based coatings exhibited a phase angle (φ) of ≈90° which reflects a capacitive behavior (Supplementary Figure S4; Supplementary Table S5) (Barsoukov and Macdonald, 2005). Thus, film capacitance (C) can be extracted at the low frequency limit of EIS, according to the equation
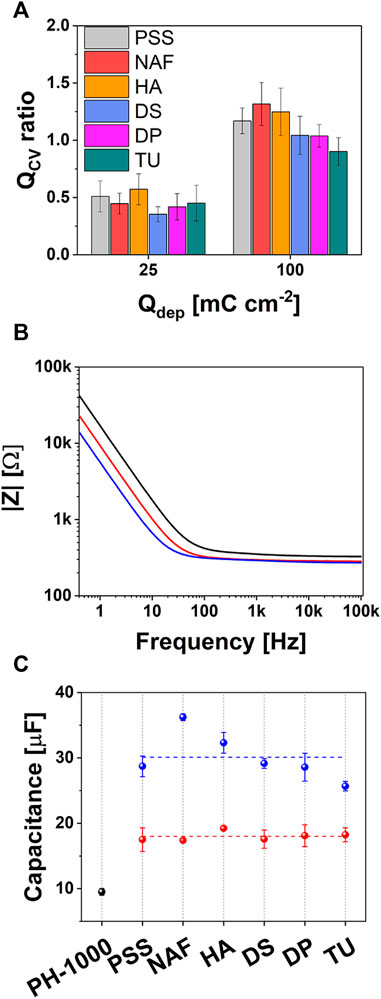
FIGURE 2. (A) Qratio values obtained from CV analysis (see the text for details); (B) representative Bode plot showing the impedence |Z| for films of PH-1000 (black), PEDOT/X at Qdep = 25 mC cm−2 (red) and Qdep = 100 mC cm−2 (blue), respectively; (C) variation of capacitance values at Qdep = 25 mC cm−2 (red) and Qdep = 100 mC cm−2 (blue), compared to PH-1000 (black).
As shown in Figure 2C, the capacitance substantially increased upon the electrodeposition at both Qdep = 25 mC cm−2 and 100 mC cm−2, which is consistent with an enhanced space charge due to the introduction of additional charge carriers. In particular, films deposited at Qdep = 25 mC cm−2 exhibited a capacitance of about 18 μF, substantially larger than the mean value observed for PH-1000 (≈8 μF). The absence of any significant difference between the capacitance values of films deposited at Qdep = 25 mC cm−2, suggests that at this lower deposition charge the capacitance is not related to the chemical nature of the counter ion X−.
When the deposition charge was increased to 100 mC cm−2, a further increase of the capacitance to values larger than 25 μF was observed, with the case of X = NAF exceeding 35 μF. Having already confirmed that a comparable amount of charge carriers was introduced during the electrodeposition process, the extra-enhancement of the capacitance observed for NAF could be linked to a characteristic property of electrodeposited PEDOT/Nafion. In general, the capacitance of PEDOT is strongly linked to the diffusion dynamics of ions through its pores (Bobacka et al., 2000). Larger capacitance was reported for PEDOT/Nafion, if compared to PEDOT/PSS, when both materials were electrodeposited at the same deposition charge, owing to a more efficient transport of ions inside PEDOT/Nafion (Carli et al., 2019a).
Results of Atomic Force Microscopy (AFM) analysis are shown in Figure 3. In Figure 3A, representative 1 μm2 × 1 μm2 images of the 2D topography of the different films investigated in this work are depicted. The surface of the PH-1000 layer exhibits a typical fibrillar morphology due to the PSS phase segregation following DMSO addition (Bianchi et al., 2020). The presence of the electrodeposited PEDOT/X films can be observed in the samples deposited at Qdep = 25 mC cm−2 by a clear change of morphology towards a granular surface texture (Figure 3A, top), characteristics of PEDOT films electrodeposited in micellar water media (Carli et al., 2013; S. Carli et al., 2019b; Carli et al., 2019a; Castagnola et al., 2014; Sakmeche et al., 1999). Interestingly, a different behavior can be observed for films deposited at Qdep = 100 mC cm−2 (Figure 2A, bottom). NAF and DS films developed larger grains than those deposited at Qdep = 25 mC cm−2, while the other PEDOT/X exhibited grains of similar size (Figure 3B). Plots of the Root Mean Square (RMS) roughness (σ) vs. length scale (L) for PH-1000 and films deposited at Qdep = 25 mC cm−2 and Qdep = 100 mC cm−2 are reported in Supplementary Figures S6, S7, respectively. RMS data are best fit with the power law equation σ = A Lα = σ∞

FIGURE 3. Results of AFM analysis. (A) Topography images (scan size is 1 × 1 μm2) of the PH-1000 layer and of the electrodeposited PEDOT/X thin films deposited at Qdep 25 and 100 mC cm−2; (B) average grain size and (C) roughness scaling exponent for PEDOT/X films deposited at 100 mC cm−2.
In order to shed more light on the increased capacitance observed after the electrodeposition of PEDOT/X as well as to provide additional insights on the highest capacitance value exhibited by NAF at Qdep = 100 mC cm−2, experimental EIS data were fitted with an equivalent circuit model. According to literature, a series of a solution resistance Rs, an electronic capacitance Cel and a finite-length Warburg impedance element ZD was used as the electric equivalent, as shown in Supplementary Figure S8 (Bobacka et al., 2000; Cui and Martin, 2003; Bianchi et al., 2020). The Warburg circuit element describes the diffusion of ions through the porous structure of PEDOT and can be expressed as
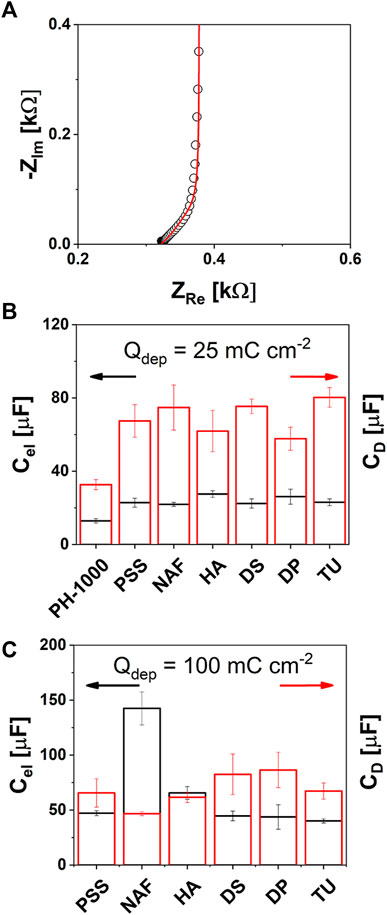
FIGURE 4. EIS analysis: (A) typical complex plane (Nyquist) plot showing the high frequency 45° line of the Warburg diffusion element ZD (experimental and calculated impedance values were reported as black circles or red line, respectively); (B) and (C) electronic Cel (black) and diffusional capacitance CD values extracted by the EIS fitting for PH-1000 and PEDOT/X at 25 or 100 mC cm−2 of deposition charge, respectively (mean values ± std, n = 3).
It can be observed in Figure 4B (details are in Supplementary Table S9) that the electronic capacitance Cel and the pseudo-diffusional capacitance CD of PH-1000 films are on the order of 13 and 32 μF, respectively. The electronic capacitance increased at ≈ 32 μF after electrodeposition at Qdep = 25 mC cm−2 for all PEDOT/X (Figure 4B; Supplementary Table S9). The physical meaning of Cel has been ascribed to the space charge layer of the conductive polymer (Bobacka et al., 2000; Bobacka et al., 1992). Since electrodeposition of PEDOT/X increases the amount of charge carriers, this translates into larger values of Cel. Interestingly, the incorporation of the electrodeposited films at the deposition charge of 100 mC cm−2 produced a further increase of the value of Cel to about 45–70 μF for PSS, HA, DS, DP, and TU, whereas NAF exhibited the highest values of ≈140 μF, as shown in Figure 4C (Supplementary Table S9). As confirmed by CV analysis, the extra amount of charge carriers scaled with the electrodeposition charge and was not affected by the nature of PEDOT/X (see Figure 2A). Only in the case of NAF, the counterion is likely to play an important role to determine the further improvement of Cel. This can be linked to the fact that, as it is known, Nafion ionomer exhibits good proton conductivity and a specific capacitance on the order of 0.09 S cm−1 and 64 nF g−1, respectively (Yadav and Fedkiw, 2012). Thus, this may result beneficial to improve the electronic capacitance of NAF deposited at 100 mC cm−2, with respect to other electrodeposited PEDOT/X materials. Although the physical meaning of Cel has been ascribed to the space charge, Bobacka et al. (2000) observed that for electrodeposited PEDOT/PSS, Cel was also influenced by the properties of the electrolyte. In particular, an electrolyte like NaCl yielded larger values of Cel if compared to NaPSS which may be linked to a slower and/or restricted ion transport of the PSS anions through PEDOT pores, due to PSS molecular size much larger than chloride ions (Bobacka et al., 2000). This hints that larger values of Cel are expected when the electrolyte interpenetrates more efficiently the PEDOT porous structure for the same deposition charge. Consistently, larger nm-scale roughness was measured by AFM for NAF deposited at Qdep = 100 mC cm−2, thus supporting the hypothesis that the further electrodeposition of PEDOT/Nafion enables more efficient diffusion of the electrolyte through the innermost sites. As a result, a larger fraction of charge carriers can be activated by the intimacy of the counterion with the hole transport PEDOT domains, thereby leading to the enhancement of the electronic capacitance Cel. About diffusional capacitance CD, a general improvement is observed already at Qdep = 25 mC cm−2 where all electrodeposited materials exhibited a value of about 60–70 μF (see Figure 4B and Supplementary Table S9) whereas a lower value of about 32 μF was observed for PH-1000. The physical meaning of CD has been linked to the ionic diffusion which is mostly dominated by the ability of an electrolyte to diffuse through the porous structure of PEDOT. In addition, higher values of CD were reported for electrodeposited PEDOT/PSS if compared to PEDOT doped with Cl−, prepared at the same deposition charges (Bobacka et al., 2000). This can be explained by considering that when a monomeric anion is used, e.g., chloride or tosylate, only the amount of anions needed to counterbalance the positive charges on PEDOT are incorporated (Zotti et al., 2003; Spanninga et al., 2009). In contrast, when a polymeric counter ion is used, like polystyrene sulfonate, an excess of sulfonate groups are incorporated during electrodeposition. Thus, an increase of CD can be generally linked to a more efficient ion transport and/or to a higher local concentration of ionic groups distributed across the polymeric counterion (Bobacka et al., 2000). Now, considering that the electrolyte used in this study during EIS measurements was the same, the fact that CD increased at about the same value, between 60 and 80 μF (see Figure 4B), at Qdep = 25 mC cm−2 indicates that in these conditions this parameter was not affected by the nature of the electrodeposited material. That is, at this deposition charge, CD is almost entirely dominated by the electrolyte rather than by the chemical structure of the new electro-generated PEDOT films. This suggests that the electrodeposition of a small amount of PEDOT/X can result beneficial to improve the diffusion of the electrolyte within the active layer compared to PH-1000 film alone. Interestingly, the value of CD did not vary significantly when the electrodeposition charge was increased to 100 mC cm−2 (Figure 4C; Supplementary Table S9) except for NAF, for which, the higher capacitance C can be ascribed to a greatly enhanced electronic capacitance Cel, that is likely linked to the good ion conductivity/transport of Nafion counterion, thus making CD the leading contribution. In addition, the fact that CD was not influenced by the electrodeposition charge, nor by the type of electrodeposited material, accounts for a polymer growth that starts inside the PH-1000 microstructure. This is expected to produce a mixed layer of PH-1000 and PEDOT/X rather than a bilayer in which the electrodeposited film growth on the top of the drop cast PH-1000 layer.
To confirm this hypothesis, the surface of PEDOT based films was investigated by means of quantitative XPS analysis. In particular, it is known that chemically prepared PEDOT:PSS (including PH-1000) exhibits a higher concentration of the insulating polystyrene sulfonate with respect to PEDOT chains (Zotti et al., 2003; Bianchi et al., 2020). The parameter RS/T, as defined by Zotti et al. (2003), provides a quantitative estimation of the ratio between sulfur atoms in the sulfonic groups of polystyrene sulfonate or in the thiophene rings of PEDOT (Zotti et al., 2003). As reported in Supplementary Table S10, PH-1000 exhibited the highest RS/T ratio of 2.6, in line with the literature (Bianchi et al., 2020). After the electrodeposition of PEDOT/X at Qdep = 25 mC cm−2, a reduction of the amount of polystyrene sulfonate chains on the surface was confirmed by the lower RS/T values, ranging between 1.9 (PSS) and 1 (TU and DP). The reduction of RS/T was less pronounced for films doped with the polymeric anions PSS, DS, NAF, and HA (RS/T = 1.9, 1.5, 1.3, 1.2 respectively) whereas it was more effective in the cases of TU and DP doped with monomeric anions (RS/T = 1). The trend can be clearly observed in Figure 5A, which outlines the reduction of the intensity for the S 2p signals linked to sulfonate groups, after electrodeposition. As expected, the highest values of RS/T were observed for coatings that introduced a further source of oxidized sulfur ions, like polystyrene sulfonate, Nafion and Dexstran sulfate, thereby contributing to the overall intensity of S 2p signals at ∼168 eV, together with the sulfonate groups of PH-1000. It should be noted that the signal linked to the sulfonic acid groups can be clearly detected also in the cases of HA and DP.
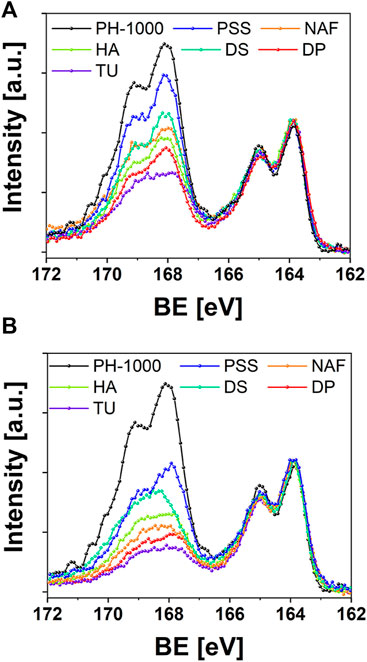
FIGURE 5. XPS analysis reporting the S 2p signals before and after electrodeposition of PEDOT/X at (A) Qdep = 25 mC cm−2 and (B) Qdep = 100 mC cm−2.
This is somehow counterintuitive, providing that both hyaluronic acid and dexamethasone phosphate should exhibit RS/T = 0, according to their chemical structure. In addition, the RS/T values for electrodeposited PSS and NAF were reported on the order of 0.4, whereas films of electrochemically prepared PEDOT doped with the monomeric anion TUDCA exhibited a lower RS/T value of 0.2 (S. Carli et al., 2019b; Carli et al., 2019a; Zotti et al., 2003). Thus, XPS analysis confirmed the presence of PH-1000 on the surface for films electrodeposited at the lower Qdep = 25 mC cm−2. A further decrease of RS/T values was observed after deposition at Qdep = 100 mC cm−2 (Figure 5B), nevertheless the S 2p signal linked to sulfonate groups of PH-1000 can be detected also at this highest deposition charge for all samples. It is interesting to observe that, at Qdep = 100 mC cm−2, a higher RS/T value of 0.6 was obtained for DP compared to the lower RS/T value of 0.4 obtained for TU. Considering that sulfur atoms are present only in TUDCA and not in dexamethasone phosphate, this can be explained by invoking the PH-1000 fingerprint still detected by XPS also for the highest deposition charge of 100 mC cm−2. In sum, XPS analysis corroborated the mixed layer scenario, which was suggested by EIS modelling. This was also confirmed by evaluating the thickness of PEDOT coatings before and after electrodeposition of PEDOT/X. As reported in Supplementary Figures S11–S13, the thickness of PH-1000 films was on the range of 90–100 nm and, surprisingly, it was not significantly affected by the electrodeposition of PEDOT/X. It has been reported that electrodeposition of polypyrrole on PH-1000 fibers yielded a thin layer of the former on the exposed surface, whose thickness scaled with the deposition charge (Esrafilzadeh et al., 2013). In this case the authors suggested that the electrodeposited film did not penetrate the underlaying PH-1000 coating. In addition, the deposition charge varied from 300 mC cm−2–2.4 C cm−2 and these values are much higher if compared to Qdep = 25 and 100 mC cm−2 used in this study. Thus, the fact that the thickness was not affected by the electrodeposition is consistent with a penetration of PEDOT/X inside the microstructure of PH-1000, thereby confirming the “mixed-layer” scenario outlined by EIS modelling and XPS analysis. Thus, the growth of electrodeposited PEDOT/X is expected to create an interpenetrated and mixed PH-1000|PEDOT/X layer.
Finally, OECT devices based on PH-1000 or mixed PH-1000|PEDOT/X were characterized by measuring transfer and output curves. The typical transfer characteristic of PEDOT/X and PH-1000 based OECTs are reported in Figure 6A. All devices are operated in depletion mode, which is typical for OECTs with p-type conductive polymer channel, as can be confirmed by the output traces reported in Supplementary Figures S14, S15 (see also the typical transfer and gm vs. VG reported in Supplementary Figure S16) (Bernards and Malliaras, 2007). In detail, as the gate bias increases cations are driven inside the OECT channel and the conductive polymer is progressively de-doped. Thus, the drop of the drain-source current ID finally leads the transistor to its off-state (Rivnay et al., 2018). It is evident the increase of the on-current at the drain (Ion) after the electrodeposition of PEDOT/X at Qdep = 25 mC cm−2, this finding being observed for all electrodeposited materials (see Table 1). Interestingly, at higher deposition charge (100 mC cm−2) only NAF exhibited a further increase of Ion, whereas a slight decrease of Ion values were observed for PSS, HA, DS and DP films, if compared to films deposited at Qdep = 25 mC cm−2. Moreover, in the only case of TU the value of Ion decreased after electrodepositing at 100 mC cm−2.
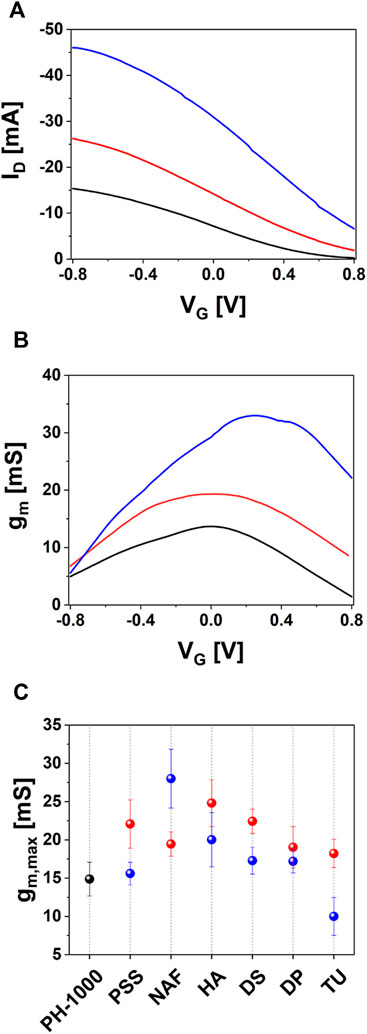
FIGURE 6. OECT characterization of devices based on PH-1000 (black) and NAF deposited at Qdep = 25 mC cm−2 (red) or Qdep = 100 mC cm−2 (blue): (A) representative transfer curves, (B) transconductance plotted with the drain voltage (VD) fixed at −0.8 V and (C) max transconductance gm,max extracted for OECTs based on PH-1000 (black dots) and PEDOT/NAF deposited at Qdep = 25 mC cm−2 (red dots) or Qdep = 100 mC cm−2 (blue dots) (mean ± SD from a set of three different devices).
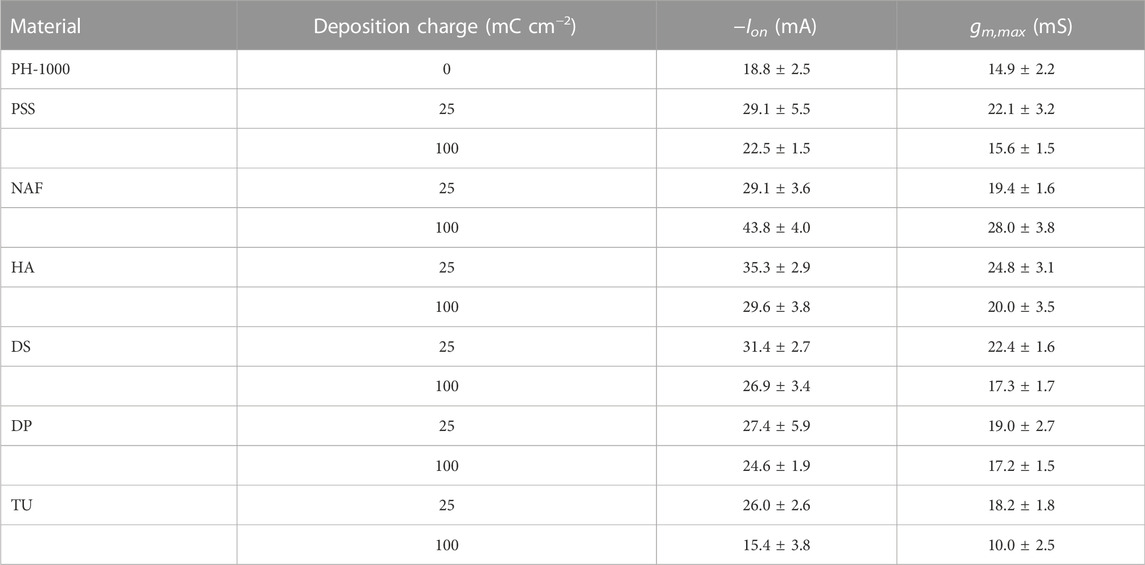
TABLE 1. Relevant data from OECT analysis based on PH-1000 and PEDOT/X deposited at Qdep = 25 mC cm−2 or Qdep = 100 mC cm−2. Data are presented as mean ± SD from a set of three different devices.
Transfer curves were analyzed to extract their respective transconductances
To further clarify these results, the source-drain current was monitored before and after application of a positive bias at the gate electrode. It is worth noting that by applying a positive gate bias, holes are extracted while cations are injected into the PEDOT OECT channel to counterbalance the negatively charged sulphonic acid groups in polystyrene sulfonate, Nafion or in TUDCA, in the case of PH-1000, PSS, NAF or TU, respectively. In analogy, cations from the electrolyte enter the conductive film to neutralize the unbalanced negative charges in hyaluronic acid, dextran sulphate, dexamethasone phosphate in HA, DS and DP, respectively. The typical transient current response is depicted in Figure 7A, which outlines a fast decay of the Id current that can be linked to the partial depletion of charge carriers in PEDOT, thereby yielding a decrease of its conductance (Bernards and Malliaras, 2007; Khodagholy et al., 2013). It was found that Id current decay versus time t, follows the modified Cottrel’s equation
where ID,eq is the equilibrium current, F is the Faraday’s constant, A is the area, C is the electrolyte concentration, D is the ion diffusion coefficient, which is referred to Na+ cation motion in this study (Montella, 2002).
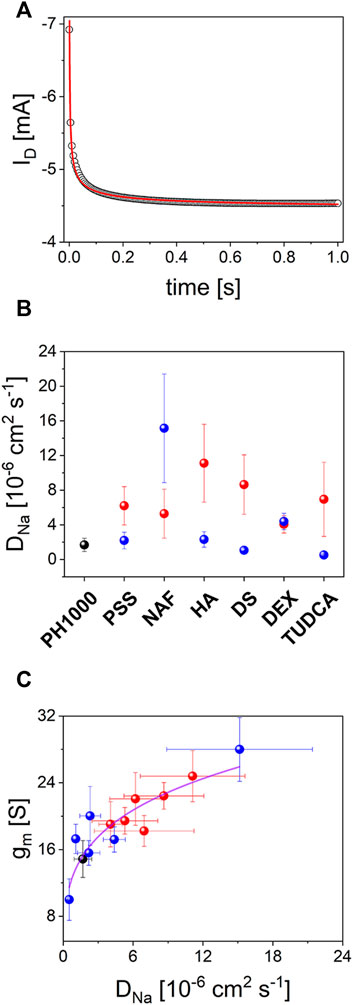
FIGURE 7. OECTs characterization: (A) typical drain current transient decay under a constant gate bias pulse (see experimental section for details), experimental data (black circles) were fitted according to Eq. 2 (red line); (B) DNa values extracted from drain current transient decay according to Eq. 2 for OECTs based on PH-1000 (black dots) and PEDOT/NAF deposited at Qdep = 25 mC cm−2 (red dots) or Qdep = 100 mC cm−2 (blue dots) (mean ± SD from a set of three different devices); (C) plot of gm,max vs. DNa.
This suggests that the current modulation in the OECTs during positive gate pulses, is kinetically controlled by the diffusion dynamics of Na+ cations through PEDOT channels. In other words, the rate of doping/dedoping processes of PEDOT are limited by Na+ transport. Thus, considering that all experiments were carried out keeping constant both the electrolyte concentration and the geometric area, it was possible to extract the Na+ diffusion coefficient (
This confirms that the transconductance of the OECT prepared in this study is strongly influenced by the rate of ions diffusion trough the porous structure of PEDOT. In particular, larger Na+ diffusion coefficients produced higher OECT transconductances and, more importantly, the nature of the dopant in the electrodeposited PEDOT/X played the most relevant role. It is known that gm,max scales with the geometric factor
where Na and h are the cation and the hole density, respectively, while
The present study clarifies the effects of electrodepositing PEDOT/X on a pre-formed PH-1000 layer obtained from a commercial formulation by drop casting. It was found that PEDOT/X tends to form an interpenetrated film thereby leading to a mixed-layer composite rather than a stacked layer film. Importantly, it was demonstrated the possibility to easily insert multifunctional dopants in PEDOT-based OECT while preserving the principal characteristic of native PH-1000 (i.e., the transconductance). In particular, results suggest that the most significant improvement of the transconductance is achieved when low electrodeposition charges are used (25 mC cm−2). Higher deposition charges (100 mC cm−2), which may result beneficial to increase the thickness of functionalized PEDOT/X, preserves the native OECTs transconductance but in some cases, like TU in this study, the OECT properties could be impaired, compared to the PH-1000 OECTs. It should be underlined that the dopants investigated in this study from one side encompass a wide range of possible applications, from biosensors up to OECT device engineered to deliver drugs. On the other hand, the proposed approach provides a convenient and versatile experimental tool to tune at the same time both the properties of the active materials and the other functions elicited by the counterion, thus expanding the portfolio of available PEDOT formulations. Finally, this study highlighted the role of the dopants in controlling the charge transport dynamics in PEDOT. In particular, it was found that the transconductance is strongly related to the diffusion rate of cations from the electrolyte to the inner sites of PEDOT.
The original contributions presented in the study are included in the article/Supplementary Material, further inquiries can be directed to the corresponding author.
Conceptualization: SC, FB, and LF; methodology: SC, FB, and LF; validation: SC, FB, and LF; resources: FB and LF; AFM analysis: MB; XPS analysis: MP; SEM/EDX analysis: AT and ML; OECT characterization: MD, AD, and MM; Data curation: SC, FB, and LF; writing—original draft preparation, SC; writing—review and editing: SC, MB, FB, and LF. All authors have read and agreed to the published version of the manuscript.
The authors declare that the research was conducted in the absence of any commercial or financial relationships that could be construed as a potential conflict of interest.
All claims expressed in this article are solely those of the authors and do not necessarily represent those of their affiliated organizations, or those of the publisher, the editors and the reviewers. Any product that may be evaluated in this article, or claim that may be made by its manufacturer, is not guaranteed or endorsed by the publisher.
The Supplementary Material for this article can be found online at: https://www.frontiersin.org/articles/10.3389/fmats.2022.1063763/full#supplementary-material
Barsoukov, E., and Macdonald, J. R. (2005). Impedance spectroscopy: Theory, experiment, and applications, impedance spectroscopy: Theory, experiment, and applications. New Jersey, United States: John Wiley & Sons. doi:10.1002/0471716243
Bernards, D. A., and Malliaras, G. G. (2007). Steady-state and transient behavior of organic electrochemical transistors. Adv. Funct. Mat. 17, 3538–3544. doi:10.1002/adfm.200601239
Bianchi, M., Carli, S., di Lauro, M., Prato, M., Murgia, M., Fadiga, L., et al. (2020). Scaling of capacitance of PEDOT:PSS: Volume: Vs. area. J. Mat. Chem. C 8, 11252–11262. doi:10.1039/d0tc00992j
Bobacka, J., Grzeszczuk, M., and Ivaska, A. (1992). Electrochemical study of poly(3-octylthiophene) film electrodes. Impedance of the polymer film semiconductor-electrolyte interface. Electrochim. Acta 37, 1759–1765. doi:10.1016/0013-4686(92)85078-Y
Bobacka, J., Lewenstam, A., and Ivaska, A. (2000). Electrochemical impedance spectroscopy of oxidized poly(3,4-ethylenedioxythiophene) film electrodes in aqueous solutions. J. Electroanal. Chem. 489, 17–27. doi:10.1016/S0022-0728(00)00206-0
Boehler, C., and Asplund, M. (2015). A detailed insight into drug delivery from PEDOT based on analytical methods: Effects and side effects. J. Biomed. Mat. Res. 103, 1200–1207. doi:10.1002/jbm.a.35252
Boehler, C., Carli, S., Fadiga, L., Stieglitz, T., and Asplund, M. (2020). Tutorial: Guidelines for standardized performance tests for electrodes intended for neural interfaces and bioelectronics. Nat. Protoc. 15, 3557–3578. doi:10.1038/s41596-020-0389-2
Boehler, C., Oberueber, F., Schlabach, S., Stieglitz, T., and Asplund, M. (2017). Long-Term stable adhesion for conducting polymers in biomedical applications: IrOx and nanostructured platinum solve the chronic challenge. ACS Appl. Mat. Interfaces 9, 189–197. doi:10.1021/acsami.6b13468
Carli, S., Bianchi, M., Zucchini, E., Di Lauro, M., Prato, M., Murgia, M., et al. (2019a). Electrodeposited PEDOT:nafion composite for neural recording and stimulation. Adv. Healthc. Mater 8, 1900765. doi:10.1002/adhm.201900765
Carli, S., Busatto, E., Caramori, S., Boaretto, R., Argazzi, R., Timpson, C. J., et al. (2013). Comparative evaluation of catalytic counter electrodes for Co(III)/(II) electron shuttles in regenerative photoelectrochemical cells. J. Phys. Chem. C 117, 5142–5153. doi:10.1021/jp312066n
Carli, S., di Lauro, M., Bianchi, M., Murgia, M., de Salvo, A., Prato, M., et al. (2020). Water-based PEDOT:nafion dispersion for organic bioelectronics. ACS Appl. Mat. Interfaces 12, 29807–29817. doi:10.1021/acsami.0c06538
Carli, S., Fioravanti, G., Armirotti, A., Ciarpella, F., Prato, M., Ottonello, G., et al. (2019b). A new drug delivery system based on tauroursodeoxycholic acid and PEDOT. Chem. - A Eur. J. 25, 2322–2329. doi:10.1002/chem.201805285
Castagnola, E., Carli, S., Vomero, M., Scarpellini, A., Prato, M., Goshi, N., et al. (2017). Multilayer poly(3, 4-ethylenedioxythiophene)-dexamethasone and poly(3, 4-ethylenedioxythiophene)-polystyrene sulfonate-carbon nanotubes coatings on glassy carbon microelectrode arrays for controlled drug release. Biointerphases 12, 031002. doi:10.1116/1.4993140
Castagnola, V., Bayon, C., Descamps, E., and Bergaud, C. (2014). Morphology and conductivity of PEDOT layers produced by different electrochemical routes. Synth. Mater. 189, 7–16. doi:10.1016/j.synthmet.2013.12.013
Cogan, S. F. (2008). Neural stimulation and recording electrodes. Annu. Rev. Biomed. Eng. 10, 275–309. doi:10.1146/annurev.bioeng.10.061807.160518
Coppedè, N., Villani, M., and Gentile, F. (2014). Diffusion driven selectivity in organic electrochemical transistors. Sci. Rep. 4, 4297. doi:10.1038/srep04297
Cui, X., and Martin, D. C. (2003). Electrochemical deposition and characterization of PEDOT:PSS on neural microelectrode arrays. Sens. Actuator B-Chem. 89, 92–102. doi:10.1016/S0925-4005(02)00448-3
Efimov, I., Winkels, S., and Schultze, J. W. (2001). EQCM study of electropolymerization and redox cycling of 3, 4-polyethylenedioxythiophene. J. Electroanal. Chem. 499, 169–175. doi:10.1016/S0022-0728(00)00358-2
Ellis, H., Vlachopoulos, N., Häggman, L., Perruchot, C., Jouini, M., Boschloo, G., et al. (2013). PEDOT counter electrodes for dye-sensitized solar cells prepared by aqueous micellar electrodeposition. Electrochim. Acta 107, 45–51. doi:10.1016/j.electacta.2013.06.005
Esrafilzadeh, D., Razal, J. M., Moulton, S. E., Stewart, E. M., and Wallace, G. G. (2013). Multifunctional conducting fibres with electrically controlled release of ciprofloxacin. J. Control. Release 169, 313–320. doi:10.1016/j.jconrel.2013.01.022
Gambardella, A., Berni, M., Russo, A., and Bianchi, M. (2018). A comparative study of the growth dynamics of zirconia thin films deposited by ionized jet deposition onto different substrates. Surf. Coat. Technol. 337, 306–312. doi:10.1016/J.SURFCOAT.2018.01.026
Gerasimov, J. Y., Gabrielsson, R., Forchheimer, R., Stavrinidou, E., Simon, D. T., Berggren, M., et al. (2019). An evolvable organic electrochemical transistor for neuromorphic applications. Adv. Sci. 6, 1801339–1801348. doi:10.1002/advs.201801339
Gerasimov, J. Y., Zhao, D., Sultana, A., Abrahamsson, T., Han, S., Bliman, D., et al. (2021). A biomimetic evolvable organic electrochemical transistor. Adv. Electron. Mat. 7, 2001126. doi:10.1002/aelm.202001126
Guex, A. A., Vachicouras, N., Hight, A. E., Brown, M. C., Lee, D. J., and Lacour, S. P. (2015). Conducting polymer electrodes for auditory brainstem implants. J. Mat. Chem. B 3, 5021–5027. doi:10.1039/c5tb00099h
Hai, W., Goda, T., Takeuchi, H., Yamaoka, S., Horiguchi, Y., Matsumoto, A., et al. (2018). Human influenza virus detection using sialyllactose-functionalized organic electrochemical transistors. Sens. Actuator B-Chem. 260, 635–641. doi:10.1016/j.snb.2018.01.081
Hall, M., and Ricketts, C. R. (1952). The use of dextran sulphate as a blood anticoagulant in biological research. J. Clin. Pathol. 5, 366. doi:10.1136/jcp.5.4.366
Harman, D. G., Gorkin, R., Stevens, L., Thompson, B., Wagner, K., Weng, B., et al. (2015). Poly(3, 4-ethylenedioxythiophene):dextran sulfate (PEDOT:DS) – a highly processable conductive organic biopolymer. Acta Biomat 14, 33–42. doi:10.1016/j.actbio.2014.11.049
Harris, A. R., Molino, P. J., Kapsa, R. M. I., Clark, G. M., Paolini, A. G., and Wallace, G. G. (2016). Effective area and charge density of dextran sulphate doped PEDOT modified electrodes. Synth. Mater. 220, 394–401. doi:10.1016/j.synthmet.2016.07.010
Harris, A. R., Molino, P. J., Kapsa, R. M. I., Clark, G. M., Paolini, A. G., and Wallace, G. G. (2015). Optical and electrochemical methods for determining the effective area and charge density of conducting polymer modified electrodes for neural stimulation. Anal. Chem. 87, 738–746. doi:10.1021/ac503733s
Harris, A. R., Morgan, S. J., Chen, J., Kapsa, R. M. I., Wallace, G. G., and Paolini, A. G. (2013). Conducting polymer coated neural recording electrodes. J. Neural Eng. 10, 016004. doi:10.1088/1741-2560/10/1/016004
Hofmann, A. I., Ida, O., Kim, Y., Fauth, S., Craighero, M., Yoon, M., et al. (2020). All-polymer conducting fibers and 3D prints via melt processing and templated polymerization. ACS Appl. Mat. Interfaces 12, 8713–8721. doi:10.1021/acsami.9b20615
Inal, S., Rivnay, J., Suiu, A. O., Malliaras, G. G., and McCulloch, I. (2018). Conjugated polymers in bioelectronics. Acc. Chem. Res. 51, 1368–1376. doi:10.1021/acs.accounts.7b00624
Isaksson, J., Kjäll, P., Nilsson, D., Robinson, N., Berggren, M., and Richter-Dahlfors, A. (2007). Electronic control of Ca2+ signalling in neuronal cells using an organic electronic ion pump. Nat. Mat. 6, 673–679. doi:10.1038/nmat1963
Ji, J., Li, M., Chen, Z., Wang, H., Jiang, X., Zhuo, K., et al. (2019a). In situ fabrication of organic electrochemical transistors on a microfluidic chip. Nano Res. 12, 1943–1951. doi:10.1007/s12274-019-2462-0
Ji, J., Zhu, X., Han, D., Li, M., Zhang, Q., Shu, Y., et al. (2019b). AC electrodeposition of PEDOT films in protic ionic liquids for long-term stable organic electrochemical transistors. Molecules 24, 4105. doi:10.3390/molecules24224105
Kayinamura, Y. P., Ovadia, M., Zavitz, D., and Rubinson, J. F. (2010). Investigation of near ohmic behavior for poly(3, 4-ethylenedioxythiophene): A model consistent with systematic variations in polymerization conditions. ACS Appl. Mat. Interfaces 2, 2653–2662. doi:10.1021/am100480s
Khodagholy, D., Rivnay, J., Sessolo, M., Gurfinkel, M., Leleux, P., Jimison, L. H., et al. (2013). High transconductance organic electrochemical transistors. Nat. Commun. 4, 2133–2136. doi:10.1038/ncomms3133
Kittlesen, G. P., White, H. S., and Wrighton, M. S. (1984). Chemical derivatization of microelectrode arrays by oxidation of pyrrole and N-methylpyrrole: Fabrication of molecule-based electronic devices. J. Am. Chem. Soc. 106, 7389–7396. doi:10.1021/ja00336a016
Kleber, C., Stieglitz, T., Asplund, M., Hofmann, U. G., Boehler, C., Martini, N., et al. (2017). Actively controlled release of Dexamethasone from neural microelectrodes in a chronic in vivo study. Biomaterials 129, 176–187. doi:10.1016/j.biomaterials.2017.03.019
Kogan, G., Šoltés, L., Stern, R., Schiller, J., and Mendichi, R. (2008). Hyaluronic acid: Its function and degradation in in vivo systems. Stud. Nat. Prod. Chem. 34, 789–882. doi:10.1016/S1572-5995(08)80035-X
Krim, J., and Palasantzas, G. (1995). Experimental observations of self-affine scaling and kinetic roughening at sub-micron lengthscales. Int. J. Mod. Phys. B 9, 599–632. doi:10.1142/S0217979295000239
Lövenich, W. (2014). PEDOT-properties and applications. Polym. Sci. Ser. C 56, 135–143. doi:10.1134/S1811238214010068
Mantione, D., del Agua, I., Schaafsma, W., Diez-Garcia, J., Castro, B., Sardon, H., et al. (2016). Poly(3, 4-ethylenedioxythiophene):GlycosAminoGlycan aqueous dispersions: Toward electrically conductive bioactive materials for neural interfaces. Macromol. Biosci. 16, 1227–1238. doi:10.1002/mabi.201600059
Montella, C. (2002). Discussion of the potential step method for the determination of the diffusion coefficients of guest species in host materials. J. Electroanal. Chem. 518, 61–83. doi:10.1016/s0022-0728(01)00691-x
Nakade, S., Kambe, S., Kitamura, T., Wada, Y., and Yanagida, S. (2001). Effects of lithium ion density on electron transport in nanoporous TiO2 electrodes. J. Phys. Chem. B 105, 9150–9152. doi:10.1021/jp011375p
Ouyang, J. (2013). Secondary doping” methods to significantly enhance the conductivity of PEDOT:PSS for its application as transparent electrode of optoelectronic devices. Displays 34, 423–436. doi:10.1016/j.displa.2013.08.007
Ouyang, J., Xu, Q., Chu, C. W., Yang, Y., Li, G., and Shinar, J. (2004). On the mechanism of conductivity enhancement in poly(3, 4- ethylenedioxythiophene):poly(styrene sulfonate) film through solvent treatment. Polym. Guildf. 45, 8443–8450. doi:10.1016/j.polymer.2004.10.001
Randriamahazaka, H., Noël, V., and Chevrot, C. (1999). Nucleation and growth of poly(3, 4-ethylenedioxythiophene) in acetonitrile on platinum under potentiostatic conditions. J. Electroanal. Chem. 472, 103–111. doi:10.1016/S0022-0728(99)00258-2
Rivnay, J., Inal, S., Salleo, A., Owens, R. M., Berggren, M., and Malliaras, G. G. (2018). Organic electrochemical transistors. Nat. Rev. Mat. 3, 17086. doi:10.1038/natrevmats.2017.86
Roncali, J. (1992). Conjugated poly(thiophenes): Synthesis, functionalization, and applications. Chem. Rev. 2, 711–738. doi:10.1021/cr00012a009
Sakmeche, N., Aeiyach, S., Aaron, J. J., Jouini, M., Lacroix, J. C., and Lacaze, P. C. (1999). Improvement of the electrosynthesis and physicochemical properties of poly(3, 4-ethylenedioxythiophene) using a sodium dodecyl sulfate micellar aqueous medium. Langmuir 15, 2566–2574. doi:10.1021/la980909j
Shi, H., Liu, C., Jiang, Q., and Xu, J. (2015). Effective approaches to improve the electrical conductivity of PEDOT:PSS: A review. Adv. Electron. Mat. 1, 1500017–1500116. doi:10.1002/aelm.201500017
Soto, J. P., Díaz, F. R., del Valle, M. A., Vélez, J. H., and East, G. A. (2008). Nucleation and growth mechanisms during electropolymerization of substituted 3-alkylthiophenes. Appl. Surf. Sci. 254, 3489–3496. doi:10.1016/j.apsusc.2007.11.052
Spanninga, S. A., Martin, D. C., and Chen, Z. (2009). X-ray photoelectron spectroscopy study of counterion incorporation in poly(3, 4-ethylenedioxythiophene). J. Phys. Chem. C 113, 5585–5592. doi:10.1021/jp811282f
Stevens, L., Harman, D., Gilmore, K., het Panhuis, M., and Wallace, G. (2015). A comparison of chemical and electrochemical synthesis of PEDOT:dextran sulphate for bio-application. MRS Proc. 1717, Mrsf14-1717. doi:10.1557/opl.2015.19
Tekoglu, S., Wielend, D., Scharber, M. C., Sariciftci, N. S., and Yumusak, C. (2019). Conducting polymer-based biocomposites using deoxyribonucleic acid (DNA) as counterion. Adv. Mat. Technol. 5, 1900699. doi:10.1002/admt.201900699
Xia, J., Masaki, N., Jiang, K., and Yanagida, S. (2007). The influence of doping ions on poly(3, 4-ethylenedioxythiophene) as a counter electrode of a dye-sensitized solar cell. J. Mat. Chem. 17, 2845–2850. doi:10.1039/b703062b
Yadav, R., and Fedkiw, P. S. (2012). Analysis of EIS technique and nafion 117 conductivity as a function of temperature and relative humidity. J. Electrochem. Soc. 159, 340–346. doi:10.1149/2.104203jes
Zotti, G., Zecchin, S., Schiavon, G., Louwet, F., Groenendaal, L., Crispin, X., et al. (2003). Electrochemical and XPS studies toward the role of monomeric and polymeric sulfonate counterions in the synthesis, composition, and properties of poly(3, 4-ethylenedioxythiophene). Macromolecules 36, 3337–3344. doi:10.1021/ma021715k
Keywords: conductive polymers, PEDOT, organic electrochemical transistors (OECTs), bioelectronics, electrodeposition
Citation: Carli S, Bianchi M, Di Lauro M, Prato M, Toma A, Leoncini M, De Salvo A, Murgia M, Fadiga L and Biscarini F (2022) Multifunctionally-doped PEDOT for organic electrochemical transistors. Front. Mater. 9:1063763. doi: 10.3389/fmats.2022.1063763
Received: 07 October 2022; Accepted: 08 December 2022;
Published: 19 December 2022.
Edited by:
Jin Wu, Sun Yat-sen University, ChinaReviewed by:
Asit Patra, National Physical Laboratory (CSIR), IndiaCopyright © 2022 Carli, Bianchi, Di Lauro, Prato, Toma, Leoncini, De Salvo, Murgia, Fadiga and Biscarini. This is an open-access article distributed under the terms of the Creative Commons Attribution License (CC BY). The use, distribution or reproduction in other forums is permitted, provided the original author(s) and the copyright owner(s) are credited and that the original publication in this journal is cited, in accordance with accepted academic practice. No use, distribution or reproduction is permitted which does not comply with these terms.
*Correspondence: Stefano Carli, Y3Jsc2ZuQHVuaWZlLml0
†These authors have contributed equally to this work
Disclaimer: All claims expressed in this article are solely those of the authors and do not necessarily represent those of their affiliated organizations, or those of the publisher, the editors and the reviewers. Any product that may be evaluated in this article or claim that may be made by its manufacturer is not guaranteed or endorsed by the publisher.
Research integrity at Frontiers
Learn more about the work of our research integrity team to safeguard the quality of each article we publish.