 Jianqiao Yu
 Dawei Liu1,2
 Zhigang Zhang
94% of researchers rate our articles as excellent or good
Learn more about the work of our research integrity team to safeguard the quality of each article we publish.
Find out more
ORIGINAL RESEARCH article
Front. Mater., 21 October 2022
Sec. Structural Materials
Volume 9 - 2022 | https://doi.org/10.3389/fmats.2022.1060294
This article is part of the Research TopicAdvanced Concretes and Their Structural Applications-Volume IIView all 15 articles
Utilizing recycled aggregate concrete (RAC) for cyclic usage in building materials is one of the most feasible methods for reducing the demand for natural aggregates in the construction sector and disposing of construction and demolition trash in landfills. Previous research has demonstrated that the weak freeze-thaw (F-T) resistance of RAC poses a significant threat to the safety of RAC structures in severe cold regions. Therefore, this paper explores the influence of ceramic waste powder (CWP) at various replacement rates on the freeze-thaw resilience of RAC. In this experiment, six groups of CWP doping ratios of 0%, 10%, 20%, 30%, 40, and 50% were designed. Before the F-T cycling test, each group of specimens’ basic mechanical and physical performance data was measured throughout the regular curing age. At the conclusion of each F-T cycle, the durability performance of RAC was tested using the impact-echo method and compressive strength test. To predict the lifetime of RAC mixtures, a Grey-Markov model was created. It was found that the impact-echo method is more appropriate for assessing the durability of RAC in a freeze-thaw condition. The RAC’s F-T resistance is greatest when the CWP content is 20%. The Grey-Markov model has a high degree of predictive accuracy, effectively reflecting the relationship between RAC durability and F-T cycles, and has wide practical applications.
The construction industry is one of the primary drivers of global development in past decades. However, construction is not an environmentally friendly activity as the materials used led to the intense demand for natural resources consuming. Recycled aggregate concrete (RAC) is a kind of eco-friendly concrete manufactured by substituting natural aggregates partially or entirely with recycled aggregates which derived from waste concrete blocks in building waste after mechanical crushing, cleaning, and grading. Notably, the use of RAC not only solves the environmental issues produced by construction waste dumps, but also enables the recycling of construction waste, which has significant ecological, economic, and social relevance (Li et al., 2020; Amadi et al., 2022).
The recycled aggregates has a relatively lower apparent density, higher water absorption and crushing value as compared with natural aggregate, however, they can be blended with natural aggregates to satisfy the needed criteria for workability and strength of RAC. In pratical field, RAC has been applied in road engineering such as the Diepmannsbach Bridge in Germany and the US-41 Route in the United States (Nwakaire et al., 2020). Nevertheless, the long-term property of RAC has certain drawbacks, RAC confronts more complex durability issues in the harsh environment than that of conventional concrete, especially in severe cold regions, the micro-cracks created in recycled aggregate as a result of damage buildup during manufacture provide the preferable paths for moisture to infiltrate into the interior of RAC, and making RAC more sensitive to freeze-thaw (F-T) degradation.
In previous studies (Bennett et al., 2022; Wang et al., 2022), it has been demonstrated that mixing some supplementary cementitious materials (SCMs) can improve the F-T resistance properties of RAC. Normally, the SCMs can fill the microscopic pores within cement matrix, and thus enhance the compactness of RAC, moreover, the pozzolanic properties of SCMs can produce dense C-S-H gels, which is expected to improve the durability of RAC.
Among the various SCMs, ceramic waste powder (CWP) can absorb water and has a good filling effect (Awoyera et al., 2017) as it was used in concrete. CWP is a kind of construction waste, which is obtained from the crushing process of ceramic waste. As a residual waste, ceramic waste is often discarded at the landfill as a non-recyclable item, which is not only a waste of land resources, but also contaminates soil and water bodies. Actually, if the ceramic waste is ground to a specific fineness, under a damp/alkaline environment, the ceramic powder can chemically react with Ca(OH)2 to form C-S-H gels. Therefore, CWP could be a promising SCM to be utilized in RAC. Until now, there have been no particular studies to demonstrate if CWP can improve RAC in F-T conditions, and few research on CWP as a substitute for recycled fine aggregates in RAC were investigated.
It is well known that compressive strength is often used as the main way to measure the quality of concrete. However, when concrete is eroded by the harsh environment or damaged by catastrophic factors, the compressive strength of concrete is merely an indirect assessment and does not accurately reflect the concrete’s performance in the actual structures. Based on technique specifications (CECS 03-2007, 2007; GB/T 50107-2010, 2011), when there is uncertainty regarding the compressive strength test value of the RAC specimen, the non-destructive method can be utilized to evaluate the qualities of concrete under applicable requirements. In recent years, the conventional impact-echo method has attracted extensive attention. It is a quick and reasonably cost-effective method of on-site examination by using impact elastic waves. Among all the impact elastic waves, the attenuation of longitudinal wave amplitude is positively connected with the direction of propagation of normal stress, indicating that longitudinal waves create the most significant and easiest-to-receive vibrations. Hence, longitudinal wave velocity is commonly employed to measure the strength and dynamic elastic modulus of concrete. Nevertheless, when concrete is in F-T conditions, the ice creates a “false” increase in wave velocity and strength, making the durability of concrete be underestimated. Unfortunately, the current research on the correlations between wave velocity and F-T resistance of RAC is limited, especially by the impact-echo method.
Over the past decade, numerous results about durability tests on concrete indicate that environmental erosion is a gradual process for concrete. According to the previous literature findings (Zhang et al., 2020; Wang et al., 2021; Zhang et al., 2022), the relevant durability evaluation parameters of some concrete specimens still do not match the failure requirements even underwent hundreds of F-T cycles in the laboratory test condition. To ensure the durability of CWP-RAC in the F-T conditions, it is required to predict its remaining service life using mathematical models. In this regard, a Grey model can be constructed to predict the durability life of RAC (Qu et al., 2021). The Grey model has the properties of reducing sequence randomness and detecting the pattern of sample data, enabling accurate description and efficient monitoring of original data’s evolving pattern. In the Grey modeling procedure, irregularly moving data are typically discarded, and the sample’s overall trend is considered. This method will produce an impact on prediction accuracy because it disregards interference data. Fortunately, the most significant characteristic of the Markov chain is its capacity to examine data that fluctuates irregularly (Zhou et al., 2022). The Grey-Markov model combing Markov chain and Grey model can effectively improve the accuracy of predictions.
In this paper, it investigated the influence of various CWP contents on the impact echo propagation properties of RAC under F-T conditions, and produced performance degradation curves for compressive strength and relative dynamic elastic modulus (derived from the data collected using the impact-echo method). On this basis, a Grey-Markov model is used to predict the life of RAC. The results is expected to provide theoretical support for engineering applications.
In this study, the ingredients in the production of RAC include ordinary Portland cement of P.O 42.5 grade, pulverized ceramic waste powder (CWP), water, natural coarse aggregate (NCA), natural fine aggregate (NFA), recycled coarse aggregate (RCA), and recycled fine aggregate (RFA). The chemical compositions and physical properties of these raw materials are listed in Table 1. The particle size of CWP was below 45 microns. Even though recycled aggregates have high water absorption and low bulk density, the overall difference in physical properties between recycled aggregates and natural aggregates is not evident. Table 2 lists the six RAC mix proportions used in this study. Six RAC mixtures were made in accordance with the technical standard for recycled concrete structures (JGJ/T 443-2018, 2018) by substituting RFA at equal volume weight with varying volume contents of CWP. The CWP-0 was used as the control group, and the corresponding formulated strength grade was C30. The numbers in the mixture represent the replacement-ratio of RFA to CWP.

TABLE 1. Raw materials used for RAC mixes.
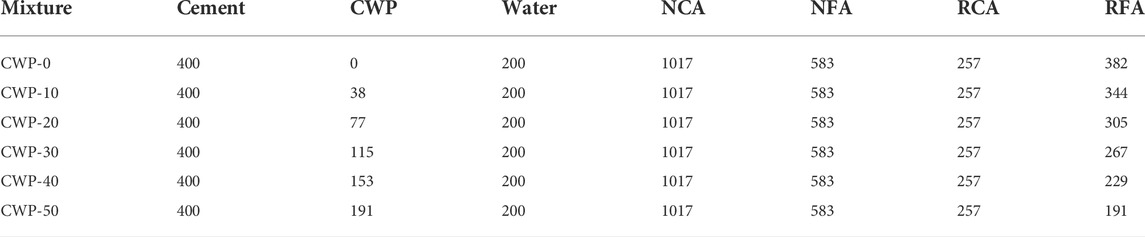
TABLE 2. Mixed proportions of RAC (kg/m3).
The RAC mixtures were made using with a cube-shaped plastic trial mold with a size of 100 mm × 100 mm × 100 mm. During mixing process, all dry solid ingredients were initially mixed for 60 s. Then the water were added and mixed for another 120 s until the paste reached a homogeneous status. In final, the RAC paste was poured into the molds and stored at ambient temperature (around 25°C) with plastic films. After 24 h, the RAC specimens were demolded and cured under temperature of 20 ± 2°C and relative humidity of 95% until test.
Figure 1 depicts the principle of the impact-echo method. The basic premise is to deliver a temporary impact to excitation source on concrete surface, and the resulting impact elastic wave propagates along the interior of concrete and produces reflected waves when it contacts internal defects such as pores, honeycomb, delamination, etc. Then, the reflected waves are sent back to the surface of concrete and received by a receiver situated close to excitation source. Meanwhile, it is possible to convert the fluctuating signals received by receiver into amplitude spectrum. The primary peak in the amplitude spectrum is caused by the interface where the wave impedance changes. Finally, according to the peak frequency (f), the impact elastic wave velocity can be determined using Eq. 1:
where V is the impact elastic wave velocity (m/s), h is the height of the specimen (m), and f is the peak frequency (Hz). A form factor γ is added because the specimen’s form influences the measurement of wave velocity. According to experiments conducted by Krzemień et al. (Krzemień and Hager, 2015), γ can be 0.9 for the same cubic specimen size, and the impact elastic wave velocity is then rectified to a one-dimensional wave velocity.
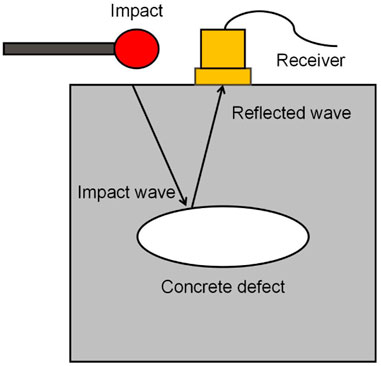
FIGURE 1. Principle of impact-echo method.
In this paper, the testing apparatus utilizes the impact echo tester, which comprises a 12.5 mm diameter impact hammer, receiving sensor, and signals acquisition system. When the excitation source is subjected to a impact, the longitudinal, shear, and Rayleigh waves will propagate in all directions. The primary detection basis of the impact-echo method is the longitudinal wave in impact elastic wave, as the vibration direction of the excitation source and the longitudinal wave propagation direction are identical, resulting in the quickest longitudinal wave propagation speed. During on-site test, the test surface should be smoothed using an abrasive wheel to ensure that the excitation source and measurement point surface are well linked. Four excitation sources are positioned diagonally along the end face at a distance of 30 mm from the receiver, as depicted in Figure 2. Each excitation source is impacted twice at least to ensure that the receiver receives two correct data. For the specimens that have reached the relevant curing age (7 days, 28 days), three specimens of each group will be tested, 24 wave velocities will be obtained for each group, and the average value will be used as the group’s final wave velocity.
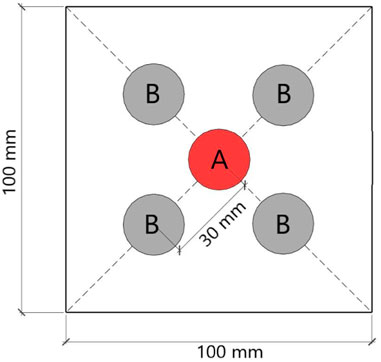
FIGURE 2. The arrangement of excitation sources. Point (A) is the receiver. Point (B) is the excitation source.
According to the specifications of China codes (GB/T 50081-2019, 2019), the compressive strength test was conducted. During the test, the load was continually applied at a loading rate of 0.8 MPa/s without impact until the sample was damaged to the point of failure. When the specimens of each mix proportion are cured for 7 days and 28 days, the group’s compressive strength is determined by averaging the values of three specimens. During data processing, the compressive strength findings were calculated using Eq. 2, and translated to standard specimen strength using a conversion factor of 0.95.
Where, fc is the cubic compressive strength (MPa), Fmax is the maximal force required to destroy the specimen (N), A is the compressive area (mm2).
Figure 3 depicts the F-T cycle regime for this test, which consisted of 300 cycles. Prior to freez-thaw test, the RAC specimens were cured until 28 days. Each F-T cycle lasts 4 h, consisting of 2 h of freezing and 2 h of thawing. During F-T conditions, the central of the specimen underwent a minimum temperature of −18 ± 2°C and a maximum temperature of 5 ± 2°C. As durability-related data, the impact elastic wave velocity and compressive strength of each RAC mixture were tested every 25 cycles.
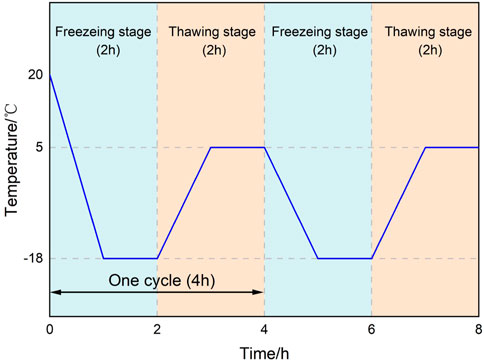
FIGURE 3. Freeze-thaw scheme.
The so-called durability of concrete refers to the ability of concrete to sustain its work performance under predictable working conditions. Since the wave velocity of the impact elastic wave has a positive correlation with the physical and mechanical properties of concrete materials, such as density, Poisson’s ratio, and dynamic elastic modulus, thus the wave velocity can be a non-destructive test method to determine the durability evaluation parameters for the F-T test. According to the relevant specification for durability test design (GB/T 50082-2009, 2009), the relative dynamic modulus of elasticity (RDME) Er can be used as an assessment parameter for F-T test. Wichtmann et al. (Wichtmann and Triantafyllidis, 2010) concluded that the relationship between wave velocity and dynamic elastic modulus, as shown in Eq. 3:
where Ed is the dynamic elastic modulus (MPa), ρ is the density of concrete (kg/m3).
The formula for calculating the RDME can be calculated from Eq. 4:
where Edn, Ed0 denote the dynamic elastic modulus after n test cycles and the initial stage, respectively. Vn, v0 denote the impact elastic wave velocity measured after n test cycles and the initial stage, respectively. When Er ≤ 60%, it indicates that the specimen meets the threshold for durability failure.
In addition, the relevant specification also provides for the compressive strength damage factor can be used as a supplementary criterion to determine whether concrete durability is compromised. The calculation formula for the compressive strength damage factor is presented in Eq. 5:
where Kf is the compressive strength damage factor, fcn、fc0 denote the compressive strength after n test cycles and the initial stage, respectively. When Kf ≤ 75%, it indicates that the specimen meets the threshold for durability failure.
From Eq. 4 and (Eq. 5), the two durability damage deterioration indices can be obtained, which can be used to evaluate the F-T durability of concrete from both non-destructive and destructive perspectives, respectively. For the current test design, it is crucial to normalize the aforementioned two durability parameters so that the disparities between the two degradation indicators may be compared more objectively throughout the same test cycle. Hence, based on the durability failure thresholds of Er and Kf, the RDME evaluation parameter ξ1 and compressive strength evaluation parameter ξ2 were established (Eq. 6 and Eq. 7).
When either ξ1 or ξ2 reaches 0, it is evident that the specimen has met the durability failure criterion, and the test of the group must be terminated.
Figure 4 plots the impact elastic wave velocity of RAC mixtures. As is evident from Figure 4, the wave velocity of all RAC specimen groups combined with CWP was greater than that of CWP-0 after 7 days of curing. Since the velocity of the impact elastic wave is directly proportional to the degree of concrete compactness, the wave velocity can be utilized to determine the degree of concrete curing. Shokouhi et al. (2017) reported that the propagation path of elastic waves at the concrete defect interface will increase and the measured wave velocity must inevitably drop as the wave impedance rate of air is significantly lower than that of concrete. The increase in early wave velocity of CWP-RAC mixtures is mostly attributable to the pozzolanic activity and the physical filling effect of CWP.
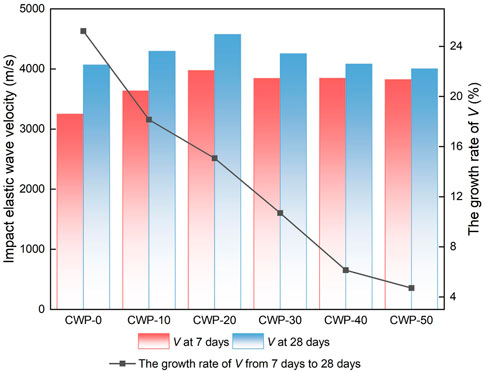
FIGURE 4. Impact elastic wave velocity of RAC mixtures.
At 28 days curing age, the final wave velocity of CWP-RACs exhibits an increasing and then declining trend with increasing CWP contents. The CWP-20 had the highest wave velocity of 4573 m/s, which was 12.44% greater than that of control group (CWP-0). However, when the CWP doping was increased to 50%, the wave velocity was only 4002 m/s, which was slower than that of control group. This implies that a specific amount of CWP can effectively compensate for the high porosity of recycled aggregates when added to the mixture. When the CWP doping level reaches 20%, the tiny pores within the RAC are well-filled and the larger pores will not expand significantly. However, when CWP doping exceeds 20%, due to the excessive substitution of RFA, the larger pores will enlarge, resulting in a reduction in RAC compactness, even though the tiny pores are well filled. In addition, the growth rate curve of wave velocity from 7 days to 28 days of curing age reveals that the capability to enhance RAC wave velocity declines gradually as the CWP doping rises. The CWP-40 and CWP-50 only raised the wave velocity by 6.14% and 4.71%, respectively, which was much less than that of control group (increased by 25.22% for CWP-0). The results indicate that an excess amount of CWP is not conducive to maintaining the pozzolanic reaction with cement hydration product, and enhancing the compactness of the RAC in the later stage of curing.
Figure 5 illustrates the compressive strength of RAC mixtures at 7 days–28 days curing age. It shows that the compressive strength of CWP-RAC mixtures is basically consistent with the performance of impact elastic wave velocity: the higher the wave velocity, the greater the strength. Compared to the control group, the compressive strength of the specimens at 7 days in each of the CWP-doped groups was enhanced to varying degrees, which is consistent with the conclusions reached in the study by Chen et al. (2022). This is mainly because that CWP has a higher water absorption rate and a rougher particle surface than that of RFA. The moisture content in the pores is high during the early stages of RAC formation, and the cement hydration hardening process has not yet been completed, while the water absorption of CWP is greater than that of RFA, which reduces the actual water-cement ratio around cement-based material involved in the hydration reaction and aids in the development of RAC strength. On the other hand, CWP, which is obtained by artificial crushing, has a rougher and more angular surface than RFA, which likewise enhances the adhesion between aggregate and cement paste.
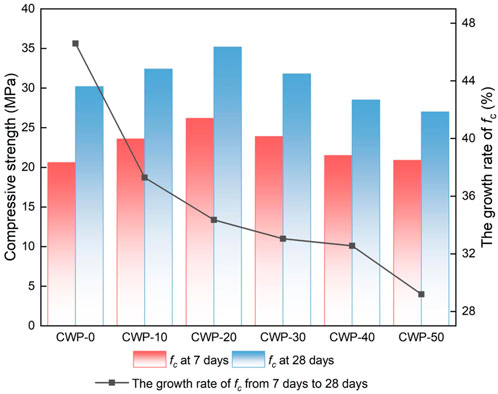
FIGURE 5. Compressive strength of RAC mixtures.
According to the 28 days compressive strength data, the compressive strength of each set of specimens increases and subsequently drops as CWP doping increases. Specifically, the compressive strength of CWP-20 at 28 days is 35.2 MPa, which is the greatest value among all specimens. This result is 16.56% more than that of CWP-0’s. Peng et al. (2020) reported that because CWP has a smaller void fraction than recycled aggregates, it has a higher pressure-bearing capability than recycled aggregates. Therefore, the compressive strength of RAC was greatly enhanced by substituting CWP for a portion of RFA. It should be noted that, the compressive strength of CWP-40 and CWP-50 at 28 days were lower than that of control group. This implies that there is a residual unhydrated component of excess CWP following the secondary hydration reaction with Ca(OH)2, which leads to bonding issues at the interface of the aggregate and cement. As a result, the specimen is easily damaged during the compression process, and the compressive strength of RAC decreases gradually when CWP content is greater than 20%. Similarly, as demonstrated by the growth curve of compressive strength from 7 days to 28 days of curing age, in the late curing stage, the compressive strength increases of RAC mixed with CWP is not as great as that of the control group. This is because that CWP reacts rapidly with the hydration products in RAC during the early stage of curing, hence realizing early strength. As the curing age increases, the effect of CWP on the augmentation of compressive strength of RAC decreases due to the gradual reduction of the active substance on the surface of the cement particles (Zhang et al., 2021).
Figures 6A–F presents the time-changing curves of the durability evaluation parameters of RAC mixtures, which was calculated from the impact elastic wave velocity and compressive strength after the samples underwent the increasing numbers of F-T cycles. As shown in Figure 6, all ξ1 values of RAC mixtures dropped as the number of F-T cycles increased, indicating that the degree of RDME degradation of specimens increased as the number of F-T cycles grew. This is due to the fact that temperature fluctuations produce non-uniform thermal displacement between the cement paste and aggregate, and the freezing and expansion of water in the pore structure causes increased hydrostatic and osmotic pressures. The aforementioned conditions can contribute to a rise in cracks, porosity, and other defects in RAC, reducing the compactness of the specimen and thus leading to a decrease in RDME. The comparison reveals that CWP-0 has a ξ1 value of 40.63% after 300 F-T cycles. The CWP-20 has the best F-T resistance with a ξ1 value of 70.58% after 300 F-T cycles, which is significantly greater than that of control group. The reason is that CWP has lower water content and void fraction than RFA, which caused the relatively lower volume expansion rate of RAC specimens during F-T cycling to that of control group specimens, and effectively limiting the propagation of cracks and lateral deformation in the micro-structure of RAC due to F-T cycling, thereby reducing the degradation of RDME in a F-T environment. As CWP content increased, the ξ1 curve degradation trend of CWP-30, CWP-40, and CWP-50 grew progressively. In particular, CWP-40 and CWP-50 approach durability failure after 300 and 225 cycles, respectively. This implies that the addition of an excessive amount of CWP is not conducive to the hydration of the RAC, and will result in the creation of additional pores. Under F-T conditions, the water in these pores condenses into solid ice, and the volume increases, resulting in expansion stress that reduces the durability performance of RAC.
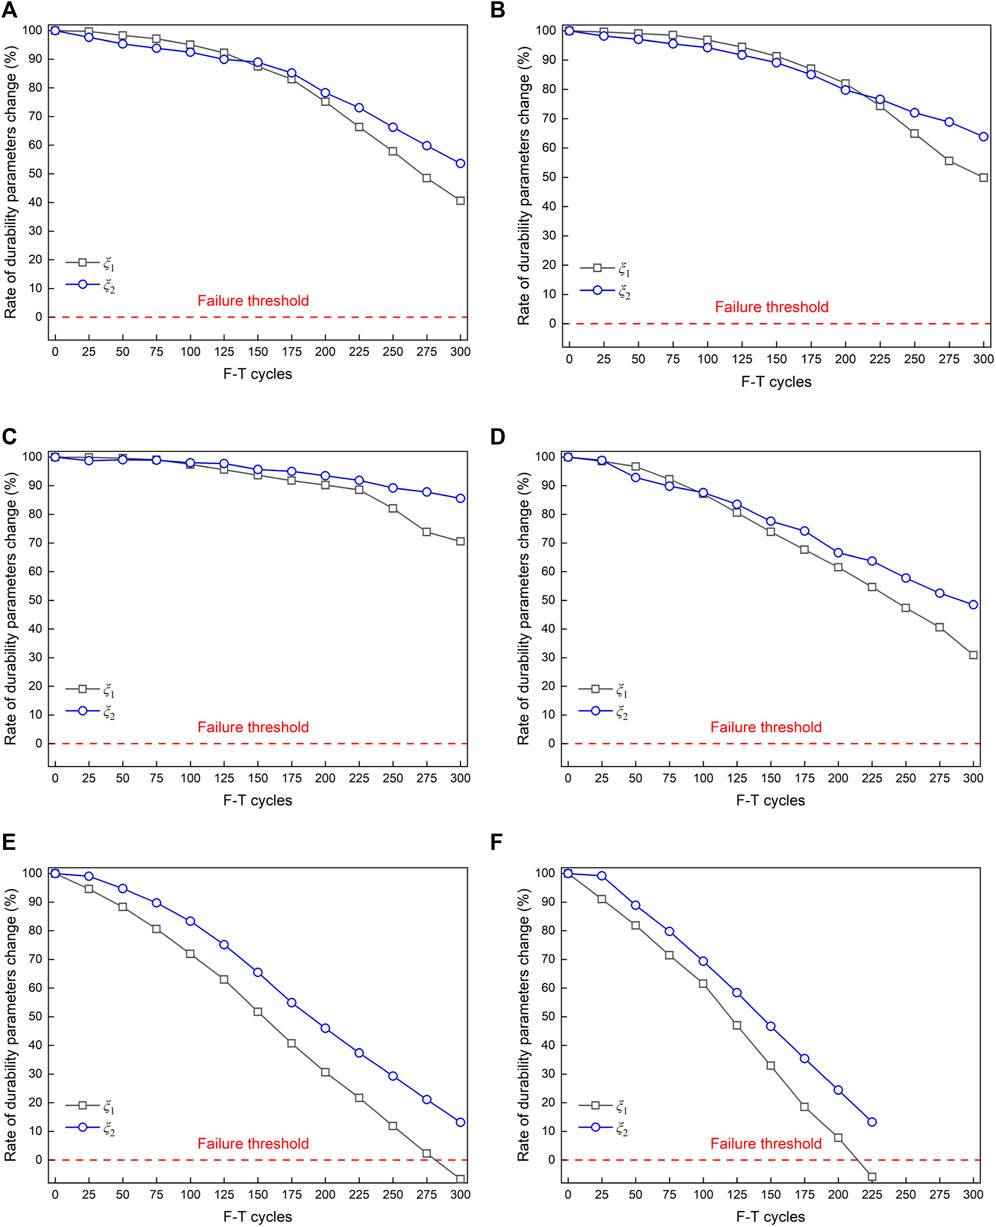
FIGURE 6. The rate of durability evaluation parameters change of RAC mixtures. (A) CWP-0. (B) CWP-10. (C) CWP-20. (D) CWP-30. (E) CWP-40. (F) CWP-50.
According to the viewpoint of Silva et al. (2016), there is an intrinsic connection between the RDME of RAC and its compressive strength. Comparing the deterioration trends of ξ1 and ξ2 curves in Figures 6A–F, it reveals that the compressive strength diminishes progressively with the deterioration of RDME under the F-T conditions. Furthermore, the specimens that was used to measure wave velocity and compressive strength were chosen at random, so the cause of durability damage to RAC strength from F-T cycles can be considered the same as that of RDME. However, from the results of the F-T cycle, it is evident that the change in ξ2 is later than the change in ξ1 during the overall cycle period. For instance, when the ξ1 curves of CWP-40 and CWP-50 are close to the failure threshold, the ξ2 curves are still a considerable distance away from durability failure. This indicates that RDME is more sensitive to condition factors when used as a durability evaluation parameter compared to the compressive strength damage factor. The primary cause of the discrepancy between the ξ1 and ξ2 curves is the variation in test methods, physical quantity definitions, etc. The compressive strength test is obtained by the recovery force of the instantaneous elastic deformation produced by the pressure tester’s continuous application of load at a fixed loading rate, i.e., it reflects the change in the surface strength of the material, and such results are subject to some error. Nevertheless, the impact-echo test is a thorough reflection of the specimen’s physical qualities, such as dynamic elastic modulus, density, and internal micro-crack development, which has a definite physical significance. The deterioration of RAC by an F-T condition occurs from the outside to the inside, and RDME is an exhaustive reflection of the specimen’s overall structural and microscopic features. Consequently, ξ1 is more susceptible to RAC internal flaws than ξ2, and if there is a fault in the compressive strength test, but the wave velocity can be established precisely, then RDME more effectively reflects the degree of RAC deterioration, hence reducing the impact of test errors. In view of this, considering the three aspects of test impact elastic wave velocity, compressive strength and F-T durability, it is suggested that the amount of CWP in RAC should not exceed 30%, with a recommended value of 20%.
The majority of the Grey models consist of GM(1,1) and GM(1,n), with the former used for univariate analysis and the latter for multivariate analysis. The experimental design of this investigation was based on a single variable, CWP contents, and hence the GM(1,1) model was selected to predict the durability life of RAC. The modeling steps are as follows:
Step 1:. Write the differential equation based on the GM(1,1) model’s definition:
where, a is the development coefficient and b is the grey effect coefficient (Yu et al., 2021).
Step 2:. From the GM(1,1) model’s definition, derive the difference equation:
where, x(0) (t) denotes the original data series,
Step 3:. Accumulate x(0) (t) to generate a calculation:
Step 4:. Solve for z(1) (t):
Step 5:. Simplify Eq. 11 and use the matrix form to represent.
where,
Step 6:. Solve the matrix to derive the values of a and b:
Step 7:. The discrete-time response equation of the GM(1,1) model is obtained by bringing the derived a and b into Eq. 8:
Step 8:. The resultant response equation is subjected to a single cumulative subtraction, from which the predicted values of the GM(1,1) model can be calculated as follows:
There are usually four methods for testing the accuracy of Grey model (Qin et al., 2022), which are: the average relative error method Δ, the correlation degree test γ, the posterior error ratio test C, and the small error probability test ω. Among them, for the calculation of Δ, it is also necessary to establish the relative error ε(0) (t) as follows:
In addition, other accuracy test formulae are not essential to the building of the model presented in this research; therefore, the relevant formula derivation analysis will not be developed. Those interested can find the details in the literature (Yang and Liu, 2008; Jiang et al., 2017; Mao et al., 2020). Table 3 displays the regularly used accuracy test level standard.

TABLE 3. Refer to the accuracy test level.
Referring to the author’s previous research (Yu et al., 2022), the Markov chain based on the division of ε(0) (t) into k states can be expressed as Eq. 19:
The state transfer probability of Markov chain is calculated as follows:
Therefore, the k-step transfer probability can be calculated as in Eq. 21:
where, Pij(k) is the probability of transferring from state i to state j after k steps. Mij(k) denotes the number of transfers from state i to state j after k steps. Mi denotes the number of original data in state i.
Meanwhile, the k-step state transfer probability matrix is as follows:
If there are m states and the present state is, the future state and the corresponding probability Pij(k) can be known based on the i-th row of the k-step state transfer matrix. The final calculation of Grey-Markov model can be obtained as follows:
Based on theF-T durability test results, the CWP-20 with the best test performance will be chosen to describe the derivation process of the Grey-Markov model in detail. Since the Grey model requires the data to be positive in the calculation process, the ξ1 value is no longer utilized and has been replaced with the Er value (the failure threshold of Er is 60%).
Following step 1 to step 8, the results of the Grey model for CWP-20 are as follows:
Correspondingly, the results of the model accuracy test are shown in Table 4.
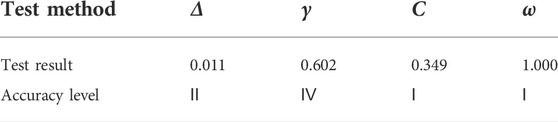
TABLE 4. Model accuracy test results.
From the test results in Table 4, it can be seen that the average relative error, correlation degree, posterior error ratio, and the small error probability of the Grey model have accuracy levels of II, IV, I, and I, respectively. Hence, the Grey prediction accuracy level is finally determined as IV, which cannot be used directly to predict the durability life of CWP-20 in the future time and has the necessity of applying the Markov chain.
During the initial phase of the Markov chain, the results of the ε(0) (t) operation are combined to classify the relative error into three states:
State 1: overestimated state, ε(0) (t) between [−0.05,−0.01].
State 2: exact state, ε(0) (t) between [−0.01,0.01].
State 3: Underestimated state, ε(0) (t) between [0.01,0.05].
Following Eqs. (19)–(22), the one-step state transfer matrix of CWP-20 can be obtained as follows:
Referring to the Markov chain prediction principle (Bradley, 1999), the state transfer matrix of each step can be obtained next. The predicted values of the Grey model are then rectified following Eq. 23, and the final prediction results of the two models are depicted in Figure 7. The fitting findings of Er values for CWP-20 for 0–300 F-T cycles are provided in Table 5 to compare the prediction accuracy of the two models more logically.
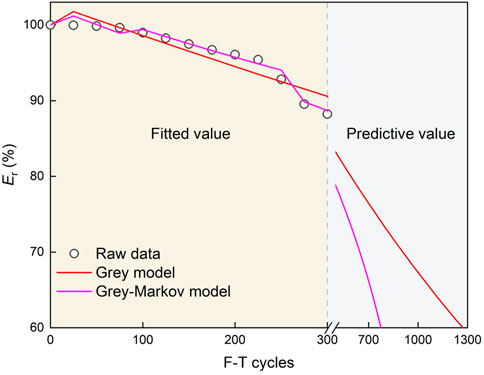
FIGURE 7. Model prediction results of Grey and Grey-Markov.

TABLE 5. Er value fitting results for CWP-20 during 300 F-T cycles.
As can be seen from Table 5, the maximum error of the Er fitted value of CWP-20 for the Grey model is 2.66% and the average error is 1.14%, as well as its overall performance, which is inferior to that of the Grey-Markov model. For the prediction results of the Grey-Markov model, the maximum error of the Er fitted value of CWP-20 is 1.31% and the average error is 0.47%. It is evident that the upgraded model can fully utilize the information provided by the original data to create accurate predictions for data with significant stochastic volatility. As evidenced in Figure 7, the Grey model predicts an overall smooth curve because it is a method for fitting the raw data to an exponential curve. According to the Grey model’s prediction, the CWP-20’s durability will fail after 1275 F-T cycles, which is a dubious outcome (Ray et al., 2021; Magbool, 2022). The results of the Grey-Markov model fit can fluctuate synchronously with the actual values, and the ε(0) (t) derived from the Markov chain in the later F-T cycles are deemed to be overestimated, so the actual occurrence values may be lower than the predicted results of the Grey model. From this, This indicates that the Grey-Markov model’s prediction that CWP-20 will approach durability failure after 775 F-T cycles is accurate.
With the confirmation that the Grey-Markov model has high prediction accuracy, to further comprehend the durability damage trend of CWP-RACs in the F-T environment, the life prediction of Er values of all specimens was performed by this model, and the results are shown in Figure 8. As shown in Figure 8, the durability life prediction for the control group is 575 cycles, and only CWP-10 and CWP-20 are anticipated to have a longer life. After 500 cycles, CWP-30 is predicted to be below CWP-0 and will fail in durability. CWP-40 and CWP-50 will fail after 300 and 225 cycles, respectively, which is consistent with the experimental measurement data and again verifies the Grey-Markov model’s high fitting accuracy. Overall, a massive amount of CWP harms the F-T resistance of RAC, whereas a little amount of CWP can greatly increase the F-T resistance of RAC.
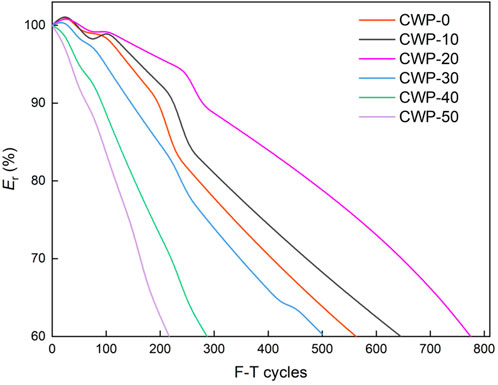
FIGURE 8. Durability life prediction curve of RAC mixtures based on Grey-Markov model.
In this paper, the influence of ceramic waste powder (CWP) addings on the freeze-thaw (F-T) resistance of recycled aggregate concrete (RAC) was investigated. The main conclusions can be drawn as follows.
1) CWP can significantly increase the early mechanical characteristics and compactness of RAC, and the compressive strength and impact elastic wave velocity of RAC doped with CWP were greater than those of conventional RAC specimens after 7 days. However, when the age of curing increased, the performance-enhancing capacity of CWP on RAC declined gradually.
2) During the F-T test of RAC, the RDME obtained by the impact-echo method can be employed as a durability evaluation parameter that is more susceptible to environmental conditions than the compressive strength evaluation parameter. The data from RDME indicate that a little amount of CWP can greatly improve the durability of RAC, however, an excess of CWP can have the opposite effect.
3) The Grey-Markov model can more accurately depict the deterioration trend of CWP-RAC durability damage in a F-T condition. With the impact-echo test data, the predicted data closely resembles the test situation. In engineering practice, it is more practical to test and maintain CWP-RAC in severe cold regions.
The raw data supporting the conclusions of this article will be made available by the authors, without undue reservation.
JY: Conceptualization, Methodology, Validation, Data curation, Writing–original draft. DL: Validation, Data curation. ZZ: Conceptualization, Methodology, supervisor, funding acquisition, Writing–review and editing.
The authors would like to thank the National Natural Science Foundation of China (Grant No. 52078083), and Natural Science Foundation Project of Chongqing (cstc2020jcyj-msxmX0901), and 111 Project of China (Grant No. B18062), and the Fundamental Research Funds for the Central Universities (Grant No. 2021CDJQY-008) for partial support of this work.
The authors declare that the research was conducted in the absence of any commercial or financial relationships that could be construed as a potential conflict of interest.
All claims expressed in this article are solely those of the authors and do not necessarily represent those of their affiliated organizations, or those of the publisher, the editors and the reviewers. Any product that may be evaluated in this article, or claim that may be made by its manufacturer, is not guaranteed or endorsed by the publisher.
Amadi, I. G., Beushausen, H., and Alexander, M. G. (2022). Multi-technique approach to enhance the properties of fine recycled aggregate concrete. Front. Mat. 9, 893852. doi:10.3389/fmats.2022.893852
Awoyera, P. O., Akinmusuru, J. O., and Moncea, A. (2017). Hydration mechanism and strength properties of recycled aggregate concrete made using ceramic blended cement. Cogent Eng. 4 (1), 1282667. doi:10.1080/23311916.2017.1282667
Bennett, B., Visintin, P., and Xie, T. (2022). Global warming potential of recycled aggregate concrete with supplementary cementitious materials. J. Build. Eng. 52, 104394. doi:10.1016/j.jobe.2022.104394
Bradley, R. C. (1999). Equivalent mixing conditions for Markov chains. Statistics Probab. Lett. 41 (1), 97–99. doi:10.1016/S0167-7152(98)00143-6
CECS 03-2007 (2007). Technical specification for testing concrete strength with drilled core. Beijing, China: China Standard Press.
Chen, X., Zhang, D., Cheng, S., Xu, X., Zhao, C., Wang, X., et al. (2022). Sustainable reuse of ceramic waste powder as a supplementary cementitious material in recycled aggregate concrete: Mechanical properties, durability and microstructure assessment. J. Build. Eng. 52, 104418. doi:10.1016/j.jobe.2022.104418
GB/T 50081-2019 (2019). Standard for test methods of concrete physical and mechanical properties. Beijing, China: China Architecture& Building Press.
GB/T 50082-2009 (2009). Standard for test methods of long-term performance and durability of ordinary concrete. Beijing, China: China Architecture& Building Press.
GB/T 50107-2010 (2011). Standard for evaluation of concrete compressive strength. Beijing, China: China Standard Press.
JGJ/T 443-2018 (2018). Technical standard for recycled concrete structures. Beijing, China: China Architecture& Building Press.
Jiang, S., Liu, S., Fang, Z., and Liu, Z. (2017). “Distance measuring and sorting method of general grey number based on kernel and grey degree,” in 2017 International Conference on Grey Systems and Intelligent Services, 43–45. doi:10.1109/GSIS.2017.8077667
Krzemień, K., and Hager, I. (2015). Post-fire assessment of mechanical properties of concrete with the use of the impact-echo method. Constr. Build. Mater. 96, 155–163. doi:10.1016/j.conbuildmat.2015.08.007
Li, P., Zhao, Y., Long, X., Zhou, Y., and Chen, Z. (2020). Ductility evaluation of damaged recycled aggregate concrete columns repaired with carbon fiber-reinforced polymer and large rupture strain FRP. Front. Mat. 7, 568036. doi:10.3389/fmats.2020.568036
Magbool, H. M. (2022). Utilisation of ceramic waste aggregate and its effect on eco-friendly concrete: A review. J. Build. Eng. 47, 103815. doi:10.1016/j.jobe.2021.103815
Mao, S., Kang, Y., Zhang, Y., Xiao, X., and Zhu, H. (2020). Fractional grey model based on non-singular exponential kernel and its application in the prediction of electronic waste precious metal content. ISA Trans. 107, 12–26. doi:10.1016/j.isatra.2020.07.023
Nwakaire, C. M., Yap, S. P., Onn, C. C., Yuen, C. W., and Ibrahim, H. A. (2020). Utilisation of recycled concrete aggregates for sustainable highway pavement applications: A review. Constr. Build. Mater. 235, 117444. doi:10.1016/j.conbuildmat.2019.117444
Peng, K., Qiao, H., and Chen, K. (2020). Field exposure test of ceramic-recycled gradient concrete based on Wiener process. Aust. J. Civ. Eng. 18 (2), 286–293. doi:10.1080/14488353.2020.1786295
Qin, Y., Guan, K., Kou, J., Ma, Y., Zhou, H., and Zhang, X. (2022). Durability evaluation and life prediction of fiber concrete with fly ash based on entropy weight method and grey theory. Constr. Build. Mater. 327, 126918. doi:10.1016/j.conbuildmat.2022.126918
Qu, Z., Li, M., Zhang, Z., Cui, M., and Zhou, Y. (2021). Dynamic optimization method of transmission line parameters based on grey support vector regression. Front. Energy Res. 9, 634207. doi:10.3389/fenrg.2021.634207
Ray, S., Haque, M., Sakib, M. N., Mita, A. F., Rahman, M. D. M., and Tanmoy, B. B. (2021). Use of ceramic wastes as aggregates in concrete production: A review. J. Build. Eng. 43, 102567–107102. doi:10.1016/j.jobe.2021.102567
Shokouhi, P., Rivière, J., Lake, C. R., Bas, P. Y. L., and Ulrich, T. J. (2017). Dynamic acousto-elastic testing of concrete with a coda-wave probe: Comparison with standard linear and nonlinear ultrasonic techniques. Ultrasonics 81, 59–65. doi:10.1016/j.ultras.2017.05.010
Silva, R. V., Brito, J., and Dhir, R. K. (2016). Establishing a relationship between modulus of elasticity and compressive strength of recycled aggregate concrete. J. Clean. Prod. 112 (4), 2171–2186. doi:10.1016/j.jclepro.2015.10.064
Wang, P., Qiao, H., Li, Y., Chen, K., Feng, Q., and Nian, T. (2021). Durability of organic coated reinforced magnesium oxychloride cement concrete. Struct. Concr. 22 (5), 2595–2610. doi:10.1002/suco.202000094
Wang, Y., Liu, Z., Wang, Y., Wang, D., Yuan, C., and Liu, R. (2022). Effect of recycled aggregate and supplementary cementitious material on the chloride threshold for steel bar corrosion in concrete. Constr. Build. Mater. 346, 128418. doi:10.1016/j.conbuildmat.2022.128418
Wichtmann, T., and Triantafyllidis, T. (2010). On the influence of the grain size distribution curve on P-wave velocity, constrained elastic modulus Mmax and Poisson's ratio of quartz sands. Soil Dyn. Earthq. Eng. 30 (8), 757–766. doi:10.1016/j.soildyn.2010.03.006
Yang, Y., and Liu, S. (2008). “Kernels of grey numbers and their operations,” in 2008 IEEE International Conference on Fuzzy Systems, 826–831. doi:10.1109/FUZZY.2008.4630466
Yu, J., Qiao, H., Hakuzweyezu, T., and Zhu, F. (2022). Damage and deterioration model of basalt fiber/magnesium oxychloride composites based on GM(1, 1)-markov in the salt spray corrosion environment. J. Renew. Mat. 10 (11), 2973–2987. doi:10.32604/JRM.2022.019620
Yu, J., Qiao, H., Zhu, F., and Wang, X. (2021). Research on damage and deterioration of fiber concrete under acid rain environment based on GM(1, 1)-markov. Materials 14, 6326. doi:10.3390/ma14216326
Zhang, Z., Liu, D., Ding, Y., and Wang, S. (2022). Mechanical performance of strain-hardening cementitious composites (SHCC) with bacterial addition. J. Infrastruct. Preserv. Resil. 3, 3. doi:10.1186/s43065-022-00048-3
Zhang, Z., Liu, S., Yang, F., Weng, Y., and Qian, S. (2021). Sustainable high strength, high ductility engineered cementitious composites (ECC) with substitution of cement by rice husk ash. J. Clean. Prod. 317, 128379. doi:10.1016/j.jclepro.2021.128379
Zhang, Z., Yang, F., Liu, J., and Wang, S. (2020). Eco-friendly high strength, high ductility engineered cementitious composites (ECC) with substitution of fly ash by rice husk ash. Cem. Concr. Res. 137, 106200. doi:10.1016/j.cemconres.2020.106200
Keywords: recycled aggregate concrete (RAC), freeze-thaw, ceramic waste powder (CWP), impact-echo method, grey-markov model
Citation: Yu J, Liu D and Zhang Z (2022) Durability and life prediction analysis of recycled aggregate concrete with ceramic waste powder under freeze-thaw conditions based on impact-echo method and Grey-Markov model. Front. Mater. 9:1060294. doi: 10.3389/fmats.2022.1060294
Received: 03 October 2022; Accepted: 13 October 2022;
Published: 21 October 2022.
Edited by:
Kequan Yu, Tongji University, ChinaReviewed by:
Mingfeng Xu, Hebei University of Technology, ChinaCopyright © 2022 Yu, Liu and Zhang. This is an open-access article distributed under the terms of the Creative Commons Attribution License (CC BY). The use, distribution or reproduction in other forums is permitted, provided the original author(s) and the copyright owner(s) are credited and that the original publication in this journal is cited, in accordance with accepted academic practice. No use, distribution or reproduction is permitted which does not comply with these terms.
*Correspondence: Zhigang Zhang, emhhbmd6Z0BjcXUuZWR1LmNu
Disclaimer: All claims expressed in this article are solely those of the authors and do not necessarily represent those of their affiliated organizations, or those of the publisher, the editors and the reviewers. Any product that may be evaluated in this article or claim that may be made by its manufacturer is not guaranteed or endorsed by the publisher.
Research integrity at Frontiers
Learn more about the work of our research integrity team to safeguard the quality of each article we publish.