 Isabelle Huynen
94% of researchers rate our articles as excellent or good
Learn more about the work of our research integrity team to safeguard the quality of each article we publish.
Find out more
ORIGINAL RESEARCH article
Front. Mater., 04 November 2022
Sec. Polymeric and Composite Materials
Volume 9 - 2022 | https://doi.org/10.3389/fmats.2022.1040753
This article is part of the Research TopicDielectric Microwave Absorbing StructuresView all 5 articles
The paper compares and optimizes through modeling conductive polymer composite slabs having different architectures of corrugated surfaces, designed to minimize both the reflectivity and its sensitivity to the angle of incidence of a microwave/millimeter wave signal impinging on the corrugated surface of the slab. Simulations using CST Studio software consider Poly-Lactid-Acid as dielectric material since it is widely used for 3D printing and offers very good possibilities of recycling in the frame of sustainability and green processing. Various profiles of corrugation are investigated; triangular, sinusoidal, or square-dot profiles, and compared with a uniform profile. Parameters such as height, width, and periodicity of the corrugations are varied in order to optimize the performances in terms of reflectivity over a large range of frequencies, between 20 GHz and 100 GHz. The configuration considered is the reflective screen, when the corrugated lossy dielectric slab covers a metallic plate mimicking the target. The goal is to maintain the reflectivity below 10 dB, in order to ensure up to 95% of absorption, for incidence angles up to 60°. Guidelines for the design and optimization of corrugated dielectric slab absorbers are proposed using specific gauges (Rozanov formalism and figure of merit) for the assessment of performances. Particular attention is devoted to the feasibility of manufacturing corrugated structures using additive 3D printing techniques.
Because electromagnetic (EM) pollution of the environment is becoming such a pervasive issue, highly efficient solutions for EMI protection are keenly sought, as electromagnetic interferences can have a detrimental effect on human health and the operation of electronic devices (Violette, 2013). Among these solutions, microwave absorbers have been developed for military as well as civilian applications in order to make a target invisible to radar signals. Well-known applications of the reduction of reflectivity include stealth military bombers and prevention of parasitic reflections induced by mast and rotating blades of wind turbines. For more than 2 decades microwave absorbing materials (MAM) are developed based on a polymer dielectric matrix containing conductive inclusions and aiming to absorb the signal through ohmic dissipation of the incident power (Chambers, 1994; Oh et al., 2004; Kim et al., 2008; Kim, 2011; Kim, 2012). The reflection is consequently reduced and absorption is favored via the penetration of the signal in the absorber. In the overall context of developing light-weight and thin broadband MAM absorbers, the majority of research is devoted to nanofiller surface modification, high-concentration multi-filler nanocomposite, and automated numerical techniques to synthesize randomly arranged multilayer topologies of the nanocomposite, so in (Wen et al., 2011; Thomassin et al., 2013; Wang and Zhao, 2014; Shital Patangrao PawarBiswas et al., 2016; Micheli et al., 2017). A MAM layer coating a metallic target allows for reducing the reflectivity to make the target invisible to the radar signal.
On the other hand, corrugated surfaces and profiles are investigated for many years as MAM. 2D grooves or grid arrays are proposed in (Rodriges, 2012; Zhou et al., 2021). Reflectivity less than -10 dB was obtained for incidence up to 45°. In (Abdullahi and Ali, 2021) an array of 3D printed cross-shaped dots again achieves reflectivity less than −10 dB for incidence up to 45°. In (JulianaSharif et al., 2020) pyramidal/triangular shape absorbers realized in coconut coir achieve reflectivity below −15 dB from 2 to 20 GHz and for incidence angles up to 60°. In (Sun et al., 2022) another pyramidal configuration is proposed for flame-retardant applications. A broadband—10 dB reflectivity bandwidth is observed, from 3.64 to 18 GHz, under incidence up to 60°. In (Chen et al., 2023) A “bionic” truncated pyramidal structure mimicking the moth-eye structure is proposed. Reflection below −10 dB is observed from 2 to 20 GHz. In (Quan et al., 2021) reflectivity below −10 days B is obtained from 7 to 20 GHz for another truncated pyramidal structure containing carbon nanotubes dispersed in (Silva and Kretly, 2011) a surface-corrugated version of pyramidal absorbers allows to achieve reflectivity below - 20 dB from 1 to 5 GHz. And in (Chang et al., 2016) an array of truncated multilayered pyramid dots combining metal and the epoxy dielectric is proposed to achieve nearly 100% absorption from 6 to 19 GHz up to 45° incidence. Finally, in [Kasim et al. (2019)] a corrugated bamboo roofing was tested as a microwave absorber and achieved reflectivity below—10 dB from 2 to 12 GHz and for incidence angles up to 45°.
Our approach provides new avenues for compact and efficient broadband microwave absorbers designed to cancel EM interferences above the microwave range, up to 100 GHz. The paper indeed investigates the potential of corrugated dielectric slabs loaded by conductive inclusions for providing wideband absorption over a wide range of angles of incidence.
Section 2 presents simulation tools and materials considered in this work, as well as the geometry of the various investigated profiles. In Section 3.1, the target specifications are defined. Next in Section 3.2 a first nominal configuration is proposed and discussed for the various profiles, analyzing reflectivity and absorption performance, while Section 3.3 evaluates their angular stability. Section 3.4 achieves a parametric analysis in order to optimize the geometrical and electrical parameters of the corrugated structure, and Section 3.5 evaluates the performance of the resulting optimized structure. Section 3.6.1 and Section 3.6.2 gauge the performance of the various profiles studied in the work, using the concepts of Rozanov limit thickness and figure of merit, respectively, while Section 3.7 evaluates the stability of the performance of the optimized structure with respect to 3D printing fabrication tolerances. Finally, Section 4 concludes with the formulation of design recommendations.
As announced above, the present work aims at simulating and designing efficient corrugated absorbers made of polymer loaded with conductive inclusions.
The simulation software used in this work is CST Microwave Studio. We consider here its “Microwave&RF/Periodic structures” module. It allows the simulation of the reflective behavior of any periodic structure backed by a metallic plate, knowing the geometry and composition of a unit cell. This configuration ensures that the absorption is maximized, since the signal is attenuated twice, firstly when traveling from the input air interface to the metallic plate, and secondly when traveling back after reflection by the plate towards the input interface. Figure 1 depicts the three corrugated geometrical profiles studied in this paper: triangular, sinusoidal, and square-dot. Parameters involved in the design are the thickness h of the periodic profile, their widths W and Ws, as well as the thickness hs of the support layer; h and hs parameters are similar for triangular, sinusoidal and square-dot profiles. CST extrapolates the behavior of any periodic structure based on Floquet’s modes theory and the geometry of the unit cell.
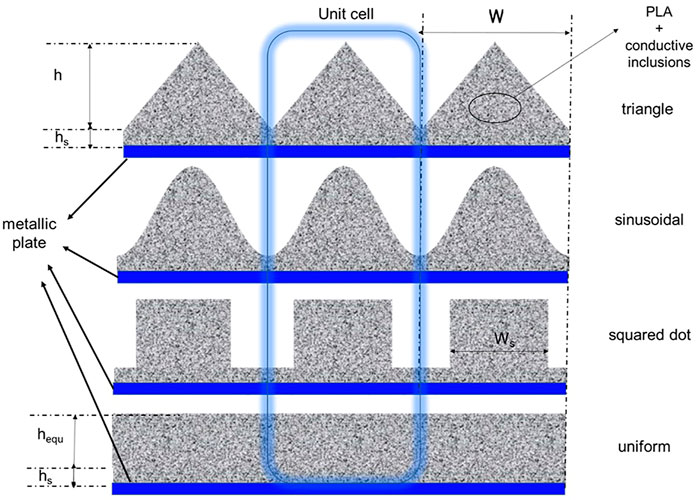
FIGURE 1. Geometry considered for the simulation of corrugated absorbers using CST software. The central blue-shaded box indicates the unit cell considered for each profile. Each profile has a periodicity W and thickness h, while a support layer ensuring the rigidity of the structure has a thickness hs.
For sake of comparison a uniform, constant profiles is also considered. It has a thickness such as the total content/volume of conductive PLA matrix in the unit cell is identical for the uniform profile and the three corrugated profiles presented in Figure 1. The volume is obtained as the average surface mean value of the profile. It can easily be calculated that for triangular and sinusoidal profiles the mean value is equal to W h/2 while for square-dot it is equal to Ws h. In order to achieve the same volume content for all corrugated structures, the considered value for Ws has to be equal to W/2. For the uniform structure at bottom of Figure 1, the unit cell of width W will have for comparative simulations an equivalent thickness hequ = h/2, in order to account for the same volumetric content.
As announced before, the work is intended to have applications for 3D printing. The corrugated absorbers of Figure 1 are thus simulated and discussed for realistic values of electromagnetic parameters of the dielectric material forming the corrugated absorber. According to (Clark et al., 2017; AmitArefin and Nava Raj KhatriNitin KulkarniPaul F. Egan, 2021) ABS, PEEK, PC, and PLA are among the polymer materials suited for 3D printing. In this work, we select PLA as we know it from our previous work, and it has the advantage to be easily recyclable in the context of green processing and sustainability (Zaaba etJaafar, 2020; Aniśko et al., 2022). The electromagnetic parameters of the PLA matrix are shown in Figure 2 as a function of the 1–100 GHz frequency range considered in this paper; real and imaginary part of permittivity εr, the equivalent loss tangent factor tanδ, and the permeability μr equal to 1 for nonmagnetic materials. The considered electrical conductivity created by conductive inclusions dispersed in the PLA matrix and forming the conductive polymer is equal to 5 S/m, while the dielectric constant εr of PLA is equal to 3.5. These values of permittivity and conductivity are introduced in the CST Studio simulation software. The feasibility of 3D printing using conductive PLA is discussed in Section 4.
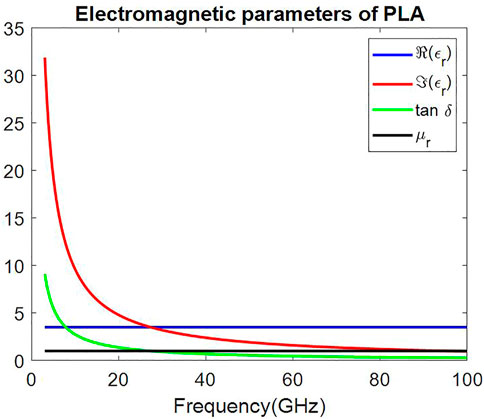
FIGURE 2. Electromagnetic parameters of PLA. Considered values are dielectric constant εr = 3.5, conductivity σ = 5 S/m.
The nominal values for the geometrical parameters considered for the simulation of each configuration of Figure 1 are:
Width of cell W = 6 mm.
Height of profile H = 2 mm.
Thickness of the support layer hs = 0.75 mm.
Width of square dot Ws = 3 mm.
Height of equivalent uniform profile hequ = 1.75 mm.
These values are selected in order to be compatible with the lowest wavelength considered in this work (i.e., 3 mm at 100 GHz), while keeping the overall thickness of the absorber as low as possible. They are just initial values that will be varied during the parametric analysis performed in Section 3.4.
As shown in Figure 1 each profile configuration is backed by a metallic plane; if the profile is made of an absorbing material the microwave signal entering the structure is absorbed twice, firstly when traveling towards the metal plate, and secondly when being back reflected to the input interface with the surrounding air. The so-called reflectivity R is minimized: almost no signal is reflected towards the input, meaning that all the microwave signal has been absorbed. The relation between reflectivity R and absorption A is given by Eq. 1 which expresses the power balance:
In the following, R and A will be expressed in %, since they represent the fraction of the incident power that is reflected or absorbed, respectively.
As announced in the abstract the goal is the obtention of high absorption performances. We are interested in achieving a reflectivity below 5%, corresponding to R < - 13 dB, in order to ensure absorption is superior to 95%. These performances must be reached from 20 GHz to 100 GHz.
Figure 3 shows the reflectivity R (Figure 3A) and absorption A (Figure 3B) for the four profiles presented in Figure 1. The first observation that can be made is that the uniform profile exhibits worse performances since it largely fails to satisfy criteria R < 5% and A > 95% over the 20–100 GHz frequency range. Indeed peaks of maximum reflectivity above 20% occur around 50 and 90 GHz, meaning that absorption remains below 80% at those frequencies. This observation demonstrates the superiority of corrugated profiles over uniform one. Next, the square dot profile shows lower performances than triangular and sinusoidal ones, as the reflectivity R is higher, particularly above 78 GHz where it exceeds the 5% limit. The best performances are obtained for the triangular and sinusoidal profiles which satisfy criteria on both R and A. This can be explained by the fact that their profile remains smooth as seen from the incident impinging microwave signal. Owing to their best performances, these 2 profiles are selected for further analysis in the following subsections, while keeping the uniform one for reference comparison.
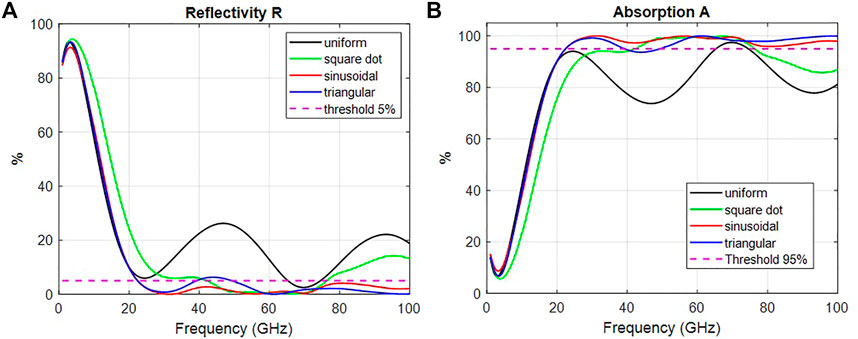
FIGURE 3. Performances of profiles of Figure 1 (A) reflectivity R (B) absorption A.
This section investigates the influence of the angle of incidence of the microwave signal on the frequency response of the triangular and sinusoidal profiles selected from the previous section. Figure 4 shows the angular dependence of the reflectivity R for the uniform, sinusoidal and triangular profiles. The threshold limits corresponding to 5 and 10% reflectivity are indicated as solid and dashed lines respectively.
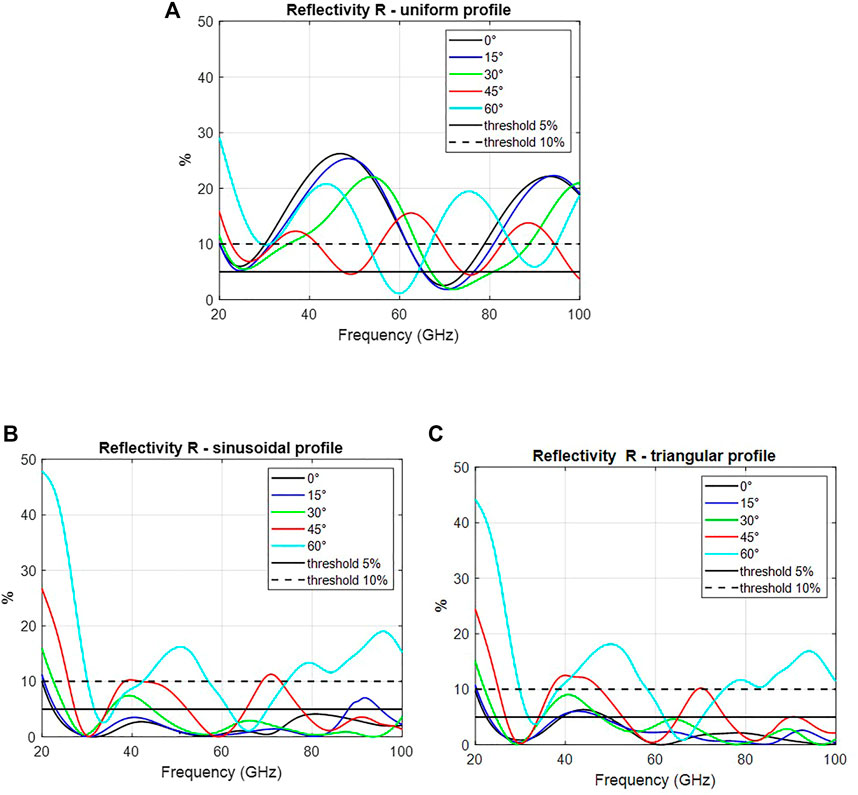
FIGURE 4. Angular dependence of reflectivity R (A) uniform profile (B) sinusoidal profile (C) triangular profile.
As the first observation, the uniform profile fails to remain below the two thresholds for all incidence angles, well in accordance with the observation made in Figure 3.
Table 1 summarizes the performances of each configuration depending on the value of the incidence angle. Two characteristic values are provided for each angle: meanR is the mean value of R obtained over the 30–100 GHz frequency range, while maxR is the maximum value over the same range.
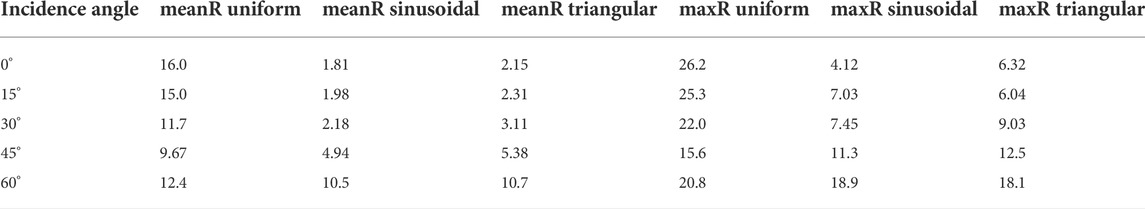
TABLE 1. Mean and maximum values of reflectivity R as a function of angle of incidence for uniform, sinusoidal and triangular profiles. The considered frequency ranges from 30 to 100 GHz.
We can conclude from Table 1 that sinusoidal and triangular profiles can maintain mean reflectivity at 5% for incidence angles up to 45°, and close to 10% for 60° incidence. This means that an absorption level of at least 90% is preserved for those two profiles, which is not the case for the uniform profile. In the following, we will concentrate on the sinusoidal profile that has the best angular stability.
As last observation the minima of reflectivity occur for the uniform profile of Figure 4A at frequencies verifying that thickness is equal to the quarter wavelength inside the profile; this behavior is characteristic of the reflective screen operation. Minima under 0° incidence are located at 22.9 and 68.7 GHz, satisfying:
Where εr is the dielectric constant of the absorbing profile, co is the light velocity in air, and htot is the total height of the structure. In this work, εr = 3.5 and htot = 1 .75 mm.
In turn, for sinusoidal and triangular profiles in Figures 4B,C the relation (2) is not verified: the first zero of R occurs well above 23 GHz, around 30 GHz, while the second zero occurs below 69 GHz, around 60 GHz. Indeed, the presence of the corrugated surface modifies the frequency dependence of the interaction of the impinging signal with the absorbing profile.
In this section, the response of the reflectivity R to the variation of parameters listed in Section 3.1.1 is studied.
Figure 5 shows the reflectivity R for various values of width of cell W, and for lower and upper values of incidence angle envisioned in this study, namely 0° in Figure 5A, and 60° in Figure 5B.
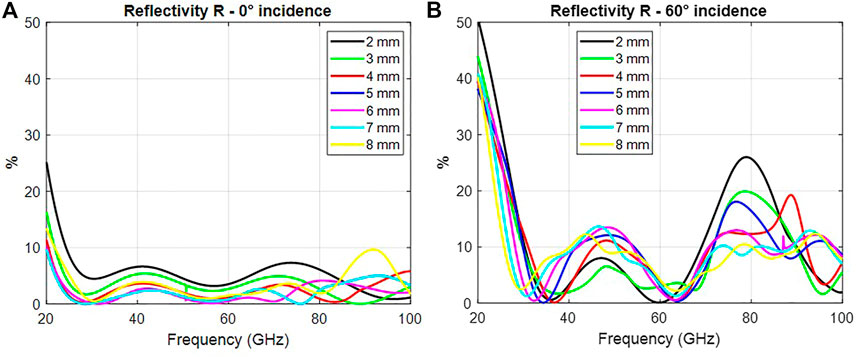
FIGURE 5. Reflectivity R for various widths W of unit cell (A) 0° incidence (B) 60° incidence.
As done in Table 1, Table 2 summarizes the performances for each value of width W and the two incidence angles considered in Figure 5. MeanR is again the mean value of R obtained over the 20–100 GHz frequency range, while maxR is the maximum value over the same range.
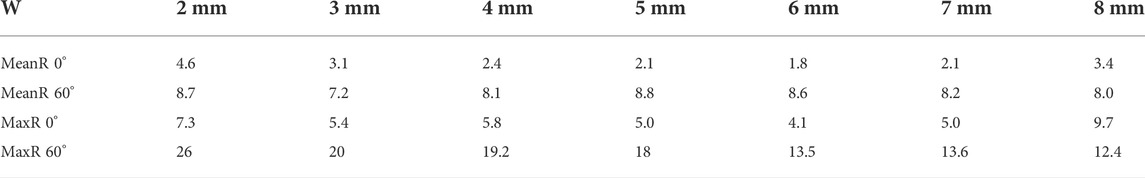
TABLE 2. Mean and maximum values of reflectivity R as a function of width W and for the angle of incidence 0° and 60°.
From Table 2 we can conclude that increasing the width of the cell W does not influence significantly the mean value of the reflectivity, which remains below 10% and thus ensures mean absorption higher than 90% whatever the incidence angle. Meanwhile increasing W up to 8 mm allows to maintain the maximum value for R below 13% for 60° incidence, meaning the preservation of absorption higher than 87%, 7% higher than for the nominal width W = 3 mm.
Figure 6 shows the reflectivity R for various values of height of profile h, from 1 to 6 mm, and for lower and upper values of incidence angle envisioned in this study, namely 0° in Figure 6A, and 60° in Figure 6B.
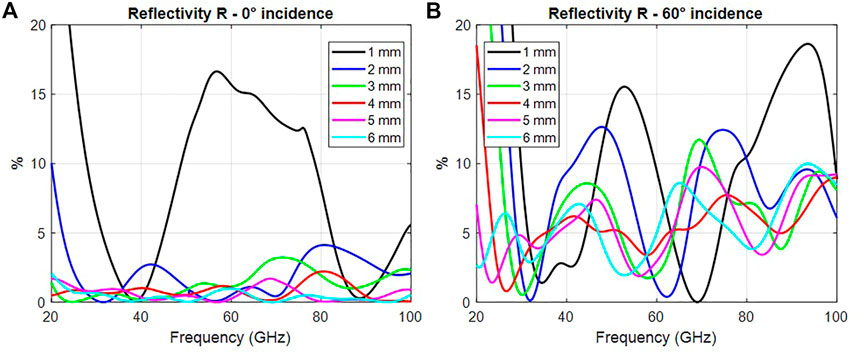
FIGURE 6. Reflectivity R for various heights h of the unit cell (A) 0° incidence (B) 60° incidence.
The reflectivity decreases when the height h of the profile increases, since in this case the impinging wave sees a longer path for absorption in the lossy conductive profile before being reflected by the back metallic plate. This observation is valid under a normal incidence of 0°, while under 60° incidence there seems to exist an optimum height h = 3 mm. For both incidences, this height ensures a reflectivity roughly lower than 10% from 30 to 100 GHz.
Figure 7 shows the reflectivity R for various values of height of support layer hs, from 1 to 6 mm, and for lower and upper values of incidence angle envisioned in this study, namely 0° in Figure 7A, and 60° in Figure 7B.
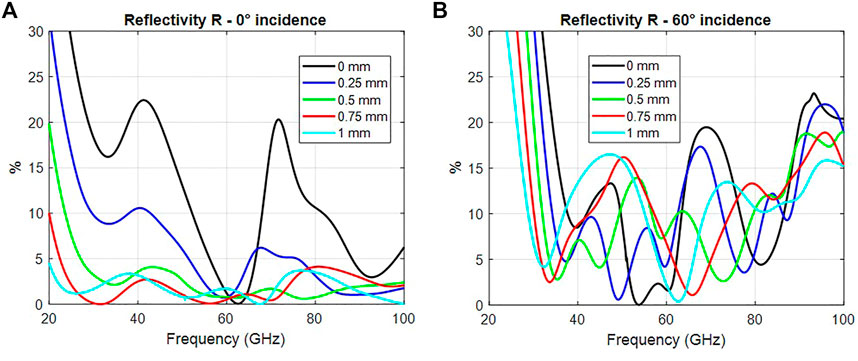
FIGURE 7. Reflectivity R for various heights hs of the support layer (A) 0° incidence (B) 60° incidence.
Again the reflectivity decreases when the height hs of the support layer increases since in this case, the impinging wave sees a longer path for absorption in the lossy conductive support layer following the corrugated profile before being reflected by the backing metallic plate. This observation is mainly valid under a normal incidence of 0°. Under 60° incidence there is little difference between the curves, which is explained by the fact that the major part of the absorption already occurred in the profile layer of thickness h, so that little absorption occurs in the support layer. In conclusion, the 0.75 mm and 1 mm thicknesses are the most appropriate to preserve absorption, and as far as we are interested in the most compact, thinnest structure, the 0.75 mm thickness would be selected.
Figure 8 shows the reflectivity R for various values of conductivity of profile material, from 0 to 30 S/m, and for lower and upper values of incidence angle envisioned in this study, namely 0° in Figure 8A, and 60° in Figure 8B.
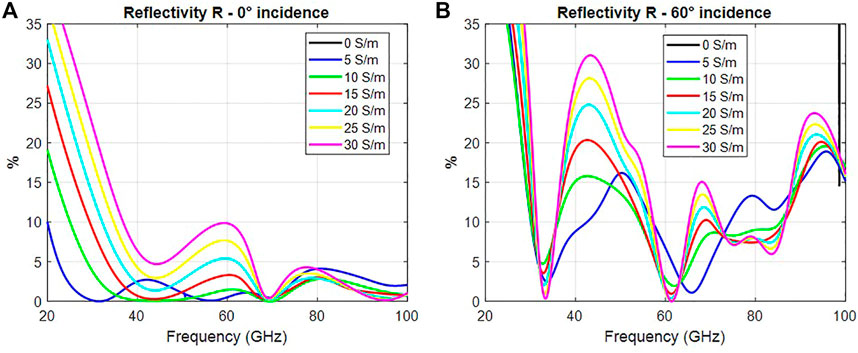
FIGURE 8. Reflectivity R for various conductivities of profile material (A) 0° incidence (B) 60° incidence.
From Figure 8 we conclude that there is an optimum for the conductivity around 5–10 S/m, as this range minimizes R. Above 10 S/m R increases, which is explained by the fact that the conductive composite profile starts to behave like a metal, thus acts more reflective than absorbent, and tends to the behavior of the black zero conductivity curve, out of scale in Figure 8 since saturating at 100% level. Indeed when the conductivity equals zero, no absorption occurs in the profile, so that all the signal is reflected by the metallic plate, generating 100% reflectivity.
Figure 9 shows the reflectivity R for various values of the dielectric constant of profile material, from 2 to 5, and for lower and upper values of incidence angle envisioned in this study, namely 0° in Figure 9A, and 60° in Figure 9B. For εr values up to 3.5 which was the initial nominal value considered, the reflectivity remains below 5%, ensuring absorption higher than 95%, meeting the target objective of this work. Nevertheless, under 60° incidence, the absorption level cannot exceed 85% even for the lowest values of εr, but we have verified that the mean value of R under 60° incidence remains below 10% for εr values up 4, meaning that the nominal configuration preserves the mean reflectivity and absorption values below 10% and above 90% respectively.
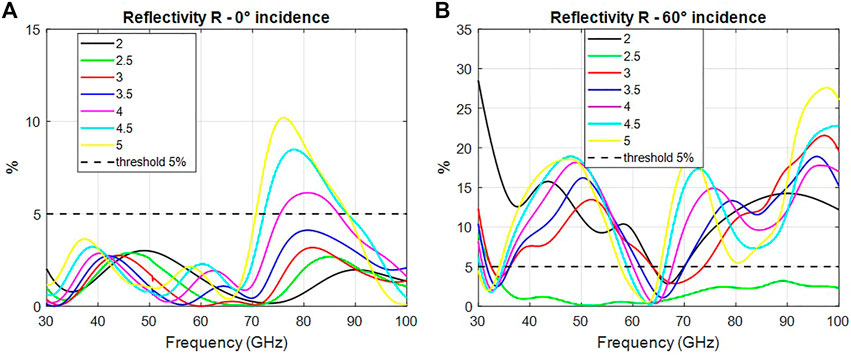
FIGURE 9. Reflectivity R for various values of dielectric constant εr of profile material (A) 0° incidence (B) 60° incidence.
Based on the parametric study made in Section 3.4, we can determine the best parameters for the maximization of the absorption and the minimization of the reflectivity. These parameters are:
Width of cell W = 8 mm.
Height of profile h = 3 mm.
Thickness of the support layer hs = 0.75 m.
Conductivity of profile material σ = 10 S/m.
Dielectric constant εr = 3.5.
The considered profile is the sinusoidal one, selected from the analysis of Section 3.3.
Figure 10 shows the behavior versus frequency and depending on the incidence angle of the reflectivity and the corresponding absorption simulated using the parameters listed just above. Reflectivity R satisfies very well the criterion R < 5% corresponding to A > 95%, up to 60° incidence. These excellent performances are attributed to the adjustment achieved on the height of H and the material conductivity of the corrugated profile.
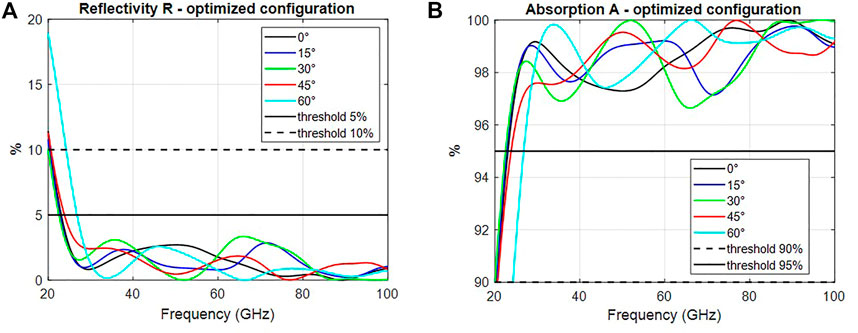
FIGURE 10. Performances of optimized configuration (A) reflectivity R (B) absorption A.
In this section the performances of our structures are evaluated using two criteria; firstly the Rozanov formula proposed in the literature for lossy dielectric slabs, and secondly through the definition of a dedicated figure of merit.
The performances of our samples can be gauged using the Rozanov formalism that allows us to predict the optimal theoretical thickness of a composite slab given its level of reflectivity and operation wavelength range. The Rozanov formula is given in (Rozanov, 2000; Zhou et al., 2021) as:
It rewrites as a function of frequency as
Where f1 and f2 are the limits of the frequency range, here 1 and 100 GHz, co is the light velocity in air and dR is the optimal thickness limit finally given by:
Table 3 compares the actual physical thickness of the various configurations investigated in this paper and the Rozanov limit calculated from Eq. 5 using simulated reflectivity R provided in the various figures listed in Table 3.
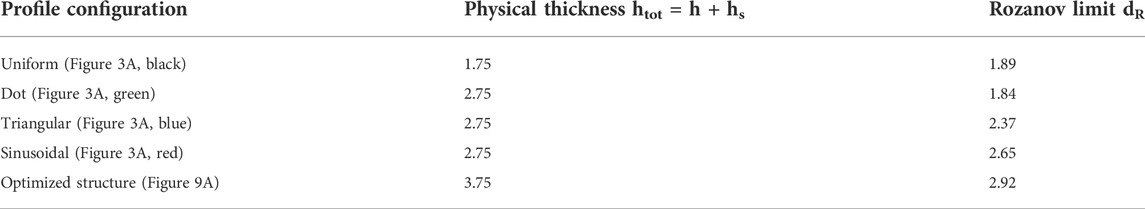
TABLE 3. Physical and Rozanov limit thickness for the various investigated profiles. Values are in mm.
From Table 3 it can be confirmed that the sinusoidal profile has the best compactness performance since its thickness value is closest to the corresponding Rozanov thickness limit, the difference being less than 10%.
A figure of merit (FOM) is a quantity used to characterize the performance of a device, system, or method, relative to its alternatives. In engineering, figures of merit are often defined for particular materials or devices to determine their relative utility for an application. Given this we define for our absorber application:
- BW, the 5% absorption bandwidth, defined as the frequency range where R < 5%
- the fractional bandwidth as
where fo is the center frequency of the absorption bandwidth BW.
Then we define FOM as
Where htot is the total height of the structure and maxR is the maximum value as reported in Table 1, but expressed in natural value, not in %.
This definition (7) indicates that we are interested in having the lowest magnitude of reflectivity R over the highest possible relative bandwidth and for the lowest thickness.
Table 4 summarizes the performances for each configuration considered.
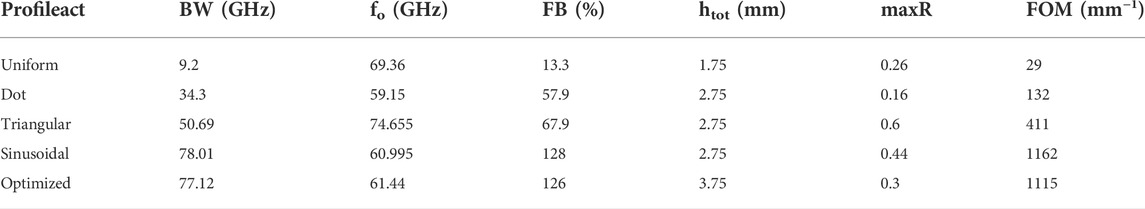
TABLE 4. Bandwidth and FOM performances for the various investigated profiles.
From Table 4 we can conclude that the sinusoidal profile and its optimized version exhibit the best performances in terms of FOM. However, as far as compactness is concerned, the sinusoidal profile should be preferred.
In order to compare our performance with the literature, we again consider the definition of the fractional bandwidth FB and FOM introduced in Section 3.6.2, but we take into account in the expression of the FOM the thickness of the absorber normalized to the wavelength corresponding to the center frequency fo, and noted htot norm:
Table 5 reports similarily to Table 4 the performance of various absorbers presented in the introduction in order to compare it to our best sinusoidal configuration. The conclusion is that our work stands out in term of figure of merit FOM, due to its lowest thickness and excellent FB. It also operates over a large bandwidth, from 20 to 100 GHz.
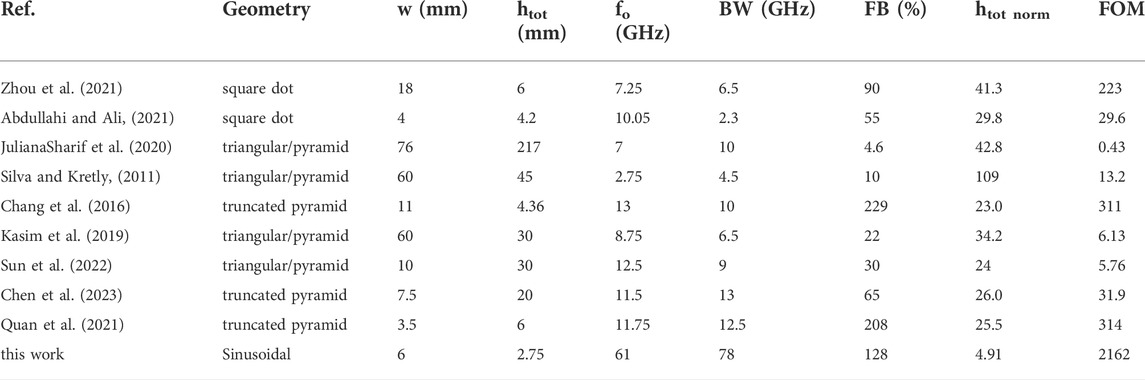
TABLE 5. Geometry, bandwidth and FOM performances for the various profiles from the literature.
According to (Clark et al., 2017), the typical feature resolution of the 3D printing fabrication technique is 100 μm.
Figure 11 illustrates the sensitivity of the reflectivity R for the optimal configuration of Figure 10 to a variation of all geometrical dimensions listed in Section 3.5. Considered variations range from—400 μm to 400 μm. Negative values (corresponding to dashed lines) mean that all dimensions are reduced by the corresponding value, while positive values mean that all dimensions are enlarged by the corresponding value. The reference configuration having no variation of dimensions is depicted by the black 0 μm curve.
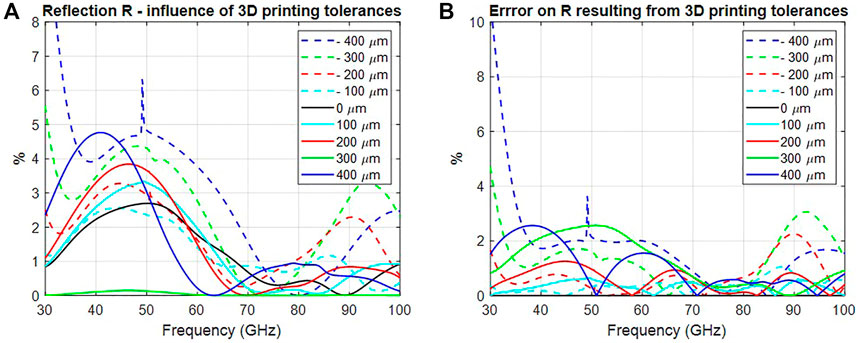
FIGURE 11. (A) Influence of 3D manufacturing tolerances on reflectivity R (B) Error on R.
From Figure 11A we can conclude that for tolerances up to 300 μm R remains below 5%, while the error calculated as the difference between R at tolerance X microns and the reference R at 0 μm variation remains also below 3%, as shown in Figure 11B. For the 100 μm tolerance associated with 3D printing, the variation induced in the reflectivity does not affect its performance, since the target specification R < 5% is preserved.
In conclusion, our optimized design remains robust to fabrication tolerances associated with 3D printing.
The analysis performed in Sections 3.4–3.7 enables us to establish guidelines for the design of our corrugated absorbers. The following recommendations can be formulated.
At first, the reflectivity at the input of the corrugated structure has to be minimized to favor absorption. The absorption can be directly favored by increasing the thicknesses h, hs of the structure (Section 3.4.2 and Section 3.4.3; Figures 6, 7); however, for some applications, compactness is a key issue so a trade-off between total thickness and absorption must be found.
The absorption is also favored by the increase in conductivity of the composite material forming the foam (see Section 3.4.4 and Figure 8). However, a prohibitive conductivity can induce a prohibitive reflectivity R that reduces the penetration of the microwave signal in the foamed composite. Again, a trade-off has to be found. The fine-tuning of the conductivity tailors the absorption correlated to the thickness. The control of the conductivity induced by conductive loads in the polymer used for 3D printing can be mastered by various techniques including co-precipitation, melt blending or extrusion, as presented in (Thomassin et al., 2013; Monnereau et al., 2014; Tran et al., 2015). Also conductive PLA filaments based on graphite (Simone Luigi MarassoCocuzza et al., 2018), carbon black (Al-Rubaiai et al., 2017) or graphene (Chan et al., 2018) conductive filler are commercially available, and are compatible with classical 3D printing machines that are using such filaments. This makes the fabrication of our proposed corrugated structures feasible, with the additional advantage that their waste is compatible with sustainable recycling.
The dielectric constant of the corrugated material has to be kept as low as possible, to minimize the reflectivity R, see Section 3.4.5 and Figure 9. However, its value is dependent on the materials used for 3D printing and cannot be adjusted at will.
As a final comment, the parametric study coupled with Rozanov and FOM gauges enables us to conclude that the sinusoidal profile shows the best performances in terms of reflectivity and absorption coupled with compactness. And the optimized design proposed is compatible with 3D printing fabrication techniques.
Also, all corrugated profiles investigated in this work show superior performances in terms of reflectivity, absorption, and angular stability compared to the uniform profile considered as the standard configuration for the reflective configuration. Our sinusoidal profile also competes very well with the state-of-the art due to its excellent figure of merit combined with minimal thickness, and operates up to 100 GHz.
The raw data supporting the conclusions of this article will be made available by the authors, without undue reservation.
IH realized the totality of the work presented in this article, as well as its writing.
IH acknowledges the support of the National Fund for Scientific Research (FNRS, Belgium) which funded this research.
The author thanks Christophe Craeye and François Hubin for giving access to CST Studio software.
The authors declare that the research was conducted in the absence of any commercial or financial relationships that could be construed as a potential conflict of interest.
All claims expressed in this article are solely those of the authors and do not necessarily represent those of their affiliated organizations, or those of the publisher, the editors and the reviewers. Any product that may be evaluated in this article, or claim that may be made by its manufacturer, is not guaranteed or endorsed by the publisher.
Abdullahi, M. B., and Ali, M. H. (2021). 3-D printed radar absorber with meta-material features for X-band Application. jasem. 25 (8), 1541–1546. doi:10.4314/jasem.v25i8.39
Al-Rubaiai, Mohammed, Pinto, Thassyo, and Torres, David (September 2017). Characterization of a 3D-PRINTED conductive PLA material with electrically controlled stiffness. Proceedings of the ASME 2017 Conf. Smart Mater. Adapt. Struct. Intelligent Syst. SMASIS2017. Snowbird, UT, USA.doi:10.1115/SMASIS2017-3801
Arefin, A. M. E., Nava, K. N. R., Kulkarni, N, and Egan, P. F (2021). Polymer 3D printing review: Materials, process, and design strategies for medical applications. Polymers 13, 1499. doi:10.3390/polym13091499
Aniśko, J., Barczewski, M., Mietliński, P., Piasecki, A., and Szulc, J. (2022). Valorization of disposable polylactide (PLA) cups by rotational molding technology: The influence of pre-processing grinding and thermal treatment. Polym. Test. 107, 107481. doi:10.1016/j.polymertesting.2022.107481
Chambers, B. (1994). Optimum design of a Salisbury Screen radar absorber. Electron. Lett. 30, 1353–1354. doi:10.1049/el:19940896
Chan, K. Y., Ramer, R., and Sorrentino, R. (2018). Low cost ku band waveguide devices using 3D printing and liquid metal filling. IEEE Trans. Microw. Theory Tech. 66 (9), 3993–4001. doi:10.1109/tmtt.2018.2851573
Chang, Long, Yin, Sheng, Wang, Wei, Li, Wei, Zhu, Jianfei, and Guan, Jianguo (2016). Broadening the absorption bandwidth of metamaterial absorbers by transverse magnetic harmonics of 210 mode. Sci. Rep. 6, 21431. doi:10.1038/srep21431
Chen, Ziming, Zhang, Ying, Wang, Zhide, Wu, Yue, Zhao, Yue, Liu, Lie, et al. (2023). Bioinspired moth-eye multi-mechanism composite ultra-wideband microwave absorber based on the graphite powder. Carbon 201, 542–548. doi:10.1016/j.carbon.2022.09.035
Clark, SamuelLigon, Liska, Robert, Stampfl, Jürgen, Gurr, Matthias, and Mülhaupt, Rolf (2017). Polymers for 3D printing and customized additive manufacturing. Chem. Rev. 117, 10212–10290. doi:10.1021/acs.chemrev.7b00074
JulianaSharif, Md, Bahrin, D. K., Baharudin, R., Zanal, A., Noordin, I. R. M., Fazin, M. I., et al. (2020). Performance study of coconut coir pyra-shape absorber design. ijeetc.Novemb 9 (6), 409–413. doi:10.18178/ijeetc.9.6.409-413
Kasim, M. N., Idris, A. H., Mokhtar, A. M. F. A. B., Noor, A. A. M. N., Kasim, M. L., Ismail, N. A., et al. Corrugated bamboo roofing design of microwave absorber for reflection absorption. J. Phys. Conf. Ser 1349, 2019, 012008.
Kim, B. (2012). Broadband radar absorbing structures of carbon nanocomposites. Adv. Compos. Mater 21, 333–344. doi:10.1080/09243046.2012.736350
Kim, J. B. (2011). Design of Salisbury screen absorbers using dielectric lossy sheets. Proceedings of the 2011 IEEE Int. Conf. Microw. Technol. Comput. Electromagn, 1–2.May 2011 Beijing, China, doi:10.1109/ICMTCE.2011.5915154
Kim, J.-B., Lee, S.-W., and Kim, C.-G. (2008). Comparison study on the effect of carbon nano materials for single-layer microwave absorbers in X-band. Compos. Sci. Technol. 68, 2909–2916. doi:10.1016/j.compscitech.2007.10.035
Micheli, D., Pastore, R., Vricella, A., and Marchetti, M. (2017). Matter’s electromagnetic signature reproduction by graded-dielectric multilayer assembly. IEEE Trans. Microw. Theory Tech. 65 (8), 2801–2809. doi:10.1109/tmtt.2017.2679749
Monnereau, L., Urbanczyk, L., Thomassin, J. M., Alexandre, M., Jérôme, C., Huynen, I., et al. (2014). Supercritical CO2 and polycarbonate based nanocomposites: A critical issue for foaming. Polymer 55, 2422–2431. doi:10.1016/j.polymer.2014.03.035
Oh, J.-H., Oh, K.-S., Kim, C.-G., and Hong, C.-S. (2004). Design of radar absorbing structures using glass/epoxy composite containing carbon black in X-band frequency ranges. Compos. Part B Eng. 35, 49–56. doi:10.1016/j.compositesb.2003.08.011
Quan, Bin, Gu, Weihua, Sheng, Jiaqi, Lv, Xinfeng, Mao, Yuyi, Liu, Lie, et al. (2021). From intrinsic dielectric loss to geometry patterns: Dual-principles strategy for ultrabroad band microwave absorption. Nano Res. 14, 1495–1501. doi:10.1007/s12274-020-3208-8
Rodriges, S. (2012). Development of a new reflecting surface for electromagnetic waves. IOSR J. Appl. Phys. 1 (6), 55–58. doi:10.9790/4861-0165558
Rozanov, K. N. (2000). Ultimate thickness to bandwidth ratio of radar absorbers. IEEE Trans. Antennas Propag. 48, 1230–1234. doi:10.1109/8.884491
Shital Patangrao Pawar, , Biswas, S., Kar, G. P., and Bose, S. (2016). High frequency millimetre wave absorbers derived from polymeric nanocomposites. Polymer 84, 398–419. doi:10.1016/j.polymer.2016.01.010
Silva, M. W. B., and Kretly, L. C. New concept of RAM-radiation absorbent material: Applying corrugated surfaces to improve reflectivity. Proceedings of the 2011 SBMO/IEEE MTT-S Int. Microw. Optoelectron. Conf., IMOC 2011), 556–560. Natal, Brazil, October 2011 doi:10.1109/IMOC.2011.6169338
Simone Luigi Marasso, , Cocuzza, M., Bertana, V., Perrucci, F., Tommasi, A., Ferrero, S., et al. (2018). PLA conductive filament for 3D printed smart sensing applications. Rapid Prototyp. J. 24/4, 739–743. doi:10.1108/rpj-09-2016-0150
Sun, Hengda, Zhang, Ying, Wu, Yue, Zhao, Yue, Zhou, Ming, Liu, Lie, et al. (2022). Broadband absorption of macro pyramid structure based flame retardant absorbers. J. Mater. Sci. Technol. 128, 228–238. doi:10.1016/j.jmst.2022.04.030
Thomassin, J. M., Jérome, R., Pardoen, T., Bailly, C., Huynen, I., and Detrembleur, C. (2013). Polymer/carbon based composites as electromagnetic interference (EMI) shielding materials. Mater. Sci. Eng. R Rep 74 (7), 211–232. doi:10.1016/j.mser.2013.06.001
Tran, M. P., Thomassin, J. M., Alexandre, M., Jerome, C., Huynen, I., and Detrembleur, C. (2015). Nanocomposite foams of polypropylene and carbon nanotubes: Preparation, characterization, and evaluation of their performance as EMI absorbers. Macromol. Chem. Phys. 216, 1302–1312. doi:10.1002/macp.201500031
Wang, Zhou, and Zhao, Guang-Lin (2014). Electromagnetic wave absorption of multi-walled carbon nanotube–epoxy composites in the R band. J. Mat. Chem. C 2, 9406–9411. doi:10.1039/c4tc01540a
Wen, Fusheng, Zhang, Fang, and Liu, Zhongyuan (2011). Investigation on microwave absorption properties for multiwalled carbon nanotubes/Fe/Co/Ni nanopowders as lightweight Absorbers. J. Phys. Chem. C 115 (29), 14025–14030. doi:10.1021/jp202078p
Zaaba etJaafar, N. F. M. (2020). A review on degradation mechanisms of polylactic acid: Hydrolytic, photodegradative, microbial, and enzymatic degradation. Polym. Eng. Sci. 60, 2061–2075. n° %19. doi:10.1002/pen.25511
Keywords: lossy dielectric, conductive polymer, corrugated surface, low profile, microwave absorption, EMI shielding, optimization
Citation: Huynen I (2022) Investigation of corrugated profiles in thin lossy dielectric slabs for wideband absorption up to 100 GHz. Front. Mater. 9:1040753. doi: 10.3389/fmats.2022.1040753
Received: 09 September 2022; Accepted: 24 October 2022;
Published: 04 November 2022.
Edited by:
Reza Peymanfar, Energy Institute of Higher Education, IranReviewed by:
Guangbin Ji, Nanjing University of Aeronautics and Astronautics, ChinaCopyright © 2022 Huynen. This is an open-access article distributed under the terms of the Creative Commons Attribution License (CC BY). The use, distribution or reproduction in other forums is permitted, provided the original author(s) and the copyright owner(s) are credited and that the original publication in this journal is cited, in accordance with accepted academic practice. No use, distribution or reproduction is permitted which does not comply with these terms.
*Correspondence: Isabelle Huynen, aXNhYmVsbGUuaHV5bmVuQHVjbG91dmFpbi5iZQ==
Disclaimer: All claims expressed in this article are solely those of the authors and do not necessarily represent those of their affiliated organizations, or those of the publisher, the editors and the reviewers. Any product that may be evaluated in this article or claim that may be made by its manufacturer is not guaranteed or endorsed by the publisher.
Research integrity at Frontiers
Learn more about the work of our research integrity team to safeguard the quality of each article we publish.