 Shaojie Chen
 Jianxi Ren1
 Xiang Ren
94% of researchers rate our articles as excellent or good
Learn more about the work of our research integrity team to safeguard the quality of each article we publish.
Find out more
ORIGINAL RESEARCH article
Front. Mater., 23 September 2022
Sec. Structural Materials
Volume 9 - 2022 | https://doi.org/10.3389/fmats.2022.1003945
This article is part of the Research TopicAdvanced Composite Materials and Technologies for Sustainable StructuresView all 6 articles
To investigate the deterioration laws of concrete durability under the coupling action of salt erosion and drying–wetting cycles, this study evaluated the macro–performance evolution of concrete under different environments (NaCl, Na2SO4, and MgSO4). Several measuring methods including nuclear magnetic resonance, computerized tomography tests, and microscopic morphology analysis are employed to investigate the damage mechanism of concrete. Experimental results show that with the action of salt erosion and drying–wetting cycles, the mass loss rate of concrete decreased first and then increased, and the relative dynamic modulus of elasticity and the compressive strength increased first and then decreased. The porosity and the pore quantity fluctuation increased. During the whole erosion process, needle-like attack products were formed in the pores, the crystals gradually filled the pores, and generated expansion pressure on the pore wall. As a result, concrete damage gradually occurred. Consequently, the damage degree was greater. The degrees of concrete damage under drying–wetting cycles induced were arranged as MgSO4>Na2SO4>NaCl.
Concrete materials are widely used in important engineering applications. However, many concrete structures experience reduced durability, deterioration, and even failure in the service process (Alexander and Thomas, 2015). The factors influencing concrete durability are divided into internal and external factors, with the former mainly including concrete composition and properties, such as water–binder ratio, aggregates, and additives; and with the latter mainly including concrete service conditions, such as temperature, humidity, stress, and environment erosion (Pan et al., 2016; Beushausen et al., 2019). The concrete damage being induced by salt erosion is one of the important factors that lead to concrete durability problems (Ma et al., 2010; Jiang et al., 2014; Alyami et al., 2019; Alyami et al., 2021). Different salts have different erosion mechanisms. Chloride ions react with hydration products to form Friedel’s salt (Balonis et al., 2010), and sulfate ions react with hydration products to form gypsum and ettringite (Sakr et al., 2020). These erosion products can change the properties of cement paste and pore structure, resulting in damage to concrete.
However, concrete structures in some regions are not only eroded by salt but also affected by humidity changes, such as those observed in the interface between structures and soil or water surfaces. Structures are usually under the coupling action of salt erosion and humidity variations as tide or water levels change (Siad et al., 2015; Valencia Saavedra et al., 2016; Guo et al., 2019). Existing studies have shown that the degree of salt erosion of concrete becomes more serious under drying–wetting cyclic actions than under long-term immersion (Aguirre and de Gutiérrez, 2013); the same is explained by the high damage degree of concrete structures near the interface (Di-tao et al., 2015; Steindl et al., 2020). Therefore, some scholars have investigated concrete durability under the coupling action of salt erosion and drying–wetting cycles. LOSER et al. (Loser and Leemann, 2016) conducted drying–wetting cyclic tests at different times in different sulfate liquors and probed the sulfate erosion resistance of concrete by testing the concrete expansion laws after erosion. YUAN et al. (Xiao-Lu et al., 2009) studied the evolution rules of concrete mass loss rate, compressive strength, and diffusion of erosive ions under the coupling action of sulfate attack and drying–wetting cycles and explored concrete microstructure and material composition after erosion by means of SEM and energy spectrum analysis. They found that changes in concrete performance under the action of sulfate and drying–wetting cycles are divided into two phases, namely, improvement in the initial phase and deterioration in the later phase. It can be seen that the fruitful results have been achieved with regard to concrete durability deterioration under salt erosion. However, these results mainly cover the macro-mechanical properties, microstructure, and chemical components of concrete. These studies have difficulty revealing the meso-evolutionary characteristics of eroded concrete from the perspectives of pore structure and compactness.
Therefore, some scholars have analyzed the concrete mesostructure using computerized tomography (CT) and nuclear magnetic resonance (NMR). TIAN et al. (Tian and Han, 2016) performed a CT scan of concrete under the freezing–thawing cyclic action and explored the relationship between internal pore structural evolution and the macro-mechanical properties of concrete by analyzing porosity and pore distribution. Zhang et al. (2017) used NMR technology to determine the characteristic parameters of concrete pores and analyzed the evolution rules of pore size distribution with the drying–wetting cyclic erosion time. However, these studies mainly focus on the change laws of concrete pore structure under a certain environment or a certain salt erosion environment, and there are few systematic studies on the durability deterioration mechanism of concrete under the combined action of different salts and drying–wetting cycles.
On this basis, this study experimentally investigated the deterioration of concrete durability under the coupling action of erosion of different salts (NaCl, Na2SO4, and MgSO4) and drying–wetting cycles. In addition, meso-testing methods, such as NMR, CT, and SEM were combined to comprehensively analyze the laws of concrete deterioration from three aspects: macro-deterioration characteristics, the pore structure evolution characteristics and microstructure changes. The results are expected to lay a foundation for further studying the concrete damage mechanism under salt erosion and drying–wetting cycles.
P·O 42.5 R cement was used in the test, and its concrete physical properties and chemical components are presented in Table 1.
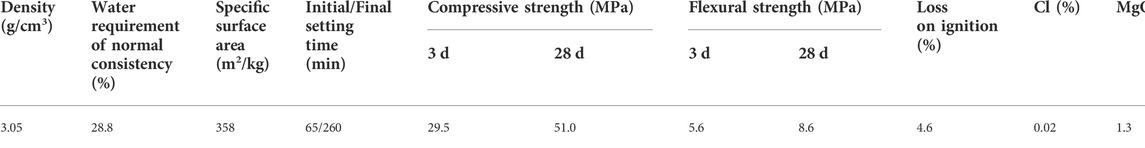
TABLE 1. Basic parameters of cement.
The coarse aggregate was ordinary gravel, and its physical properties are listed in Table 2. The fine aggregate was ordinary river sand with a fineness modulus of 2.7, its concrete physical properties are shown in Table 3.

TABLE 2. Basic parameters of gravel.

TABLE 3. Basic parameters of sand.
The specimens of two dimensions, namely, 100 mm × 100 mm × 400 mm prismoid and 100 mm × 100 mm × 100 mm cube, were fabricated. The mix proportions of concrete are presented in Table 4. According to the material utilization amounts in the mix proportion of concrete, stone, sand, and cement were stirred evenly in a mixer and then fully mixed after the addition of water. The specimen materials formed were poured and vibrated in concrete molds with different dimensions.
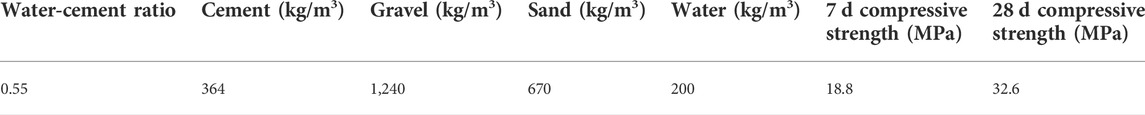
TABLE 4. Concrete mix proportions and mechanical properties.
The specimen codes of different solution environments are presented in Table 5.
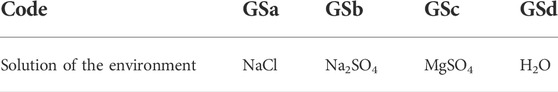
TABLE 5. Specimen codes of different solution environments.
A common drying test method for concrete is to dry it with a drying equipment at a high temperature (80°C) to shorten the drying time. However, the high–temperature drying process generates a certain influence inside the concrete, and such high temperature cannot be reached in practical engineering. Therefore, this study simulated the drying–wetting cycle in the experiment by combining immersion at a normal temperature and natural drying to align with engineering practice. Prior to the design of the drying–wetting cycling plan for concrete, three dry 100 mm × 100 mm × 400 mm concrete prismoids were selected. The reasonable drying–wetting cycling system was then explored through water absorption in an immersion test and water loss in a natural drying test. The evolution in the water absorption of concrete during the immersion process is shown in Figure 1.
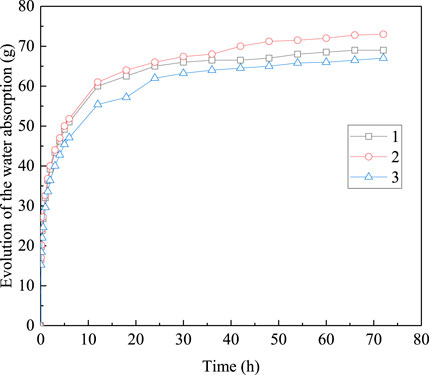
FIGURE 1. Water absorption of concrete in immersion process.
As shown in Figure 1, the mass changes were divided into two phases: rapid increase in mass (Phase I) and reduction in mass by a large margin (Phase II). The test data show that concrete mass was stable after 48 h of immersion.
The evolution in the water loss of concrete during the air–drying process is displayed in Figure 2. The mass rapidly reduced in the initial phase and then slowed down after a certain period before finally becoming stable. According to the test data, the change in concrete mass was stable after 96 h of drying.
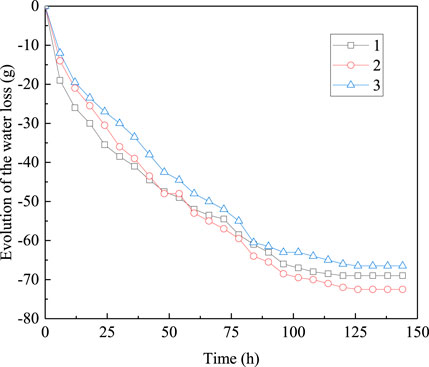
FIGURE 2. Water loss of concrete in drying process.
Therefore, the following drying–wetting cycling plan was determined according to the water absorption and drying test results: each test block was immersed in the solution for 2 days, followed by drying in a natural environment for 4 days, with every 6 days constituting a complete cycle.
As for the test programming design for salt erosion and drying–wetting cycles, the concrete erosion laws under different saline environments—NaCl, Na2SO4, and MgSO4—were mainly considered and compared with those in a clear water environment. The testing program was as follows: for every five cycles (30 days), one group of test specimens comprising three prismoids and three cubes were collected to test their indexes; three cubes were reserved for the compressive strength test. The solution concentration of each group was 5%, and the solution was re-prepared after every five cycles to maintain the stability of the solution concentration.
The masses of the concrete prismoids and cubes were tested using a digital electronic weigher. The mean value of one group of test specimens (three) was taken as the testing mass, and the mass loss rate was calculated through the following formula:
where
The test was performed using an NM-4B nonmetal acoustic wave tester, and the relative dynamic modulus of elasticity (RDME) of concrete after different drying–wetting cyclic erosion times was calculated by acquiring the acoustic wave transit time and wave velocity when the ultrasonic wave penetrated the concrete prismoids (Qian-Hui et al., 2019).
where Er is the RDME; En and E0 are the dynamic elasticity moduli of the concrete specimen after and before the damage, respectively; Vn and V0 are the ultrasonic wave velocities of the concrete specimen after and before the damage, respectively; and tn and t0 are the acoustic wave transit times of the concrete specimen after and before the damage, respectively.
The test was conducted using an NMC12-010V NMR system with the following settings: magnet temperature of 32°C, magnetic field intensity of 0.3 ± 0.05 T, precision of ±0.1°C, and probe diameter of 150 mm. After each test period, three concrete cubes were collected from each group for use in the NMR test. The cubes were wrapped with plastic film during the test period, and the test specimens were kept under the saturation state.
Brilliance iCT 256-Slice Spiral Speed CT machine produced by Philips was used. The scanning parameters were as follows: voltage of 120 kV and current of 117 mA. Then, 100 mm × 100 mm × 100 mm test cubes were selected and scanned, and the slice thickness was 1 mm.
The mass loss rate changes of the concrete specimens in different groups after the salt erosion and drying–wetting cycles are shown in Figure 3.

FIGURE 3. Evolution of the mass loss rate.
The mass loss rate of each group of concrete showed a trend of first decreasing and then increasing. It can be divided into lower section, fluctuation section, and increase section. The two landmark inflection points were 60 and 150 days, respectively. The mass loss rate of each group showed a decreasing trend before 60 days. The mass loss rates of GSa, GSb, GSc, and GSd groups decreased to −0.58%, −0.49%, −0.04%, and −0.30%, respectively, after drying–wetting cycle erosion for 60 days. The mass loss rate fluctuated from 60 days to 150 days, gradually increased after 150 days, and increased to −0.32%, −0.26%, 0.28%, and 0.03% at 240 days. In the initial stage of erosion, rehydration occurred in the concrete, and its compactness increased (Cheng-Gong et al., 2021). Thus, the mass loss rate decreased. As drying–wetting cycle circulation continued, the mass loss rate of concrete fluctuated within a certain range. At this stage, the erosion products in the concrete continuously filled the internal pores and cracks, and the mass loss rate decreased. When the expansion force of the erosion products reached a certain limit, the surface slurry began to peel off, and the mass loss rate increased. Such reciprocating caused the fluctuation of the mass loss rate, which was similar to the results in reference (Ren et al., 2020). The mass loss rate gradually increased in the late stage of drying–wetting cycle erosion. On the one hand, the original connected pores gradually decreased after the hydration reaction reached a certain degree, and the overall humidity of concrete decreased (Zhang et al., 2012). On the other hand, the mass loss rate increased considering the crystallization expansion of erosion products and drying shrinkage of concrete resulting in micro cracks and spalling of concrete.
Compared with the evolution law of concrete mass loss rate under different erosion environments, the evolution trends of GSa, GSb, and GSd groups were relatively close, but the increase and decrease of GSd group were small in terms of change amplitude. The reasons were mainly considered in two aspects. First, the density of NaCl and Na2SO4 solution was greater than that of H2O. Thus, the mass of concrete absorbing the same volume of H2O was less than that of the two other solutions. Second, concrete absorbed the surrounding liquid mainly through capillary pores. The adsorption capacity of capillary pores was stronger when the concentration differences between the interior and the environment were greater. Therefore, concrete in NaCl and Na2SO4 environment absorbed more solution than that in H2O environment (Gong et al., 2011). The variation in mass loss rate in GSc was significantly different from those in the two other salt environments. The main reason was that the erosion of Mg2+ would form non-cementing material M–S–H, which gradually transformed the matrix of cement paste into weak material and accelerated dissolution (Liang and Yuan, 2007). This phenomenon resulted in a large increase in mass loss rate, which was confirmed in the subsequent analysis of erosion products. According to the variation in mass loss rate, the mass loss rate of concrete under drying–wetting cycle erosion was a dynamic process, and the overall law was first reduced and then increased.
The change laws in the RDME of concrete in the different erosion environments are presented in Figure 4.
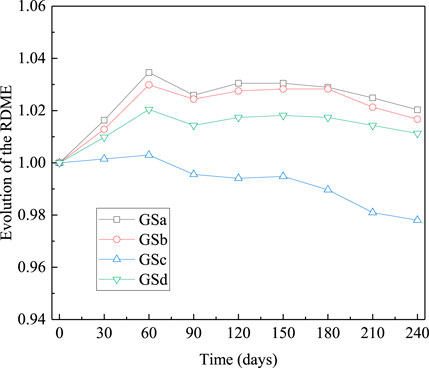
FIGURE 4. Evolution of the RDME.
The overall trend of RDME of concrete under the action of drying–wetting cycles was first increasing and then decreasing. Similar to the evolution law of mass loss rate, the hydration reaction of concrete in the early stage of erosion was more sufficient, and the material was denser. Thus, the RDME increased. Under the same erosion time, the erosion products of GSa and GSb group filled some pores and micro cracks, which increased the density of concrete to a certain extent (Zu-Quan et al., 2006). Thus, the RDME increased more than that of GSd group. At this stage, the increase in GSc group was the smallest, which meant that the double corrosion of SO42− and Mg2+ on concrete was obvious, and it had appeared from the early stage of drying–wetting cycles. With the increase in erosion time, salt continued to transmit to the concrete, and the erosion products gradually increased. Cracks would be formed when the expansion stress exceeded the tensile strength of concrete. Therefore, the erosion damage gradually appeared, and the RDME gradually decreased. The variation in RDME indicated that the damage of concrete in GSc group was the fastest. The damage degree of GSb group was slightly larger than that of GSa group at the later stage of erosion, which implied that the corrosion effect of sulfate ions was greater than that of chloride ions. The RDME of GSd group decreased slightly, which might be due to the partial shrinkage crack caused by drying–wetting cycles.
The evolution of compressive strength is presented in Figure 5.
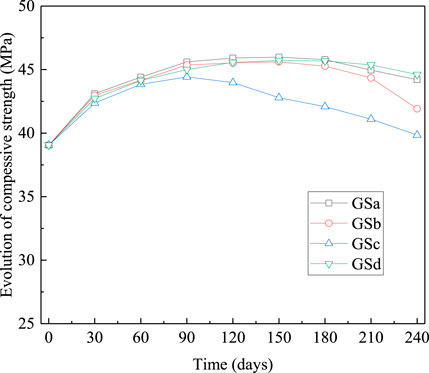
FIGURE 5. Evolution of the compressive strength.
The compressive strengths of the concrete specimens in the different groups first increased and then decreased as the erosion time lengthened. The strength of GSa, GSb, and GSd groups increased slowly in the period of 90–180 days, and the strength of GSa, GSb, and GSd groups decreased slowly after 180 days. The compressive strength of GSc increased gradually before 90 days and decreased gradually after 90 days. At 240 days, the compression strengths in the groups were sorted in descending order as follows: GSd > GSa > GSb > GSc group, and the compressive strength of GSa, GSb and GSc are respectively 99.09%, 93.96% and 89.31% of GSd.
The NMR test can be used to analyze the microscopic pore structure evolution process inside concrete, and it is related to the H proton; thus, the liquid-containing pores in the concrete were mainly tested. The T2 spectra obtained through the NMR test reflected the internal pore size distribution in the concrete. The spectral peak position was associated with pore size, and the spectral area was correlated with pore quantity (Shen et al., 2020).
The T2 spectra of the concrete specimens in the different groups after the salt erosion and drying–wetting cycles are shown in Figure 6.
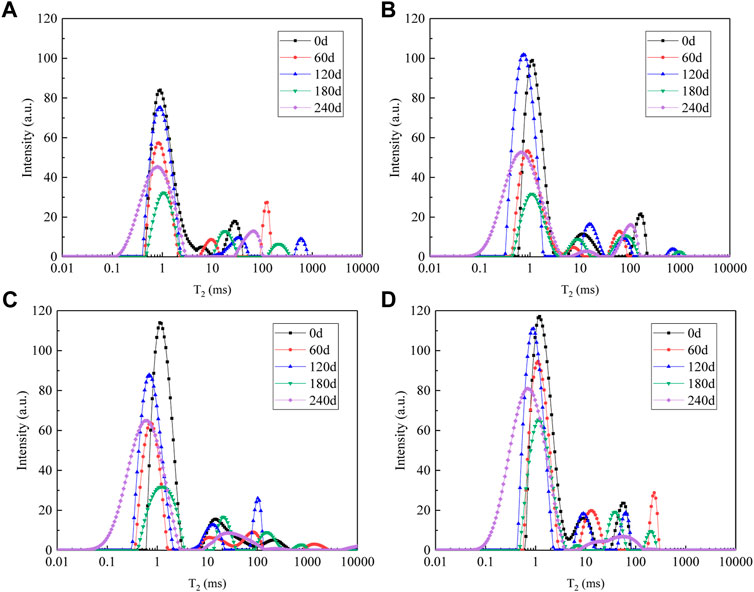
FIGURE 6. T2 spectral distribution diagram of the concrete specimens; (A) GSa; (B) GSb; (C) GSc; (D) GSd.
As shown in Figure 6, each concrete specimen consisted of three peaks, namely, micropores, small pores, and macropores, from the left to the right along the relaxation time. The T2 spectral distribution indicated that the micropores accounted for the largest proportion in the concrete and after the drying–wetting cyclic erosion, the T2 spectral distribution diagram experienced obvious changes. Before erosion test, the relaxation time ranges of GSa, GSb, GSc, and GSd groups were 0.79–191.16 ms, 0.60–219.64 ms, 0.64–439.76 ms, and 0.64–77.53 ms, respectively. When the erosion reaches 240 days, their relaxation time ranges were 0.24–109.70 ms, 0.01–155.22 ms, 0.01–471.38 ms, and 0.04–333.13 ms. The relaxation time ranges of GSa and GSb groups before and after erosion shifted to the left as a whole, and the relaxation time ranges of GSc and GSd groups increased.
The relaxation time of the first peak of each group is shown in Figure 7. The relaxation time of the first peak of each group showed a fluctuating trend of decreasing, increasing, and decreasing. This result meant that the pore size of the pores in the early stage of erosion gradually decreased, and micropores gradually transformed to larger pores after erosion to a certain extent. Combined with the T2 spectrum distribution, it also showed that, although the relaxation time at the peak of the first peak decreased at 240 days, the relaxation time range and envelope area of the first peak were larger as the erosion continued. Therefore, newer micropores were generated inside the concrete.
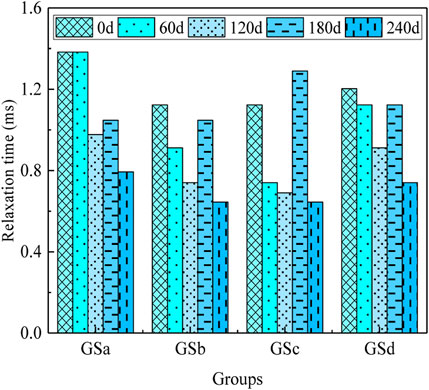
FIGURE 7. Relaxation time of the first peak.
The T2 spectral distribution can also reflect the proportion of pore size and corresponding pores. The existing literature shows that T2 relaxation time is proportional to pore structure characteristics (Liu et al., 2020):
Assuming that the internal pore of concrete is a sphere, the transformation relationship between T2 relaxation time and liquid-containing pore size is
where
Academician WU (Wu, 1979) classified holes in concrete into four categories according to pore size range: harmless pore (< 20 nm), less harmful pore (20–50 nm), harmful pore (50–200 nm), more harmful pore (> 200 nm). Nuclear magnetic resonance data of each group of concrete pores were divided, as shown in Figure 8, according to the division principle.
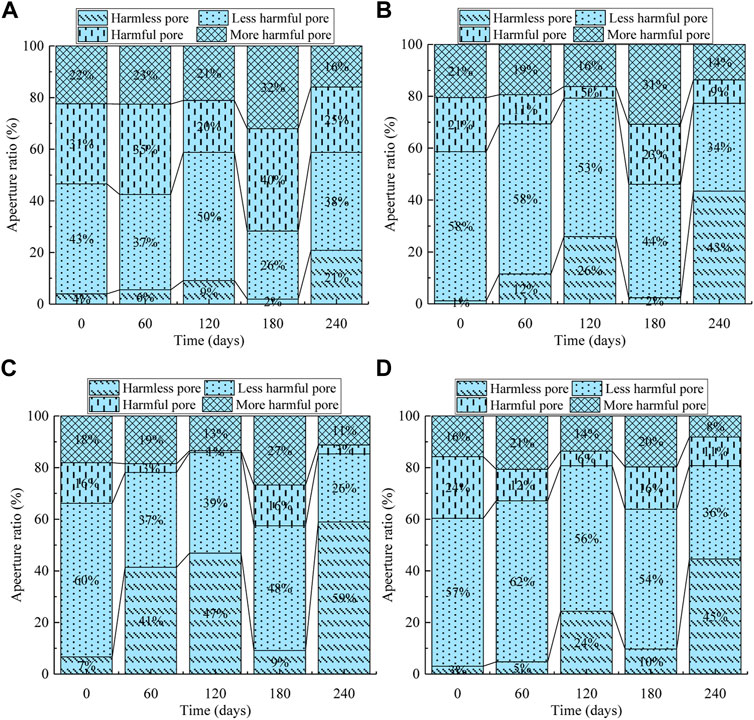
FIGURE 8. Aperture type of concrete at different erosion times; (A) GSa; (B) GSb; (C) GSc; (D) GSd.
As shown in Figure 8, the proportion of less harmful pores in each group of concrete before erosion was the largest, and the proportions of GSa, GSb, GSc, and GSd groups were 43%, 58%, 60%, and 57%, respectively. During the erosion period from 0 day to 120 days, the total proportion of harmful pores and more harmful pores in the GSa group showed a fluctuating decreasing trend, and the remaining groups were gradually reduced. Therefore, the liquid-containing pore structure in the early stage of drying–wetting cycle erosion was gradually optimized with the increasing degree of rehydration reaction, and some harmful pores were transformed into less harmful pores. With the increase in erosion time, the damage of concrete gradually appeared, and the proportion of harmful pores and harmful pores in each group increased significantly at 180 days. The proportion of harmful pores and more harmful pores decreased when the erosion reached 240 days. The main reason was that more harmless pores were produced during the erosion process, which decreased the proportion of harmful pores and more harmful pores. In the late stage of drying–wetting cycle erosion, the harmless pores in the concrete gradually transformed into harmful pores, and then, new harmless pores were produced. In this way, the reciprocating cycle would cause the fatigue damage of concrete in drying–wetting cycles, and it ultimately affected its macroscopic physical and mechanical properties.
The NMR test was mainly aimed at the liquid-containing pores in concrete, but it failed in the analysis of the overall pore evolution laws inside concrete. Thus, it was combined with the CT test in this study to analyze the mesoscopic pore structure process of concrete under the coupling action of salt erosion and drying–wetting cycles.
The VG Studio software was used to reconstruct concrete specimens in different erosive environments on the basis of the CT data. The pore structures of the final erosion states of the concrete test specimens in the different groups are displayed in Figure 9.
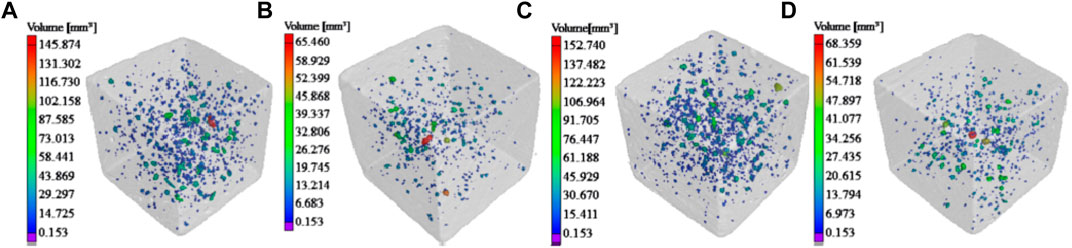
FIGURE 9. Pore graph of final erosion states of concrete test specimens; (A) GSa; (B) GSb; (C) GSc; (D) GSd.
The gray profile in the graphs represents the overall morphology of concrete. Regions in different colors in the profile represent pores of different volumes. The left tag reflects volume size of different colors. Clearly, Pore analysis could clearly show the distribution of pore structure in the sample, which provided support for further quantitative analysis of pore structure.
The porosity changes of the test specimens in the different groups are shown in Figure 10. In the GSa group, the average porosity was initially 0.45%, that after 120 days of drying–wetting cyclic erosion was 0.46% with an increase amplitude of 1.87%, and that at 240 days was 0.48% with an increase amplitude of 5.28%. In the GSb group, the average porosity was initially 0.26%, that at 120 days was 0.28% with an increase amplitude of 8.64%, and that at 240 days was 0.284% with an increase amplitude of 10.23%. In the GSc group, the average porosity was initially 0.44%, that at 120 days was 0.49% with an increase amplitude of 11.25%, and that at 240 days was 0.52% with an increase amplitude of 18.63%. In the GSd group, the average porosity was initially 0.18%, that at 120 days was 0.20% with an increase amplitude of 10.43%, and that at 240 days was 0.21% with an increase amplitude of 14.65%. The porosity of concrete specimen fluctuation increased with the rise in drying–wetting cycle erosion time. However, the overall increase was small. After erosion to 240 days, the increase amplitude of porosity was sorted in a descending order as follows: GSc > GSd > GSb > GSa group.
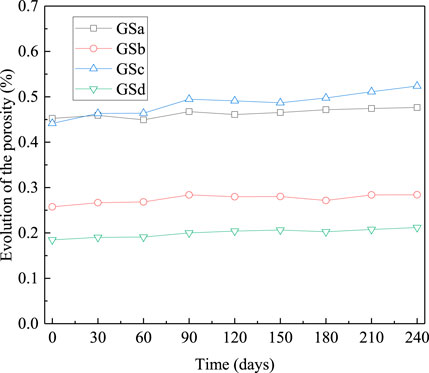
FIGURE 10. Evolution of the porosity.
The pore quantity in the different groups is presented in Figure 11. Within the first 30 days of erosion, the pore quantity rapidly increased, and it declined somehow at day 60. The pore of GSa, GSb, and GSc groups showed a fluctuation increasing trend after 60 days of erosion, while the fluctuation margin of GSd group was relatively small. At the same time, the increase in pore quantity and porosity in GSc group was greater than that in other groups, which indicated that the effect of MgSO4 on porosity was greater.
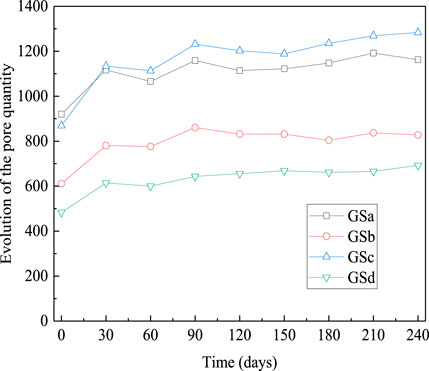
FIGURE 11. Pore quantity evolution of concrete.
The concrete expanded with the increase in humidity during the wetting process, and the concrete shrank with the decrease in humidity during the drying process (Gao et al., 2012). During the repeated moisture expansion and drying shrinkage, micropores or micro cracks may occur inside the concrete, which resulted in the increase in the number and porosity of pores. The evolution of this drying–wetting damage was more complex when the solution was accompanied by salt. On the one hand, the existence of salt increased liquid absorption in the wetting process, which intensified the moisture expansion effect of concrete and accelerated the formation of new pores. On the other hand, salt and its erosion products filled some pores, which reduced the increase rate of pore quantity and porosity. When the erosion products were filled to a certain extent, they would produce expansion force on the original pores and promoted the further generation of pores.
The microstructure of concrete aggregate and matrix is presented in Figure 12, where GS0 is the code of the specimen without erosion.

FIGURE 12. Microstructure of aggregate and matrix of concrete; (A) GS0; (B) GSa; (C) GSb; (D) GSc; (E) GSd.
As shown in Figure 12, more pores were found in the microstructure of concrete before drying–wetting cycle erosion, and the matrix material was loose. After 240 days of erosion, the microstructure of concrete under different erosion environments showed different damage characteristics. The observation of cracks revealed no obvious cracks in the interfacial transition zone (ITZ) of GSa, GSb, and GSd groups, but cracks were generated in the matrix materials, and cracks were generated in the ITZ and matrix materials of GSc group. In terms of the compactness of the matrix materials, the compactness of the matrix materials in GSa and GSd groups was better than that before erosion. It reflected that the solution entered the interior of the concrete during the drying–wetting cycles, which promoted the further reaction of incomplete hydration materials. After erosion, more pores were observed in the matrix materials of GSb and GSc groups, and the matrix materials of GSc group were loose. Therefore, Na2SO4 and MgSO4 had obvious corrosion effect on concrete matrix materials, especially MgSO4.
The microstructure of concrete erosion products in each group is presented in Figure 13.
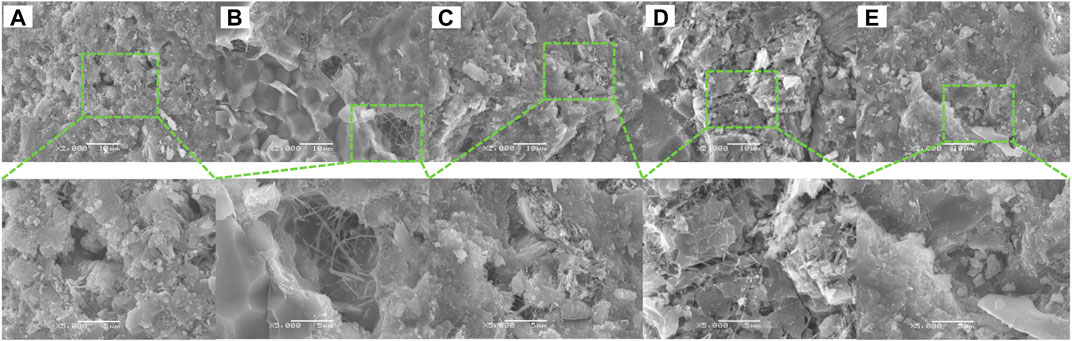
FIGURE 13. Microstructure of concrete erosion products; (A) GS0; (B) GSa; (C) GSb; (D) GSc; (E) GSd.
As shown in Figure 13, many pores were found in the hydration products of concrete under the initial state, and the width of larger pore was approximately 5 μm. No obvious crystallization product was observed around the pores. After 240 days of erosion, a small amount of flocculent and needle-like ettringite were formed in the pores of GSa group, and the matrix materials around the pores were denser. More needle-like ettringite crystals could be observed on the surface of the concrete matrix in the GSb and GSc groups. The crystal diameter in the GSb group was large, and it was nearly filled with pores. In the GSc group, more pores were connected to become cracks, and the width was nearly 1–2 μm. The needle-like ettringite was filled in the cracks, and the matrix was layered and loose. The pores in GSd group were few, and no obvious crystals were observed.
The morphology of erosion products in the pores further confirmed the results of phase analysis. In the early stage of erosion, ettringite formed acicular crystals in the pores and filled the pores. Thus, the concrete became denser in the early stage of erosion. With the increase in erosion time, these erosion products gradually filled the pores and produced expansion pressure on the pore wall. When the pressure increased to a certain extent, cracks formed and concrete damage occurred (Wu et al., 2015). The evolution process of concrete microstructure in each group corresponds to the macroscopic physical and mechanical properties, and the damage mechanism was revealed from the microscopic point of view.
1) With the increase in drying–wetting cycle erosion time, the mass loss rate of concrete first decreased and then increased, and the RDME and compressive strength first increased and then decreased. The compressive strength of GSa, GSb and GSc are respectively 99.09%, 93.96%, and 89.31% of GSd after drying–wetting cycle erosion for 240 days. The analysis of the evolution laws of macro performance indicated that concrete deteriorated the fastest in MgSO4 solution under the action of drying-wetting cycles, and the corrosion effect of sulfate ion was greater than that of chloride ion.
2) In the early stage of erosion, the liquid-containing pore structure was gradually optimized, the pore size was gradually reduced, and some harmful pores were transformed into less harmful pores. After being eroded to a certain point, the small pores were gradually transformed into large pores, and the proportion of harmful pores and more harmful pores increased. With the continuous erosion, more new harmless pores were generated in the concrete, resulting in the decrease of the overall proportion of harmful pores and more harmful pores.
3) CT mesoscopic pore structure analysis indicated that the change process of porosity and pore quantity had certain volatility due to salt corrosion. The porosity and pore quantity of concrete showed an increasing trend with the action of drying–wetting cycles, and the increase amplitude in MgSO4 environment was greater than that of other groups, the increase amplitude was 14.65% after erosion for 240 days.
4) In the early stage of drying–wetting cycle erosion, ettringite formed needle-like crystals in the pores and filled the pores, the concrete became denser. These erosion products gradually filled the pores and generated expansion pressure on the pore wall with the increase in erosion time, which are fundamental causes of salt corrosion damages.
The original contributions presented in the study are included in the article/supplementary material, further inquiries can be directed to the corresponding author.
Conceptualization, JR and SC; methodology, SC; software, SC; validation, JR, YL, and XR; formal analysis, SC; investigation, SC; resources, JR; data curation, SC; writing—original draft preparation, SC; writing—review and editing, SC and YL; visualization, SC; supervision, JR; project administration, SC; funding acquisition, SC All authors have read and agreed to the published version of the manuscript.
This work was supported by the National Natural Science Foundation of China (No. 51868075, 51408484), and the Key R&D program of Shaanxi Province (No. 2018SF-359).
The authors declare that the research was conducted in the absence of any commercial or financial relationships that could be construed as a potential conflict of interest.
All claims expressed in this article are solely those of the authors and do not necessarily represent those of their affiliated organizations, or those of the publisher, the editors and the reviewers. Any product that may be evaluated in this article, or claim that may be made by its manufacturer, is not guaranteed or endorsed by the publisher.
Aguirre, A. M., and de Gutiérrez, R. M. (2013). Durabilidad del hormigón armado expuesto a condiciones agresivas. Mat. construcc. 63 (309), 7–38. doi:10.3989/mc.2013.00313
Alexander, M., and Thomas, M. (2015). Service life prediction and performance testing — current developments and practical applications. Cem. Concr. Res. 78, 155–164. doi:10.1016/j.cemconres.2015.05.013
Alyami, M. H., Alrashidi, R. S., Mosavi, H., Alyami, M. H., Alrashidi, R. S., Mosavi, H., et al. (2019). Potential accelerated test methods for physical sulfate attack on concrete. Constr. Build. Mater. 229, 116920. doi:10.1016/j.conbuildmat.2019.116920
Alyami, M. H., Mosavi, H., Alrashidi, R. S., Almarshoud, M. A., Ferraro, C. C., and Riding, K. A. (2021). Lab and field study of physical sulfate attack on concrete mixtures with supplementary cementitious materials. J. Mat. Civ. Eng. 33 (1), 04020397. doi:10.1061/(ASCE)MT.1943-5533.0003500
Balonis, M., Lothenbach, B., Le Saout, G., and Glasser, F. P. (2010). Impact of chloride on the mineralogy of hydrated Portland cement systems. Cem. Concr. Res. 40 (7), 1009–1022. doi:10.1016/j.cemconres.2010.03.002
Beushausen, H., Torrent, R., and Alexander, M. G. (2019). Performance-based approaches for concrete durability: State of the art and future research needs. Cem. Concr. Res. 119, 11–20. doi:10.1016/j.cemconres.2019.01.003
Cheng-Gong, L., Zhi-Qiang, W., Hong-Xia, Q., Cui-Zhen, X., and Fu, Y. (2021). Life prediction of reinforced concrete in saline soil based on wiener stochastic process [J]. Adv. Eng. Sci. 53 (01), 113–121. (in Chinese). doi:10.15961/j.jsuese.202000275
Di-tao, N., Wang, Y. D., Rui, M., Wang, J. B., and Shan-hua, X. (2015). Experiment study on the failure mechanism of dry-mix shotcrete under the combined actions of sulfate attack and drying–wetting cycles. Constr. Build. Mater. 81, 74–80. doi:10.1016/j.conbuildmat.2015.02.007
Gao, Y., Zhang, J., and Sun, W. (2012). Concrete deformation and interior humidity during dry-wet cycles [J]. J. Tsinghua Univ. Sci. Technol. 52 (2), 144–149. (in Chinese). doi:10.16511/j.cnki.qhdxxb.2012.02.009
Gong, C. W., Ge, Y., Liu, M. L., Wen-Qiang, Y., and Zeng, H. B. (2011). Volume absorption rate of non air-entrained concrete in different salt solution during freeze-thaw process [J]. Low. Temp. Archit. Technol. 33 (1), 5–7. (in Chinese). doi:10.3969/j.issn.1001-6864.2011.01.002
Guo, J. J., Wang, K., Guo, T., Yang, Z. Y., and Zhang, P. (2019). Effect of dry–wet ratio on properties of concrete under sulfate attack. Materials 12 (17), 2755. doi:10.3390/ma12172755
Jiang, L., Di-Tao, N., Ying-zhao, S., Qian-nan, F., and Fei, Q. N. (2014). Ultrasonic testing and microscopic analysis on concrete under sulfate attack and cyclic environment. J. Cent. South Univ. 21 (12), 4723–4731. doi:10.1007/s11771-014-2482-6
Liang, Y. N., and Yuan, Y. S. (2007). Mechanism of concrete destruction under sodium sulfate and magnesium sulfate solution [J]. J. Chin. Ceram. Soc. 35 (4), 504–508. (in Chinese). doi:10.3321/j.issn:0454-5648.2007.04.022
Liu, Q., Shen, X., Wei, L., Dong, R., and Xue, H. (2020). Grey model research based on the pore structure fractal and strength of NMR aeolian sand lightweight aggregate concrete. Jom 72 (1), 536–543. doi:10.1007/s11837-019-03887-w
Loser, R., and Leemann, A. (2016). An accelerated sulfate resistance test for concrete. Mat. Struct. 49 (8), 3445–3457. doi:10.1617/s11527-015-0731-2
Ma, K. L., Xie, Y. J., Guang-cheng, L., and Wu, K. G. (2010). Invading track of chloride ions in cemented-based materials. J. Cent. South Univ. Technol. 17 (2), 263–268. doi:10.1007/s11771-010-0040-4
Pan, H. K., Zi-sheng, Y., Fu-wei, X., and Xu, F. (2016). Study on concrete structure’s durability considering the interaction of multi-factors. Constr. Build. Mater. 118, 256–261. doi:10.1016/j.conbuildmat.2016.05.032
Qian, L., Shen, X. D., Xue, H. J., Wang, R. Y., Zheng, L., and Han, C. (2017). Experimental study on pore characteristics of different coarse aggregate concrete based on NMR technique [J]. J. Funct. Mater. 48 (10), 10066–10070. (in Chinese). doi:10.3969/j.issn.1001-9731.2017.10.011
Qian-Hui, X., Zhi-Yuan, C., Guan, X., Qiang, L., and Xiao-Lin, L. (2019). Damage to recycled concrete with different aggregate substitution rates from the coupled action of freeze-thaw cycles and sulfate attack. Constr. Build. Mater. 221, 74–83. doi:10.1016/j.conbuildmat.2019.06.060
Ren, J. G., Yuan-Ming, L., Rui-Qiang, B., and Ying-Hong, Q. (2020). The damage mechanism and failure prediction of concrete under wetting–drying cycles with sodium sulfate solution. Constr. Build. Mater. 264, 120525. doi:10.1016/j.conbuildmat.2020.120525
Sakr, M. R., Bassuoni, M. T., Hooton, R. D., Drimalas, T., Haynes, H., and Folliard, K. J. (2020). Physical salt attack on concrete: Mechanisms, influential factors, and protection [J]. ACI Mater. J. 117 (6), 253–268. doi:10.14359/51727015
Shen, Y. J., Wang, Y. Z., Xin, W., Jia, H. L., and Rui-xin, Y. (2020). Investigation on meso-debonding process of the sandstone–concrete interface induced by freeze–thaw cycles using NMR technology. Constr. Build. Mater. 252, 118962. doi:10.1016/j.conbuildmat.2020.118962
Siad, H., Lachemi, M., Bernard, S. K., Sahmaran, M., and Hossain, A. (2015). Assessment of the long-term performance of SCC incorporating different mineral admixtures in a magnesium sulphate environment. Constr. Build. Mater. 80, 141–154. doi:10.1016/j.conbuildmat.2015.01.067
Steindl, F. R., Galan, I., Baldermann, A., Sakoparnig, M., Briendl, L., Juhart, J., et al. (2020). Sulfate durability and leaching behaviour of dry- and wet-mix shotcrete mixes. Cem. Concr. Res. 137, 106180. doi:10.1016/j.cemconres.2020.106180
Tian, W., and Han, N. (2016). Evaluation of damage in concrete suffered freeze-thaw cycles by CT technique. J. Adv. Concr. Technol. 14 (11), 679–690. doi:10.3151/jact.14.679
Valencia Saavedra, W. G., Angulo, D. E., and Mejía de Gutiérrez, R. (2016). Fly ash slag geopolymer concrete: Resistance to sodium and magnesium sulfate attack. J. Mat. Civ. Eng. 28 (12), 04016148. doi:10.1061/(ASCE)MT.1943-5533.0001618
Wu, Z. M., Shi, C. J., Pei-Wei, G., De-Hui, W., and Zhang, C. (2015). Effects of deicing salts on the scaling resistance of concrete. J. Mat. Civ. Eng. 27 (5), 04014160. doi:10.1061/(ASCE)MT.1943-5533.0001106
Wu, Z. W. (1979). An approach to the recent trends of concrete science and technology [J]. J. Chin. Ceram. Soc. 1979 (3), 262–270. (in Chinese). doi:10.14062/j.issn.0454-5648.1979.03.010
Xiao-Lu, Y., Bei-xing, L., Gong, C., Zhao, S. C., and Zhou, M. K. (2009). Effect of mineral admixtures on durability of concrete in wetting-drying cyclic sulfate environment [J]. J. Chin. Ceram. Soc. 37 (10), 1754–1759. doi:10.3321/j.issn:0454-5648.2009.10.031
Zhang, J., Gao, Y., and Han, Y. D. (2012). Interior humidity of concrete under dry-wet cycles. J. Mat. Civ. Eng. 24 (3), 289–298. doi:10.1061/(ASCE)MT.1943-5533.0000382
Zhang, J. Z., Guo, J., Deng-hui, L., Zhang, Y. R., Fan, B., and Zhao-feng, F. (2017). The influence of admixture on chloride time-varying diffusivity and microstructure of concrete by low-field NMR. Ocean. Eng. 142, 94–101. doi:10.1016/j.oceaneng.2017.06.065
Keywords: concrete, salt erosion, drying-wetting cycle, pore structure, durability
Citation: Chen S, Ren J, Ren X and Li Y (2022) Deterioration laws of concrete durability under the coupling action of salt erosion and drying–wetting cycles. Front. Mater. 9:1003945. doi: 10.3389/fmats.2022.1003945
Received: 26 July 2022; Accepted: 29 August 2022;
Published: 23 September 2022.
Edited by:
Lili Hu, Shanghai Jiao Tong University, ChinaCopyright © 2022 Chen, Ren, Ren and Li. This is an open-access article distributed under the terms of the Creative Commons Attribution License (CC BY). The use, distribution or reproduction in other forums is permitted, provided the original author(s) and the copyright owner(s) are credited and that the original publication in this journal is cited, in accordance with accepted academic practice. No use, distribution or reproduction is permitted which does not comply with these terms.
*Correspondence: Shaojie Chen, Y3NqQHh1c3QuZWR1LmNu
Disclaimer: All claims expressed in this article are solely those of the authors and do not necessarily represent those of their affiliated organizations, or those of the publisher, the editors and the reviewers. Any product that may be evaluated in this article or claim that may be made by its manufacturer is not guaranteed or endorsed by the publisher.
Research integrity at Frontiers
Learn more about the work of our research integrity team to safeguard the quality of each article we publish.