 Xiang Ren
 Yunxiang Ding
 Qunfeng Liu
 Shaojie Chen
- Xi’an University of Science and Technology School of Architecture and Civil Engineering, Xi’an, China
The enhancement of the thermal conductivity can be utilized to reduce the temperature difference between the internal and external structural surfaces and thus the thermal induced stresses in concrete. This study investigated the compressive strength and thermal conductivity in concrete structures enhanced by the steel fiber and graphite at different volume fractions. First, the cubic and the cylinder concrete samples were fabricated by adding different volume fractions of the steel fibers, such as 0%, 0.5%, 1.0%, 1.5%, 2.0%, and 2.5%, to the concrete mixture. The fiber enhanced samples were tested following the standard procedures, and the optimal compressive strength and thermal conductivity can be obtained in the sample with the volume fraction of steel fiber at 1.5%. Moreover, graphite powders with different volume proportions at 5%, 10%, and 15% were added to the fiber enhanced concrete samples with identical size. The compressive strength and thermal conductivity tests were also performed and the optimal content of steel fiber was 1.5%, and the graphite was 5%. These results could not only meet the design requirements of the compressive strength of the concrete, but also improve the thermal conductivity of the concrete. The research could provide some reference for the design of the high thermal conductivity concrete.
1 Introduction
Large-span bridge structures are usually pivotal projects in transportation systems. Particularly, cable-bearing bridges, such as suspension bridges and cable-stayed bridges are the most common types of long-span bridges. The bridge pylon is an important structural component, most of which are hollow, thin-walled concrete structures. Under the natural environmental conditions, like sunlight radiation, daily temperature changes, cold currents and wind speed, the pylons will experience a significant temperature difference across the wall thickness due to the relatively poor thermal conductivity of concrete, thereby leading to considerable thermal stress in the concrete wall of the pylon. It was acknowledged that the thermal stress is the principal reason for the development of cracking in concrete pylon walls, which further affects their structural performance and durability (Liu, 1991; Zhang et al., 2017; Chen, 2018; Lei et al., 2019; Liu et al., 2019; Gu et al., 2020; Ren et al., 2021; Lin and Dou, 2022).
Over the years, extensive studies have been conducted on the thermal conductivity of concrete (Hamilton and Crosser, 1962; Campbell-Allen and Thorne, 1963; Harmathy, 1970). Tang et al. (2012a) investigated the effect of mesoscopic and macroscopic structures on the effective thermal conductivity of concrete. Based on the Weibull distribution assumption (Zhang et al., 2018), the non-homogeneity of the concrete can be considered from a mesoscopic viewpoint. Simulations of several non-homogeneous samples showed that the effective thermal conductivity was primarily dependent on the degree of non-homogeneity (Zhang et al., 2012; Xiao et al., 2013). The higher the homogeneity leads to the greater effective thermal conductivity (Du et al., 2014). From the macroscopic viewpoint, it was observed that the volume proportion of coarse aggregates had the most remarkable effect on the thermal conductivity of concrete (Kim et al., 2003; Tang et al., 2012b; Chang and Wang, 2017). Xiao et al. (2010) studied the effect of recycled coarse aggregate replacement rate on the thermal conductivity of recycled concrete. Deng (2008) found that the thermal conductivity of concrete increased with the increase of the aggregate content and the volume fraction of reinforcement.
Liu et al. (2012) and Sun et al. (2009) tested and analyzed the thermal conductivity of the steel fiber concrete and carbon fiber concrete. Li et al. (2007) investigated the effect of admixture on the thermal conductivity of the concrete using the heat transfer meter. The results showed that the fiber and admixture played a dominant role in the thermal conductivity of concrete. Zhang et al. (2015a) and Gu et al. (Zhang et al., 2015b) analyzed the influence of aggregate content and water-cement ratio on the thermal conductivity of concrete by experiments using the protective thermal plate method. The results showed that the thermal conductivity of concrete increased with the increase of the saturation, aggregate content, and volume the ratio.
To study the thermal conductivity of concrete in practical structures, Ren et al. (Ren et al., 2011a; Ren et al., 2011b; Ren and HuangHan, 2012) carried out on-site investigations on the bridge pylons of Yi Chang Jiang Bridge under the influence of sunshine temperature. They established an analytical model to estimate the maximum principal tensile stress under the loading of the temperature difference across the wall thickness of the pylon. Liu and Geng (2005) studied the effect of thermal parameters on the temperature difference for the concrete bridge in Shanghai, and they concluded that the enhanced thermal conductivity was beneficial in reducing the temperature difference within the concrete. Qu et al. (2019) improved the thermal conductivity of concrete by adding different graphite admixture and obtained an optimal admixture of graphite.
In order to improve the performance of concrete, many scholars at home and abroad have done research on the single doping of steel fiber or graphite and other materials Up to now, howerver, there are few reports on quantitative research on the thermal conductivity and compressive behavior of concrete under the action of steel fiber/graphite. This work investigates the thermal conductivity and compressive performance of the concrete after adding steel fiber or steel fiber/graphite materials by experiments. The results suggested that the optimal addition proportions for the steel fiber and the mixed steel fiber/graphite materials was the premise to meet the compressive strength requirement of the bridge pylon. The outcome also provides a guideline for the application of concrete enhanced by the steel fiber or the mixed steel fiber/graphite in concrete thin-walled box bridge pylons.
2 Specimen preparation and experimental setup
2.1 Materials
(1) Cement:
Yan-Ta brand silicate cement (P-O 42.5) was produced by a cement factory in Xi’an, China, with a standard consistency of 25.8% water requirement. According to Chinese standard (GB175-2007) (Common Portland cement, 2020) the technical properties of the cement were shown in Table 1
(2) Sand:
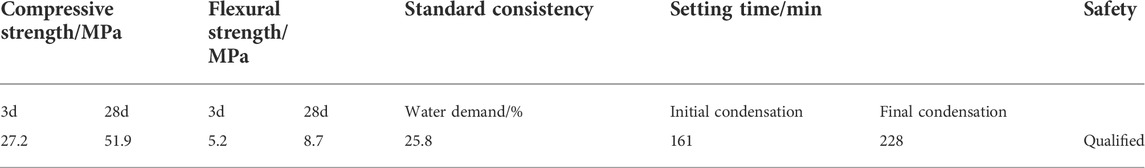
TABLE 1. Technical properties of the cement.
The sand was produced by Lintong Yard in Xi’an, China was used, with fineness modulus of 2.8, the apparent density of 2,640 kg/m3, bulk density of 1,460 kg/m3 and porosity of 43%.
(3) Crushed stone:
Crushed stone was produced by Lintong Yard in Xi’an, China, with apparent density of 2,740 kg/m3, bulk density of 1,420 kg/m3, crushing index of 9.6% and mud content of 0.2%.
(4) Water:
Water used for concrete meet the requirements of Chinese standard (JGJ6-2006) (Standard of water for concrete, 2006).
(5) Water reducing agent:
The polycarboxylic acid water was used as the water reducing agent produced by Weinan Qinfen Building Material Factory of China with a water reduction rate of 25% and a net slurry flow rate of 280. The value of properties supplied by the material factory as shown in Table 2.
(6) Graphite:
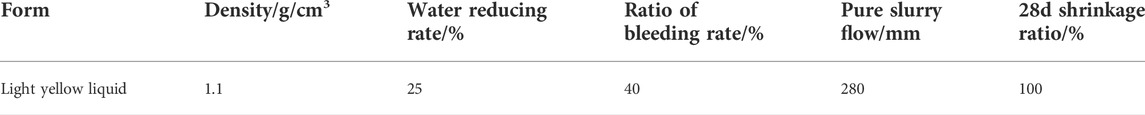
TABLE 2. Physical properties of the polycarboxylic acid water reducing agent.
Graphite used is the LA150-85-93 type 300 mesh scaled graphite powder with 44 μm particle size and 99.99% carbon content from Qingdao Heilong Graphite Co. of China, as shown in Figure 1A. The Main properties of the graphite powder were shown in Table 3.
(7) The end-hook Steel fiber was produced by Shanghai Shiweike Industry and Trade Co., as shown in Figure 1B. The value of properties supplied by the material factory is shown in Table 4.
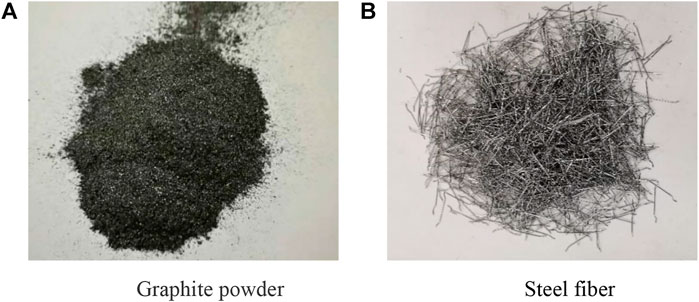
FIGURE 1. Physical drawing of mixed materials. (A) Graphite powder, (B) Steel fiber.

TABLE 3. Main properties of the mesh scaled graphite powder.

TABLE 4. Physical properties of the end hook steel fiber.
2.2 Preparation of specimens made of fiber-enhanced concrete
2.2.1 Mix proportion of the ordinary concrete
According to Chinese specifications (JGJ55-2011) (Specification, 2011), the concrete specimens were prepared and optimized under the following considerations.
2.2.1.1 Compressive strength
The target concrete for experiments is C40 with standard cubic compressive strength
As the compressive strength of concrete is less than 60 MPa, the concrete preparation strength can be calculated by the equation (Specification, 2011)
fcu,o----- Concrete preparation strength;fcu,k----- Cube compressive strength;σ----- Standard deviation of the concrete strength.
Standard deviation (σ) of the concrete strength as shown in Table 5, is calculated as:
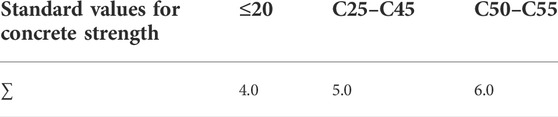
TABLE 5. Standard deviation of concrete strength (σ).
fcu,o = fcu,k + 1.645·σ = 40 + 1.645×5 = 48.23 MPa
2.2.1.2 Water binder ratio
W/b-----Water binder ratio of the concrete; γc ----- Redundancy coefficient of cement strength grade value; αa, αb----- Regression coefficient; fce,g----- Cement strength grade value (MPa). Redundancy coefficient of cement strength grade value (γc) as shown in Table 6. Regression coefficient αa αb value as shown in Table 7.
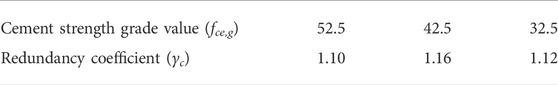
TABLE 6. Redundancy coefficient of cement strength grade value (γc).
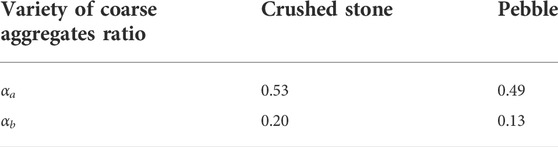
TABLE 7. Regression coefficient αa, αb value table.
The parameters were derived by taking them into Eq. 2.2:
The water binder ratio was 0.49 according to the mixing effect.
2.2.1.3 Water consumption per unit weight (kg)
mw0 ----- Water consumption per unitmw ----- Water consumption of the concreteβ----- Water reducing rate of water reducing agent
Crushed stones were used as coarse aggregate with diameters from 5 to 15 mm, the slump was 60 mm mw = 220 kg/m³ The water reducing rate of water reducing agent was 25%, derived from the Eq. 2.4: mw0 = 165 kg/m³, as listed in Table 8.
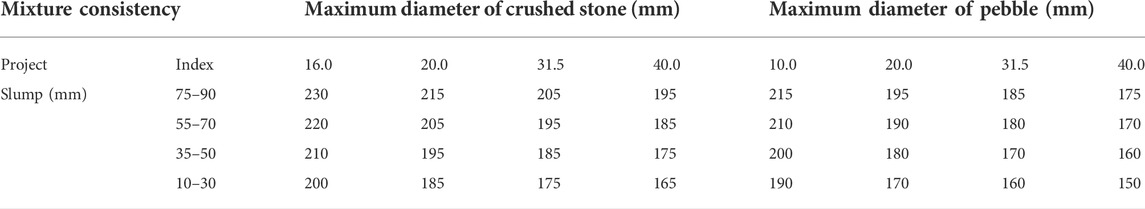
TABLE 8. Water consumption of the concrete (kg/m3).
2.2.1.4 Unit cement and additive quantity
mbo----Amount of cementitious material per cubic meter (kg/m3);mco ----- Amount of cement per cubic meter (kg/m3);mao ----- Amount of water reducing agent per cubic meter (kg/m3);mfo ----- Amount of mineral adhesives per cubic meter (kg/m3);βa ----- Water reducing agent in cement mass fraction (%).
According to Eq. 2.5, mco is 440 kg/m3 and mao is 6.195 kg/m3.
2.2.1.5 Sand ratio and aggregate consumption
Sand ratio of the concrete (%) as shown in Table 9.
βs ----- Sand ratio(%);
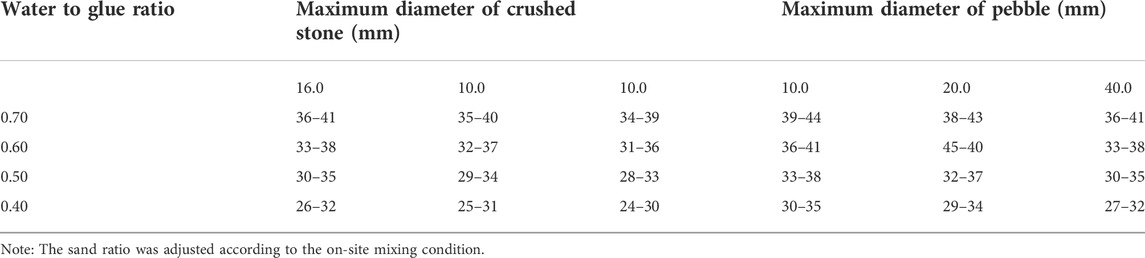
TABLE 9. Sand ratio of the concrete (%).
According to Eq. 2.6,
2.2.1.6 Trial and adjustment
Through test and trial adjustment, the basic concrete mix proportion is shown in Table 10.

TABLE 10. Mix proportion of concrete (
2.2.2 Mix proportion design for high thermal conductivity
2.2.2.1 Mix proportion for steel fibers in steel fiber enhanced concrete
Six groups of the steel fiber enhanced concrete (SFC) with different volume fractions of the steel fiber (Table 11) were designed to investigate the influence of varying volume fractions of the steel fiber on the compressive strength of the SFC.
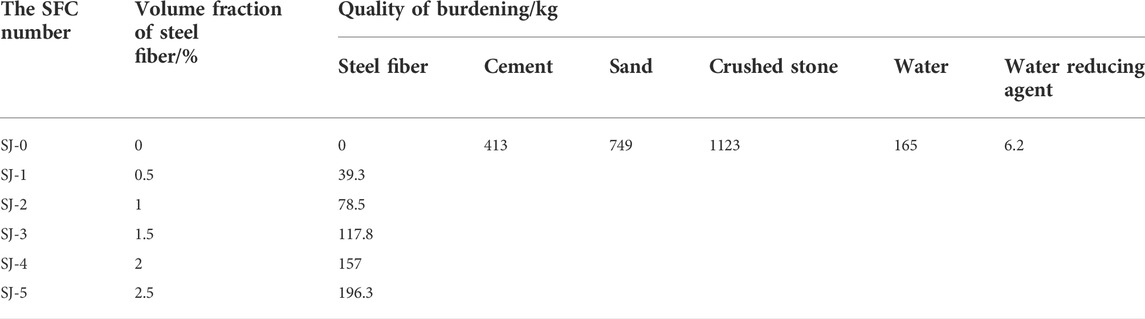
TABLE 11. Mix proportion of the SFC.
In this paper, the compressive strength of the SFC was obtained by changing the volume ratio of steel fiber in concrete.
Concrete cube compressive strength conversion formula:
F----- Ultimate load(N);A----- Compression area(mm2);0.95----- Size effect coefficient.
2.2.2.2 Mix proportion of steel fiber/graphite concrete with different volume fraction
Based on the test results of SFC, six groups of the steel fiber/graphite concrete (SFGC) with different steel fiber/graphite volume fraction was designed by adding three different graphite powders on the basis of 1.5% and 2.5% steel fiber volume fraction (Table 12).
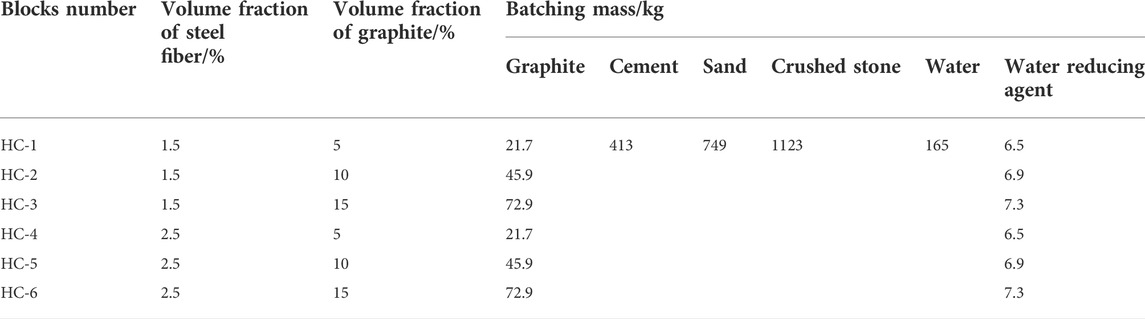
TABLE 12. Mix proportion of the SFGC.
Graphite was doped according to the internal adding law (Jia et al., 2010).
2.3 Experimental setups and fabrication of the test specimens
2.3.1 Experimental setups
2.3.1.1 Concrete mixer
HJW-60 single-horizontal axle forced concrete mixer, manufactured in China, was mainly used for concrete mixing. The equipment parameters were shown in Table13 and the picture was shown in Figure 2A.

TABLE 13. Main properties of single horizontal axle forced concrete mixer.
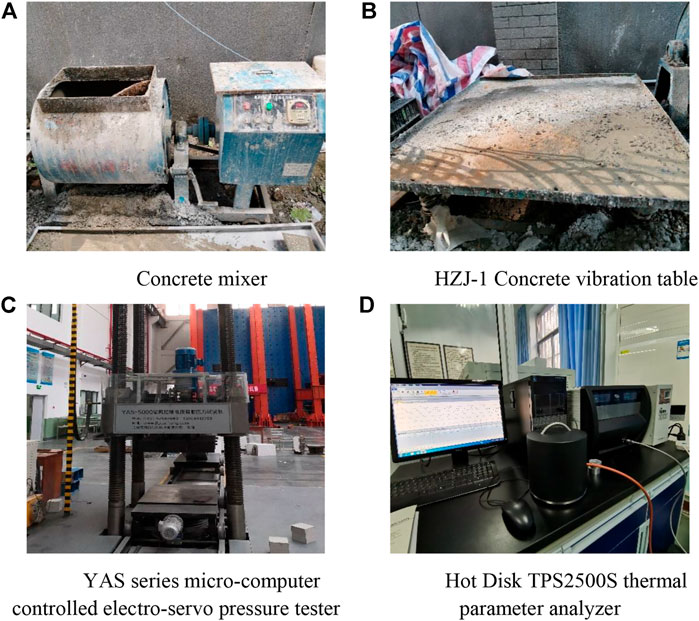
FIGURE 2. Test equipment. (A) Concrete mixer, (B) HZJ-1 concrete vibration table, (C) YAS series micro-computer controlled electro-servo pressure tester, (D) Hot Disk TPS2500S thermal parameter analyzer.
2.3.1.2 HZJ-1 Concrete vibration table
The table surface of the concrete shaking table was welded on the base frame, and the center of the table was fixed with the shaker and installed with the hanger coupling. The main parameters of the equipment were shown in Table 14 and the picture was shown in Figure 2B.

TABLE 14. Main properties of the concrete vibration table.
2.3.1.3 Strength testing equipment
YAS series servo press was used. The main machine of YAS series (four-pillar) servo press was a moving beam structure with adjustable compression space. The pressing plate was made into a trolley which could move along the guide rail and was convenient for loading and unloading large blocks. The main technical indexes were shown in Table 15 and the picture was shown in Figure 2C.

TABLE 15. Main properties of strength testing equipment.
2.3.1.4 Thermal conductivity testing equipment
Hot Disk TPS2500S thermal parameter analyzer was used, which was manufactured by Hot Disk, Sweden. The equipment consisted of test host, probe and sample fixture, which measured the thermal parameters (thermal conductivity, specific heat capacity, thermal diffusivity) of solids, powders and other materials under different temperature and humidity conditions. The main technical parameters were shown in Table 16, and the picture was shown in Figure 2D.

TABLE 16. Main properties of Hot Disk TPS2500S.
2.3.2 Fabrication of the test block
According to the Chinese Standard (GB/T 50080-2016) (Standard for test method, 2016), the cubic concrete specimens with the dimensions of 100 mm × 100 mm × 100 mm were fabricated, as shown in Figure 3A.
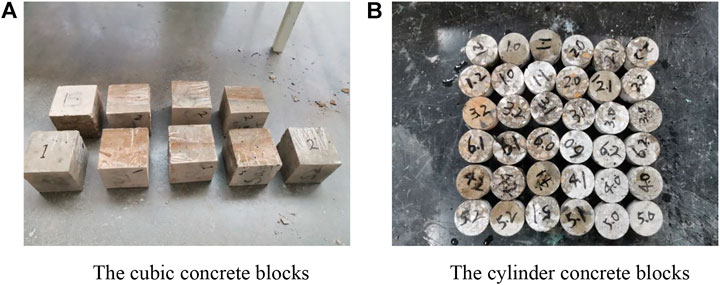
FIGURE 3. Experimental concrete blocks. (A) The cubic concrete blocks, (B) The cylinder concrete blocks.
The cylinder concrete blocks for thermal conductivity testing: A cylinder with a diameter of 5 cm and a height of 2.5 cm was required by this test instrument.
The cubic concrete blocks were placed into the core machine.
The cylindrical specimens with adiameter of 5 cm were drilled out of the concrete plates with a thickness of 10 cm.
Put the cylinder into the cutting machine and cut it into a cylinder 5 cm in diameter and 3 cm in height.
Put them into the grinder and ground them into a cylinder with a diameter of 5 cm and a height of 2.5cm, as shown in Figure 3B.
2.4 Test method
YAS-5000 servo press was used to test the compressive strength of the cubic concrete blocks, as shown in Figure 4A. Before the test, the press plate of the experiment machine needed to be raised through the operating handle, and then the cubic concrete blocks were put the at center of the pressure plate, and finally lowered the pressure plate to full and uniform contact with the cubic concrete blocks. The loading mode adopted displacement controls. First, a force of 5 kN was set to preload the cubic concrete blocks, so that the pressure surface of the experiment machine was in full contact with the surface of the cubic concrete blocks, and then adjusted the loading displacement rate that it was 0.005 mm/s. The data acquisition system interface was shown in Figure 4B. After the cubic concrete blocks were broken, the test machine would automatically stop and automatically record the load value at the failure moment.
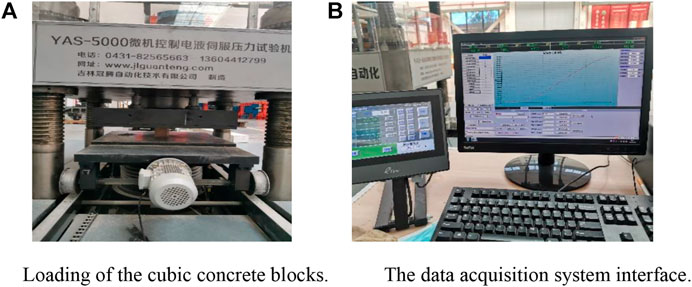
FIGURE 4. Compressive strength test of the cubic concrete blocks. (A) Loading of the cubic concrete blocks, (B) The data acquisition system interface.
Hot Disk TPS2500S thermal parameter analyzer was used to test the thermal conductivity of the cylinder concrete blocks, which was based on the transient plate heat source method, easy to operate, high test accuracy and fast time. The instrument was produced by Sweden’s Hot Disk and consisted of a test host, a probe and a sample fixing device, as shown in Figure 5.
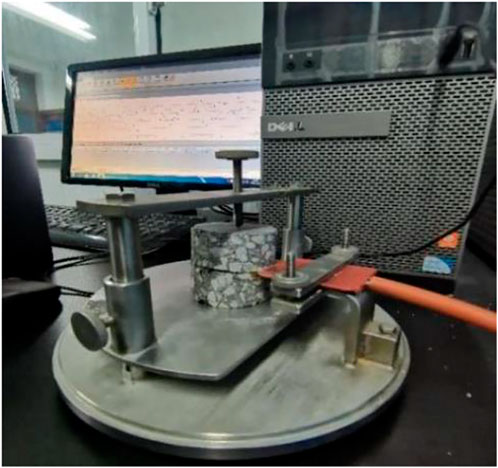
FIGURE 5. Thermal conductivity test of the cylinder concrete blocks.
3 Test results and discussion
3.1 The failure behaviors of the specimens
The failure behaviors of different concrete blocks were showed in Figure 6. The blocks mixed with steel fiber or steel fiber/graphite, had a long stress time. It was concluded that the compressive strength could be improved by adding steel fiber or steel fiber/graphite. When the compressive load exceeded the ultimate value, the ordinary concrete (OC) blocks were completely crushed as soon as cracks occurred. However, the OC blocks doped with steel fiber or steel fiber/graphite could delay the fracture process. When the compressive load exceeded the ultimate strength, multiple cracks nucleate simultaneously, propagate with load increasing, and crash in brittle manner. The results indicated that adding steel fiber material could not only improve the compressive strength of concrete, but also delay the failure time of the concrete. On the one hand, the SFC and SFGC are limited by the tension of steel fibers compared with OC. On the other hand, with the addition of steel fiber material, the overall density of concrete increases, and the overall filling ability of concrete is satisfied, thus improving its compressive strength.
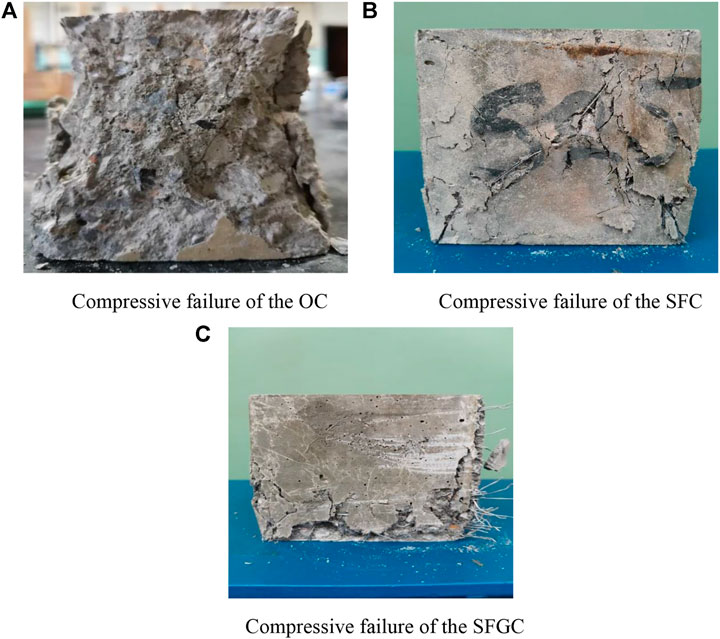
FIGURE 6. Failure of the test blocks. (A) Compressive failure of the OC, (B) Compressive failure of the SFC, (C) Compressive failure of the SFGC
3.2 Effect of steel fiber on the compressive strength of the concrete
Table 17 shows the measured compressive strengths of the concrete specimens with different volume fractions of steel fibers.
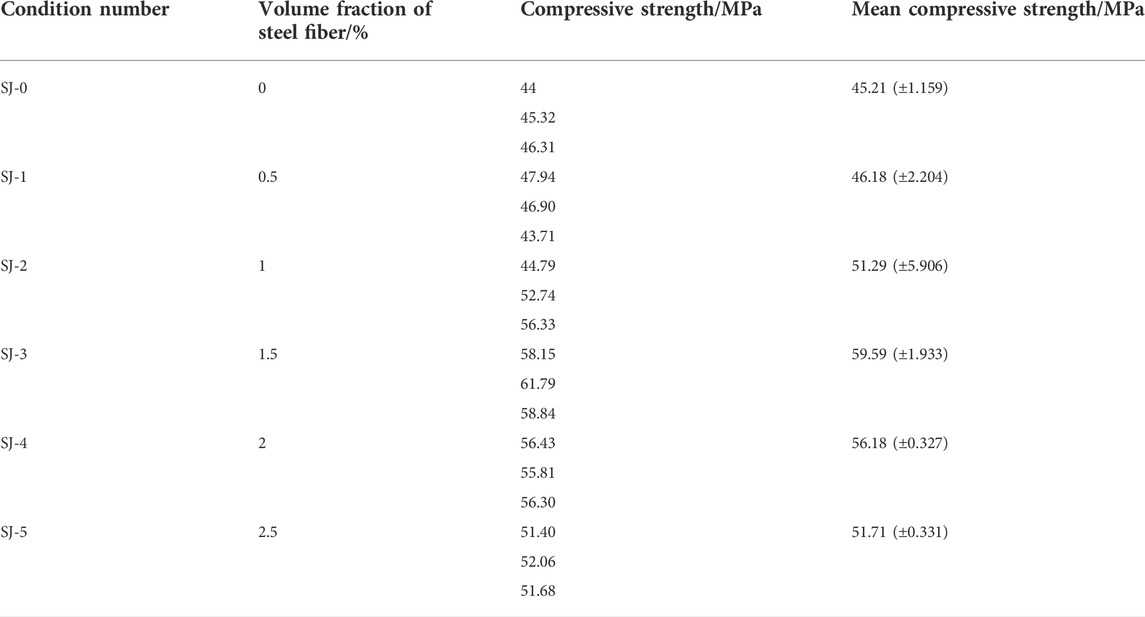
TABLE 17. Compressive strength test data.
As shown in Table 17, with the increase in steel fiber volume fraction, the strength of the SFC increased and then decreased. When the volume fraction of steel fiber was 1.5%, the strength of the test specimens reached the maximum value of around 32% higher than that of the OC (specimens: SJ-0). Although the strengths of the specimens decrease with the increase of the volume fraction of steel fibers from 2.0% to 2.5%, they are higher than that of OC.
Compared with the OC specimens, the transverse expansions in the SFC specimens under the compression are limited by the traction of the steel fiber. With the increase of the volume fraction of the steel fiber, the SFC specimens show multiple cracks after a certain compressive load. When the volume fraction of steel fiber exceeds 1.5%, the cement cannot completely wrap the steel fiber and aggregate and tend to reduce the bond force between the steel fiber and the matrix. Meanwhile, with the increase of the steel fiber volume fraction, steel fibers became more readily to overlap with each other and agglomerate, hindering the reinforcing effect of steel fiber. This phenomenon can explain why the compressive strength of the SFC decrease gradually.
3.3 Effect of steel fiber on the thermal conductivity of the concrete
Hot Disk TPS-2500S thermal parameter analyzer was used to test the thermal conductivity of the specimens. Three specimens of each group were fabricated to test the thermal conductivity in the same environment. The results showed that the measured values of the thermal conductivity with the same volume fraction of the steel fibers remained constant. The average value of three specimens was taken as the thermal conductivity of the SFC. The trend of the effective thermal conductivity and strength of the SFC with the volume fraction of the steel fiber was shown in Figure 7. Thermal conductivity test values of the SFC were shown in Table 18.
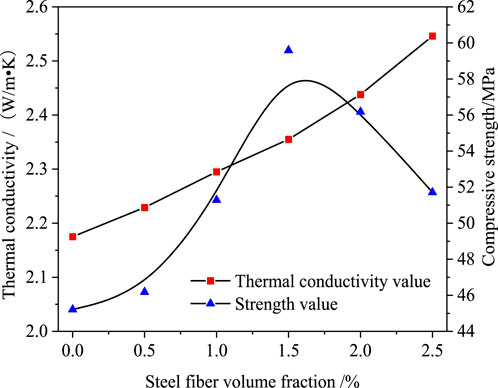
FIGURE 7. The variation law of the thermal conductivity and compressive strength with steel fiber volume fraction.
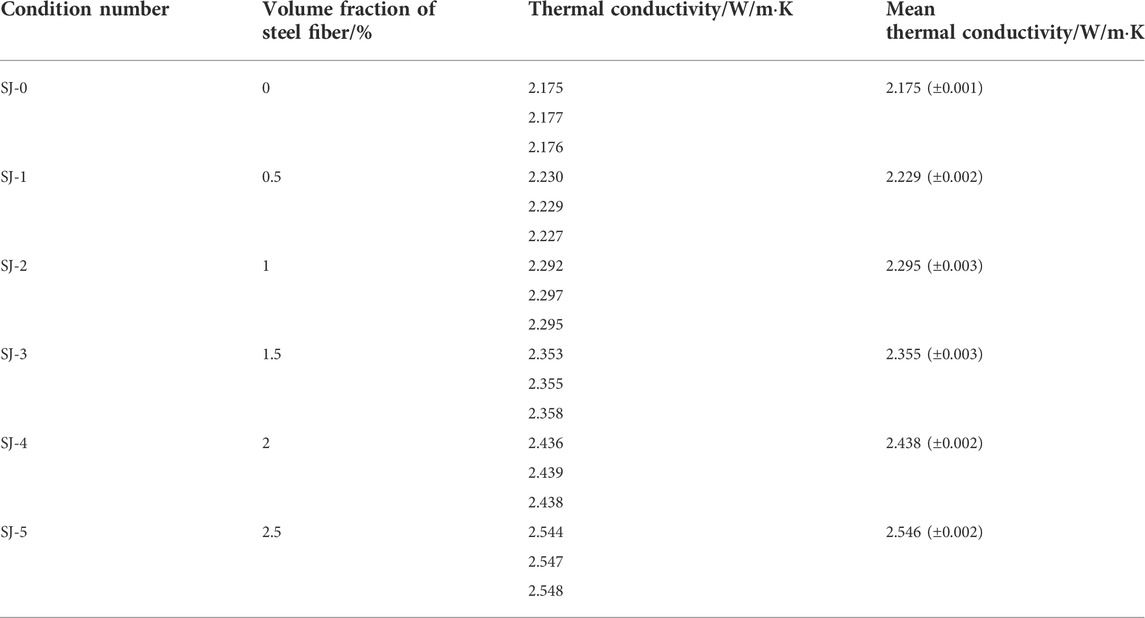
TABLE 18. Thermal conductivity test values of the SFC.
As shown in Figure 7, the thermal conductivity of the SFC increased gradually with the increase of the steel fiber volume fractions. The fact is that steel fibers are liable to form heat conduction connections. Meanwhile, the compressive strength with a 1.5% the volume fraction of the steel fiber was higher than the concrete preparation strength. The optimum volume fraction of the added steel fiber was decided to be 1.5% considering the balance between the thermal conduction coefficient and compressive strength of the SFC. In this case, the strength and thermal conductivity of the SFC specimens are about 31.8% and 8.3% higher than that of the OC specimens, respectively.
3.4 Effect of steel fiber/graphite on compressive strength of the concrete
Based on the previous results, the specimen with steel fiber volume fraction at 1.5% was used as a reference. The graphite powder with volume fractions at 5%, 10% and 15% were added to the basic specimens, respectively. The effect of steel fiber/graphite on the compressive strength of the concrete was listed in Table 19.
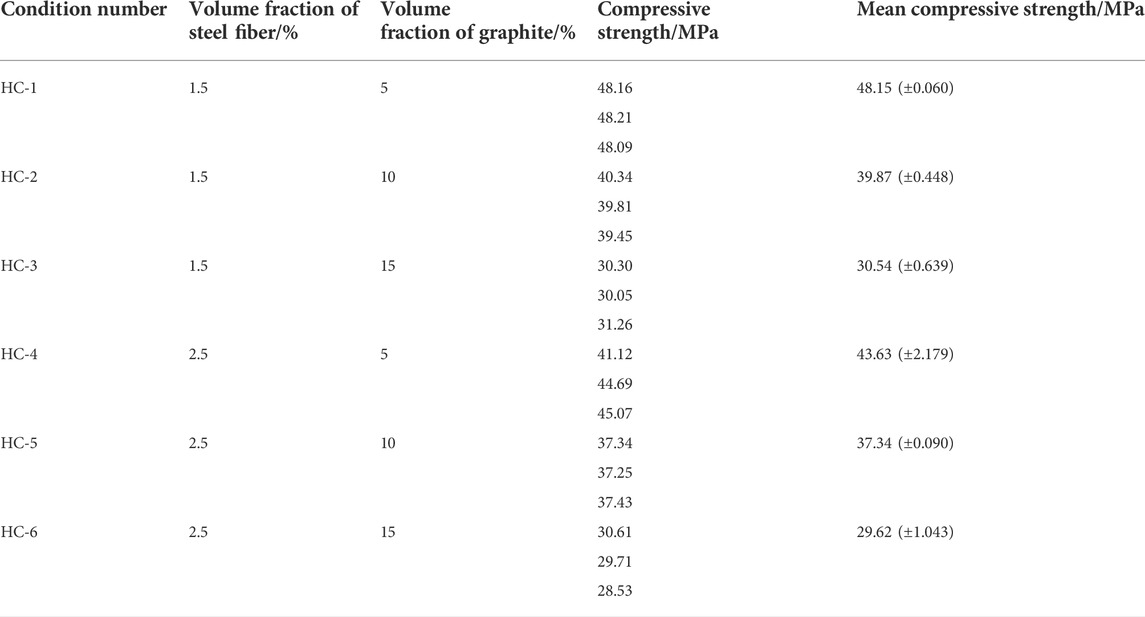
TABLE 19. Test value of compressive strength of the SFGC.
From Table 19, it is noted that the compressive strengths of the SFGC decrease with the increase of graphite volume fraction. The compressive strength is 48.15 MPa for the specimen with 5% graphite.
Compared with 1.5% of the steel fiber admixture fraction of the SFC, it was reduced by 19.2%, but reached the concrete preparation strength of the C40 grand and met the application requirements of the project.
When the graphite mixture fraction exceeded 5%, the compressive strength of the SFGC could not reach the concrete preparation strength of the C40 grand, especially the graphite mixture fraction was 10%, and 15%, the values of the compressive strength were 39.87 and 30.54 MPa respectively.
However, when the graphite volume fraction exceeded 5%, the compressive strength of the SFGC could not meet the service requirements, so the optimal volume fraction of the graphite was 5%.
Firstly, the graphite material had excellent lubricity, and its friction coefficient was small. When the graphite volume fraction became larger, it increased the contact area between the graphite particles and decreased the friction resistance, and thus reduced the compressive strength of the blocks. Secondly, due to the hydrophilic difference between the graphite powder and the cement material, when both of them were mixed, the interfacial bond force was weak with the increase of graphite volume fraction, the interfacial bond force decreased, which caused the compressive strength to decrease.
3.5 Effect of steel fiber/graphite on thermal conductivity of the concrete
The thermal conductivity of three SFGC specimens were tested under identical condition. The average thermal conductivity of the three SFGC specimens are shown in Table 20.
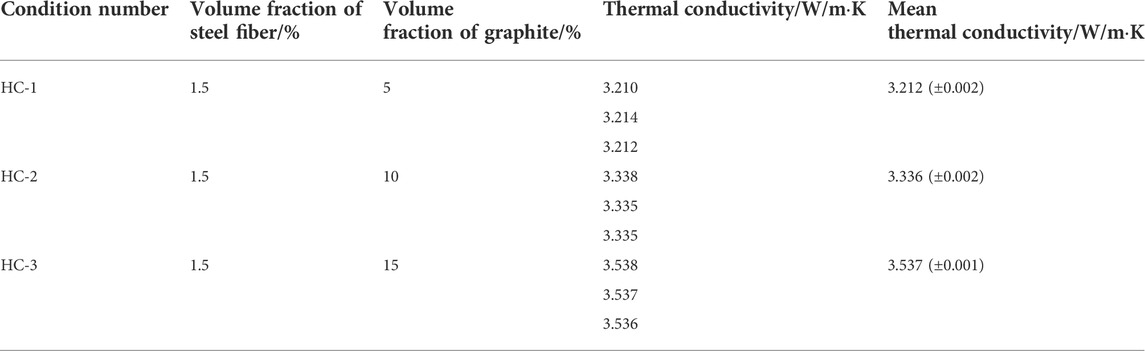
TABLE 20. Test values of thermal conductivity of multiple groups of SFGC.
According to Figure 8, the thermal conductivity and compressive strength of the SFGC, with the volume fraction of steel fiber of 1.5%, had an opposite trend with the graphite volume fraction. The effective thermal conductivities of the SFGC increase with the increase of the graphite volume fraction, while their compressive strengths decrease. When the graphite volume fraction increases from 5% to 15%, the thermal conductivity of the SFGC specimen rises from 36.4% to 50.2%.
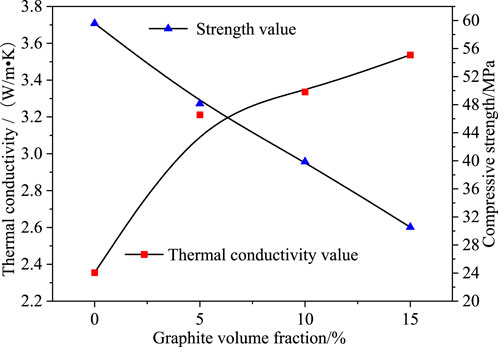
FIGURE 8. Thermal conductivity and strength variation law with graphite volume fraction, when the volume fraction of the steel fiber is 1.5%.
The graphite used in the SFGC was flake graphite powders with high thermal conductivity. When they are mixed with the cement and hydrated to form concrete, they will fill the pores of concrete due to the small particle size, and improve the bondage between the aggregate and the cement paste. This will improve the thermal conductivity of the SFGC (Guo et al., 2017). Moreover, as the graphite volume fraction increases, the heat conducting particles form an interconnected heat conducting network in the concrete which reduces the thermal resistance of the blocks and improves the thermal conductivity (Zheng, 2020). The experiments showed the thermal conductivity of the concrete can be significantly by mixing the graphite with the concrete.
4 Conclusion
The compressive strength and thermal conductivity of the concrete which mixed steel fiber or steel fiber/graphite were analyzed in this study. The following conclusions were drawn from the experimental results:
(1) From the failure modes of the OC, SFC and SFGC blocks, it could be seen that the OC blocks were destroyed immediately once the cracks appeared, In contrast the SFC and SFGC blocks, the blocks were not destroyed immediately after the cracks appeared, but the load could continue to increase, and the cracks would continue to expand until the blocks were completely destroyed. It showed that the failure process of the concrete was delayed due to the existence of the steel fiber.
(2) The experimental results showed that when the volume fraction of steel fiber in concrete is 1.5% or less, the compressive strength and thermal conductivity of the concrete continue to increase, and the improvement of the compressive strength was more significant. On the contrary, by adding graphite into the concrete with the volume fraction of steel fiber of 1.5%, the thermal conductivity of the concrete continued to increase and the compression resistance of the concrete gradually decreased with the gradual increase of the volume fraction of graphite. Therefore, the volume fraction of the graphite had a great impact on the compressive strength and thermal conductivity of the concrete. This study shows that 1.5% volume fraction of steel fiber and 5% volume fraction of graphite were the best, considering the compressive strength and thermal conductivity of the concrete comprehensively.
Data availability statement
The raw data supporting the conclusion of this article will be made available by the authors, without undue reservation.
Author contributions
XR: performed the data analyses and wrote the manuscript; YD: designed experiment and collected data; QL: maked important revisions to the paper; SC: contributed significantly to analysis and manuscript preparation; FS: helped perform the analysis with constructive discussions.
Acknowledgments
The authors would like to acknowledge the support of the National Natural Science Foundation of China (No. 51408484), and Key R & D projects in Shaanxi Province, China (2018SF-359).
Conflict of interest
The authors declare that the research was conducted in the absence of any commercial or financial relationships that could be construed as a potential conflict of interest.
Publisher’s note
All claims expressed in this article are solely those of the authors and do not necessarily represent those of their affiliated organizations, or those of the publisher, the editors and the reviewers. Any product that may be evaluated in this article, or claim that may be made by its manufacturer, is not guaranteed or endorsed by the publisher.
References
Campbell-Allen, D., and Thorne, C. P. (1963). The thermal conductivity of concrete. Mag. Concr. Res. 15 (43), 39–48. doi:10.1680/macr.1963.15.43.39
Chang, Z., and Wang, L. (2017). Mesoscopic numerical simulation of the temperature field of concrete [J]. Eng. J. Wuhan Univ. 50 (6), 938–842. doi:10.4028/www.scientific.net/AMM.477-478.1014
Chen, Y. (2018). Research on temperature field and line shape control of long span concrete box girder [D]. Shi JiaZhuang: Shijiazhuang Tiedao University.
Common Portland cement (2020). Common Portland cement: GB175-2020[S]. Beijing: Standardization Administration of the People's Republic of China.
Deng, C. (2008). Affecting factors and test methods on thermal conductivity of building materials [J]. Qual. Test. (4), 15–18. doi:10.3969/j.issn.1671-3702.2008.04.005
Du, X. L., Jin, L., and Ma, G. W. (2014). Numerical simulation of dynamic tensile-failure of concrete at meso-scale. Int. J. Impact Eng. 66, 5–17. doi:10.1016/j.ijimpeng.2013.12.005
Gu, B., Xie, F., Qian, H., and Lei, L. (2020). 3D-temperature field and its effect of inverted Y-shaped concrete pylon in lower yangtze region [J]. J. Central South Univ. Sci. Technol. Ed. 51 (1), 248–260. doi:10.11817/j.issn.1672-7207.2020.01.028
Guo, C., Tang, W., and Liu, H. (2017). Properties and microstructure of conductive concrete containing graphite powder. Bull. Chin. Ceram. Soc. 36 (9), 3174–3179. doi:10.16552/j.cnki.issn1001-1625.2017.09.052
Hamilton, R. L., and Crosser, O. K. (1962). Thermal conductivity of heterogeneous two-component systems [J]. Industrial Eng. Chem. Fundam. 1 (3), 27–40. doi:10.1021/i160003a005
Harmathy, T. Z. (1970). Thermal properties of concrete at elevated temperatures [J]. J. Mater. 5 (1), 47–74. doi:10.1016/j.conbuildmat.2020.121398
Jia, Z., Bai, S., and Zhao, S. (2010). Foundation properties of graphite filled cement conductive composites [J]. J. Funct. Mater. 41 (12), 2220–2222.
Kim, K. H., Jeon, S. E., Kim, J. K., and Yang, S. (2003). An experimental study on thermal conductivity of concrete. Cem. Concr. Res. 33 (3), 363–371. doi:10.1016/s0008-8846(02)00965-1
Lei, S., Lu, X., and Zhang, K. (2019). Finite element analysis of temperature effect of hollow thin-walled pier[J]. Railw. Eng. 59 (5), 47–50. doi:10.3969/j.issn.1003-1995.2019.05.11
Li, S., Fan, Y., Zhang, D., and Liu, Y. (2007). Numerical simulation of relationship between thermal conductivity of geotechnical material and its porosity[J]. Rock Soil Mech. 28 (S), 244–248. doi:10.16285/j.rsm.2007.s1.114
Lin, Y., and Dou, Y. (2022). Simplified calculation of temperature stress of concrete bridge [J]. Roads Bridg. 49 (06), 127–128. doi:10.3969/j.issn.1001-523X.2022.06.040
Liu, K., Wang, F., and Wang, X. (2012). Research on influencing factors and estimating model of thermal conductivity of cement concrete [J]. J. Build. Mater. 15 (6), 771–777. doi:10.1016/j.conbuildmat.2021.125638
Liu, W., and Geng, Y. (2005). Research on influence of thermal parameters on temperature field of concrete structure [J]. China Concr. Cem. Prod. (01), 11–15. doi:10.19761/j.1000-4637.2005.01.004
Liu, Y., Liu, J., and Zhang, N. (2019). Review on solar thermal actions of bridge structures [J]. China Civ. Eng. J. 52 (05), 59–78. doi:10.15951/j.tmgcxb.2019.05.006
Qu, C., Xue, S., Xin, Y., and Yang, D. (2019). Analysis of the influence of graphite on the thermal conductivity and compressive strength of concrete [J]. Sci. Technol. Eng. 19 (13), 243–248. doi:10.3969/j.issn.1671-1815.2019.13.038
Ren, X., He, Q., Tong, Y., and Huang, P. (2011a). Temperature and stress fields analysis of concrete bridge tower [J]. J. Zhengzhou Univ. Eng. Sci. 32 (2), 62–65. doi:10.3969/j.issn.1671-6833.2011.02.016
Ren, X., and HuangHan, P. W. (2012). Transverse temperature stress computation method of concrete thin-wall box-shape structure [J]. China J. Highw. Transp. 25 (1), 76–82. doi:10.19721/j.cnki.1001-7372.2012.01.012
Ren, X., Qi, Y., Wang, L., Huang, P., and Song, F. (2021). Influence of sectional geometric parameters on thermal stress in concrete thin-walled bridge pylon [J]. J. Highw. Transp. Res. Dev. 38 (06), 78–87. doi:10.3969/j.issn.1002-0268.2021.06.011
Ren, X., Tong, Y., He, Q., and Huang, P. (2011b). Thermal stress fields of thin-walled box girder concrete bridge tower [J]. J. Guangxi Univ. (Philosophy Soc. Sci. 36 (1), 121–127. doi:10.13624/j.cnki.issn.1001-7445.2011.01.014
Specification (2011). Specification for mix proportion design of ordinary concrete: JGJ55-2011[S], 38. Beijing: Ministry of Construction of the PRC, 78–87.6
Standard for test method (2016). Standard for test method of performance on ordinary fresh concrete: GB/T 50080-2016[S]. Beijing: Ministry of Construction of the PRC.
Standard of water for concrete (2006). Standard of water for concrete: JGJ6-2006[S]. Beijing: Ministry of Construction of the PRC.
Sun, H., Yuan, Y., Jiang, J., and Cheng, J. (2009). Experimental study on thermal conductivity of the surface layer concretes. J. Concr. (5), 59–61. doi:10.4028/www.scientific.net/AMM.438-439.329
Tang, S., Tang, C., Liang, Z., and Zhang, Y. (2012b). Study of thermal conduction and thermal stress of concrete at mesoscopic level and its thermal cracking processes [J]. China Civ. Eng. J. 45 (2), 400–410.
Tang, S. B., Tang, C. N., Liang, Z. Z., Zhang, Y. B., and Li, L. C. (2012a). Numerical study of the influence of material structure on effective thermal conductivity of concrete. Heat. Transf. Eng. 33 (8), 732–747. doi:10.15951/j.tmgcxb.2012.02.004
Xiao, J., Song, Z., and Zhang, F. (2010). An experimental study on thermal conductivity of concrete. Jianzhu Cailiao Xuebao/Journal Build. Mater. 13 (01), 17–21. doi:10.3969/j.issn.1007-9629.2010.01.004
Xiao, J. Z., Li, W. G., Corr, D. J., and Shah, S. P. (2013). Effects of interfacial transition zones on the stress–strain behavior of modeled recycled aggregate concrete. Cem. Concr. Res. 52, 82–99. doi:10.1016/j.cemconres.2013.05.004
Zhang, R., Jin, L., and Du, X. (2018). Mesoscopic analysis of the temperature-dependent thermal conduction behavior within concrete [J]. J. Beijing Univ. Technol. 44 (12), 1503–1512. doi:10.1016/j.conbuildmat.2015.07.117
Zhang, W., Min, H., Gu, X. L., Xi, Y., and Xing, Y. (2015). Mesoscale model for thermal conductivity of concrete. Constr. Build. Mater. (98), 8–16. doi:10.1016/j.conbuildmat.2015.08.106
Zhang, W., Tong, F., Xing, Y., and Gu, X. L. (2015). Experimental study and prediction model of thermal conductivity of concrete. J. Build. Mater. 18 (02), 183–189. doi:10.3969/j.issn.1007-9629.2015.02.001
Zhang, W., Xing, S., and Gu, X. (2012). Thermal conductivity model of concrete based on meso Composites [J]. Struct. Eng. 28 (02), 39–45. doi:10.15935/j.cnki.jggcs.2012.02.003
Zhang, Y., Liu, X., and Rao, W. (2017). Influence study of gross temperature effect on coupled-component cable-stayed bridge with herringbone shape pylon [J]. Highway 62 (02), 65–70. doi:10.1080/15732479.2021.1907599
Keywords: concrete, graphite, steel fiber, compressive strength, thermal conductivity
Citation: Ren X, Ding Y, Liu Q, Chen S and Song F (2022) Effect of different volume fraction of steel fiber/graphite on thermal conductivity and compressive properties of concrete. Front. Mater. 9:1003830. doi: 10.3389/fmats.2022.1003830
Received: 26 July 2022; Accepted: 22 August 2022;
Published: 15 September 2022.
Edited by:
Lili Hu, Shanghai Jiao Tong University, ChinaReviewed by:
Zhiqiang Dong, Southeast University, ChinaChanachai Thongchom, Thammasat University, Thailand
Copyright © 2022 Ren, Ding, Liu, Chen and Song. This is an open-access article distributed under the terms of the Creative Commons Attribution License (CC BY). The use, distribution or reproduction in other forums is permitted, provided the original author(s) and the copyright owner(s) are credited and that the original publication in this journal is cited, in accordance with accepted academic practice. No use, distribution or reproduction is permitted which does not comply with these terms.
*Correspondence: Xiang Ren, cmVueGlhbmc3OThAeHVzdC5lZHUuY24=