 Zenglou Li
 Chong Li
 Shuohan Li
 Demeng Yin
 Zhenguo Qi
 Yalin Tian
95% of researchers rate our articles as excellent or good
Learn more about the work of our research integrity team to safeguard the quality of each article we publish.
Find out more
ORIGINAL RESEARCH article
Front. Mater. , 03 January 2022
Sec. Structural Materials
Volume 8 - 2021 | https://doi.org/10.3389/fmats.2021.813661
This article is part of the Research Topic Joining and Welding of New and Dissimilar Materials View all 7 articles
Due to the inherent issue of requiring rigid back support, friction stir welding (FSW) has serious limitations for the welding of hollow structures. Self-supporting friction stir welding was proposed to join hollow aluminum extrusions, which could reduce the hindrance of the welding tool and the requirement of rigid back support. In this paper, finite element modeling analyses were carried out for the asymmetric temperature field in the process of self-supporting FSW. The peak temperature of the stir zone appeared in the upper shoulder affected zone, followed by the lower shoulder affected zone. In the upper shoulder affected zone, a peak temperature was not shown at the center of the curve due to the positive correlation between heat generation and radius and different heat dissipation rates. Considering the influence of thermal input and rotation speed on joint formation, 200 mm/min travel speed and 800 rpm rotation speed are the most proper parameters for 5-mm-thick 6082-T6 aluminum alloy self-supporting FSW butt welds.
Sparked with its solid-state joining and excellent strength efficiency, friction stir welding (FSW) has become a novel solid-state welding technology (Huang et al., 2018a; Meng et al., 2021). Compared with conventional fusion welding methods, the joint fabricated by FSW has superior mechanical and physical properties (El-Danaf and El-Rayes, 2013). Therefore, FSW technology has been widely applied in many critical engineering and manufacturing fields, such as aerospace, railway vehicles, ships, and automobiles (Wang et al., 2018; Zhou et al., 2020; Xie et al., 2021a). To satisfy the requirements of lightweight and high safety, the body of modern high-speed railway vehicles has been designed with a combination of aluminum alloy hollow profile structure and FSW processing method (Kawasaki et al., 2004; Xie et al., 2021b). The frame parts of high-speed railway vehicles mostly adopt hollow or enclosed profile structures (Trueba et al., 2018), which is an important application of FSW technology in the manufacturing of railway vehicles (Xu et al., 2018; Yang et al., 2018).
However, it has certain limitations in the engineering manufacturing process due to the inherent issues of the conventional FSW method (Huang et al., 2013; Xie et al., 2020): 1) A rigid back support is required to prevent the weld from collapsing, which is difficult for the hollow or enclosed profiles to provide; 2) The welding adaptability of non-linear welds is poor. FSW is more suitable for butt and lap joints compared with the joints with complex curve welding path; 3) Root defect. Since the pin length is generally smaller than the thickness of the workpiece, the lack of root penetration leaves a slight root defect at the bottom of the joint. To solve the above issues, the bobbin tool friction stir welding (BTFSW) technique was developed by employing a bottom shoulder to provide back support for the workpiece (Thomas et al., 2009; Liu et al., 2013). However, BTFSW needs predrilled pilot holes during the welding process and has a potential risk of pin breakage with improper welding parameters. Self-supporting friction stir welding (SSFSW) technique was innovatively proposed (Wan et al., 2014a), which could reduce the hindrance of the welding tool and the requirement of rigid back support, making it especially suitable for the welding of hollow structures such as the frame parts of the high-speed railway vehicles (Wan et al., 2014b). As a novel FSW method with a complex thermal-mechanical coupling process, researches about the thermal analysis of SSFSW are poor due to the difficulty in the temperature measurement of the stir zone. To solve this issue, finite element simulation is an effective method for thermal analysis of the SSFSW process without conducting experiments (Huang et al., 2019a; Wen et al., 2019; Meyghani et al., 2020; Xie et al., 2021c).
In this paper, finite element simulation was utilized to analyze the asymmetric temperature field of the SSFSW process. The temperature field and flow field models were established, and the influence of welding parameters on the thermal cycle was quantitatively analyzed. The optimized welding parameters were obtained from the simulation results, which was helpful to improve the process design of SSFSW and improve the joint quality.
In FSW, the heat is generated by two sources, the heat from friction and the heat from plastic deformation. The two heat generation mechanisms are caused by different contact states (Huang et al., 2019b; Wang et al., 2021). There are generally three modes of contact between the workpiece and the welding tool: complete slipping friction, complete sticking contact, and the coexistence of the two. Slipping friction leads to the generation of frictional heat, and sticking contact leads to the generation of plastic deformation heat. Therefore, a contact variable “δ” is defined to characterize the friction state between the workpiece and the welding tool.
Where
Where μ(T) is the coefficient of slipping friction which changes with temperature, P is the axial downward pressure per unit area on the surface of the workpiece, r is the distance between a certain point on the welding tool and the center point of the tool, θ (0–360°) is the angle between the line consisting of a certain point on the welding tool and the center point of the tool and the welding direction. Assuming that during the welding process, slipping friction and sticking contact coexist between the upper surface of the lower shoulder and the pin and the workpiece, the heat generation power at a certain point on the welding tool can be expressed as:
Where μ(T) is the coefficient of sliding friction which changes with temperature, p is the pressure between the workpiece and the pin, r is the distance between a certain point on the welding tool and the center point of the tool.
According to von Mises yield criterion:
Where
Considering the force condition of a thin layer of workpiece material adjacent to the stirring pin, the following relationship can be obtained:
Combining the (Eqs 3, 5, 6) formulas, we can get:
Constitutive models reflect the relationship between stress and strain, strain rate, temperature, pressure, and deformation history in the plastic deformation process of materials. As one of the most widely used material constitutive models, the Johnson-Cook model is quite consistent with the deformation descriptions of many metal materials (Kuykendall et al., 2013). SSFSW process is a highly non-linear dynamic process involving work hardening and a high strain rate. Johnson-Cook model is consistent with the plastic deformation in SSFSW within a certain range and well expresses the influence of the dynamic yield stress and hardening effect of the material on the deformation at high strain rates. The form of the Johnson-Cook model constitutive relationship is as follows:
Where
The material constants of the Johnson-Cook model are mostly obtained through Taylor impact experiments and quasi-static tensile experiments. The material constants of 6082-T6 aluminum alloy are listed in Table.1. Due to the large difference in stress, strain, strain rate, temperature, and pressure used in the experiment, the determined material constant varies widely. The values of these material constants are all obtained under the experimental conditions with a strain rate of less than 104 s−1. If these material constants determined through experiments are directly used for numerical simulation, large errors may occur in the simulation process. To improve the accuracy of the model, these parameters are adjusted slightly and compared with the experimental results, finally obtaining the most suitable values.

TABLE 1. Johnson-Cook model material constants of 6082-T6 aluminum alloy.
To simplify the calculation and improve calculation efficiency, the following assumptions for the heat source model are proposed (Hilgert et al., 2011): 1) The material is thermally isotropic; 2) The latent heat is ignored; 3) The heat generation of pin thread, concave structure of the upper shoulder, and tilt angel are ignored; 4) The influence of the phenomenon that the pin does not contact the material in the welding process on the heat generation is ignored; 5) The influence of spiral material flow field on the heat generation is ignored.
Figure 1 shows the simplified model of the SSFSW tool. For the upper shoulder, it can be regarded as a surface heat source. Assuming that the axial force is uniformly loaded on the surface of the workpiece, the surface heat source of the upper shoulder can be expressed as:
The body heat source of the pin can be expressed as:
The body heat source of the lower shoulder upper surface can be expressed as:
The body heat source of the lower shoulder lower surface can be expressed as:
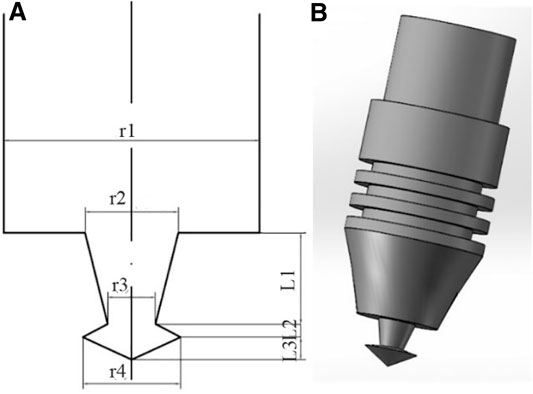
FIGURE 1. Simplified model of SSFSW tool, (A) simplified sketch, (B) 3D model.
Considering the output accuracy and division difficulty, this model uses hexahedral element mesh division. An asymmetric deviation factor of 0.3 is set in the transverse direction of the plate to increase the mesh density at the weld and improve the calculation accuracy. The final division has 192,000 elements and 219,429 nodes, as shown in Figure 2.
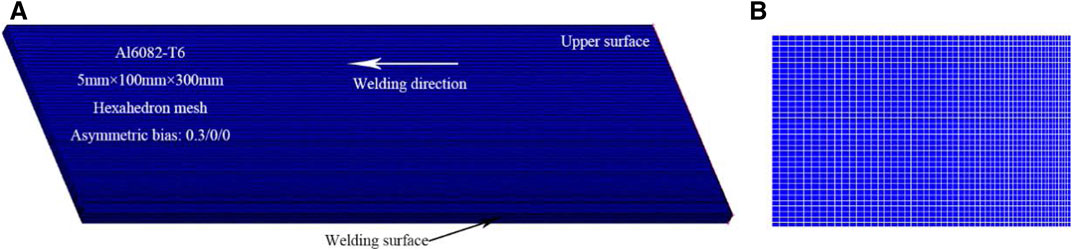
FIGURE 2. Meshing schematic of the model in Marc, (A) general division, (B) local details.
Temperature field simulation requires accurate material property parameters, including density, specific heat capacity, thermal conductivity. Most of these parameters change with temperature. For some of the parameters that are not sensitive to temperature, the values at room temperature can be used. For parameters that change greatly with temperature, it is expected to generate the relationship between the parameter and temperature by interpolation. The temperature-dependent material property parameters used in this simulation can be found in the paper (Huang et al., 2018b).
The thermal boundary conditions in the SSFSW process are various, including heat convection condition of upper shoulder, heat convection condition of the lower surface of the lower shoulder, heat convection condition of the contact surface, heat exchange condition between workpiece and fixture, heat exchange condition between workpiece and air.
Part of the heat generated on the upper shoulder is lost through the pin. The efficiency is set as 77% in this study. The heat convection condition of the upper shoulder surface can be expressed as:
Some heat generated on the lower surface of the lower shoulder is also lost during the welding process. A coefficient
Assuming that no heat transfer occurs at the butt joint of the weld, it can be regarded as an adiabatic surface, and the heat flux is zero.
Heat exchange condition between workpiece and fixture depends on many factors such as surface roughness, pressure, and contact area. This study uses an assumed parameter, the equivalent heat convection parameter
The heat exchange boundary condition between workpiece and air can be expressed as the following equation, in which h is 30 w/(m2·°C).
To analyze the temperature field in SSFSW, the selected welding parameters are 800 rpm rotation speed and 100 mm/min travel speed. The welding process starts at a distance of 30 mm from the edge to ensure the completeness of the temperature distribution cloud map. Due to the symmetry of the welding process, only one side of the workpiece is selected for analysis. The temperature distribution cloud maps of the upper surface, the lower surface, longitudinal section, and transverse section of the workpiece at different welding times are shown in Figures 3–6, respectively.
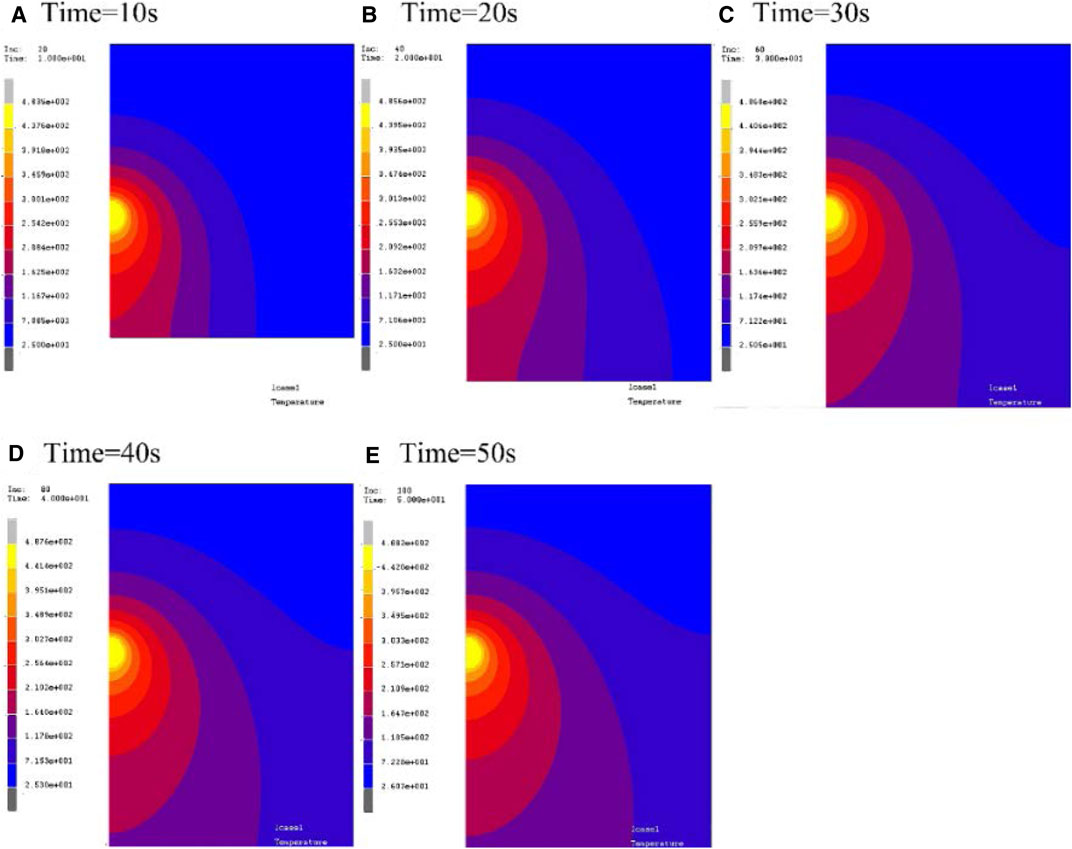
FIGURE 3. Contour of temperature distribution at different time on the upper surface of the workpiece (unit: °C). (A) time = 10 s, (B) time = 20 s, (C) time = 30 s, (D) time = 40 s, (E) time = 50 s.
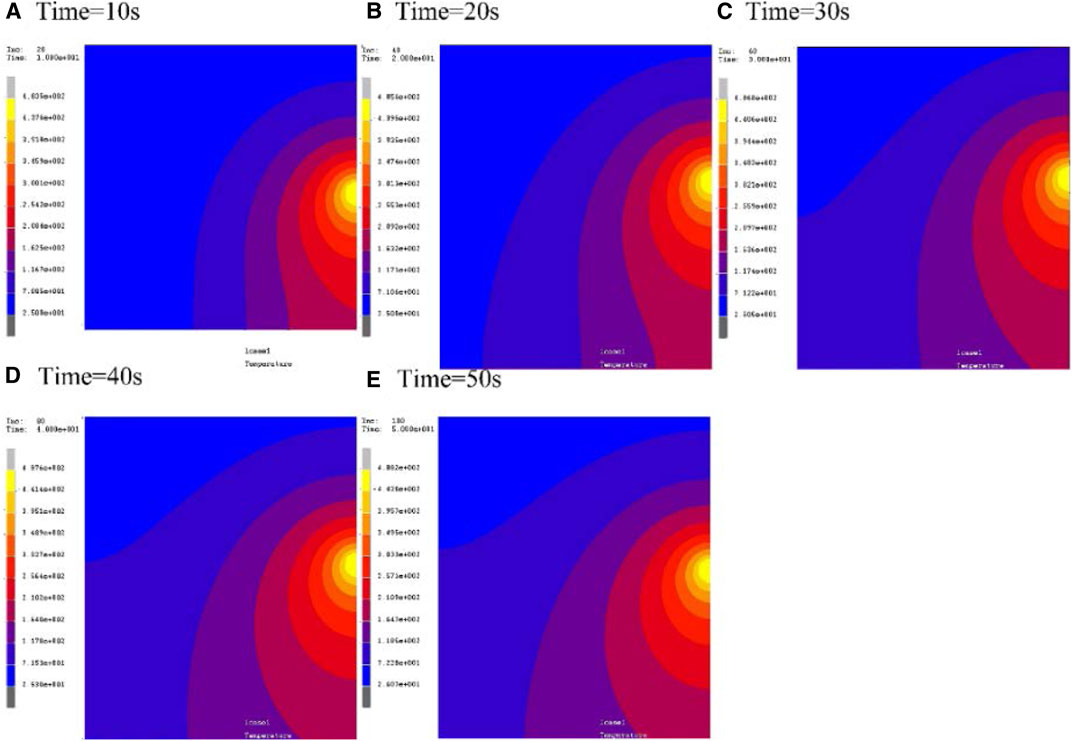
FIGURE 4. Contour of temperature distribution at different time on the lower surface of the workpiece (unit: °C): (A) time = 10 s, (B) time = 20 s, (C) time = 30 s, (D) time = 40 s, (E) time = 50 s.
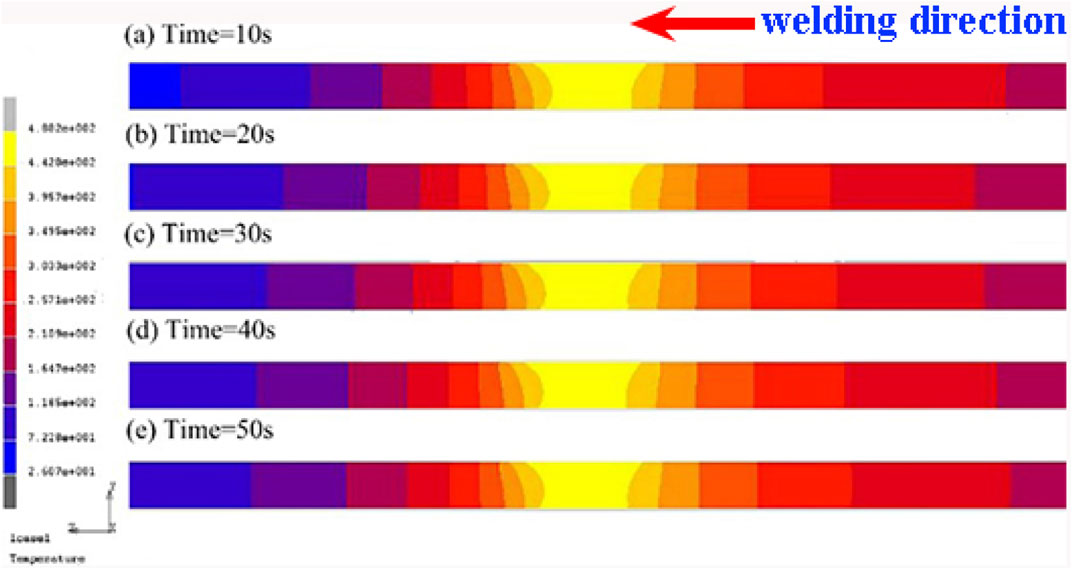
FIGURE 5. Contour of temperature distribution at different time in the longitudinal section of the workpiece (unit: °C): (A) time = 10 s, (B) time = 20 s, (C) time = 30 s, (D) time = 40 s, (E) time = 50 s.
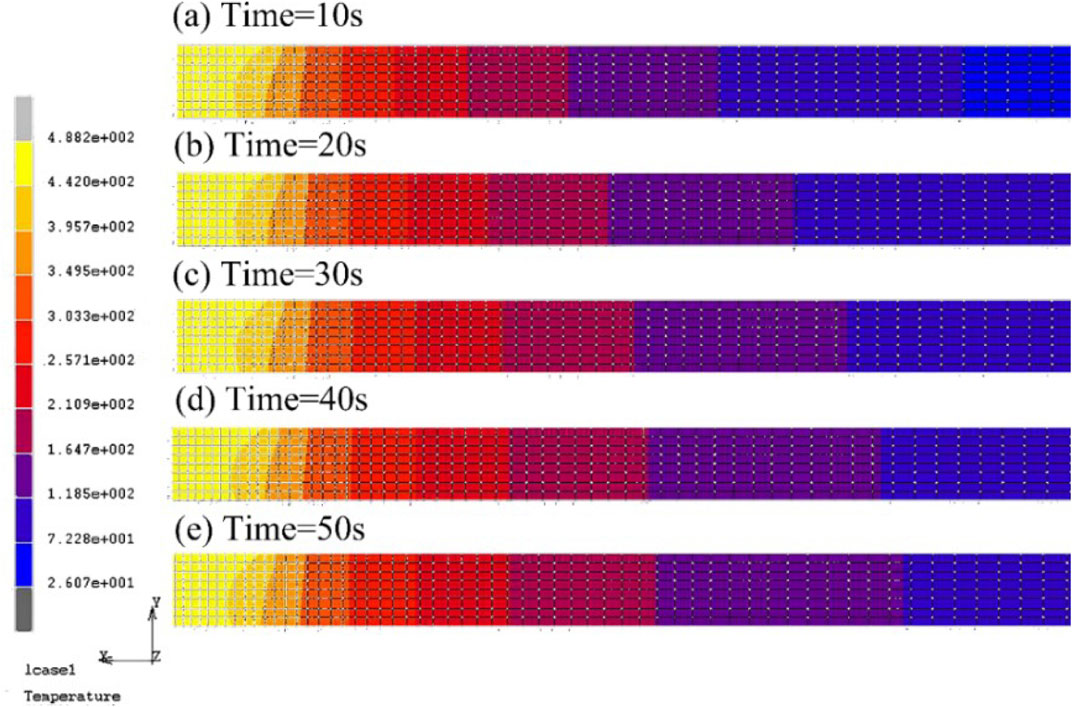
FIGURE 6. Contour of temperature distribution at different time in the transverse section of the workpiece (unit: °C): (a) 10 s, (b) 20 s, (c) 30 s, (d) 40 s, (e) 50 s.
To fully understand the temperature changes around the workpiece during the welding process, some specific feature points are selected for analysis. Figure 7 shows the distribution of feature points on the upper surface of the workpiece, which is labeled as a∼h in turn. At the same time, the corresponding feature points are labeled as a’∼h’ on the lower surface of the workpiece.
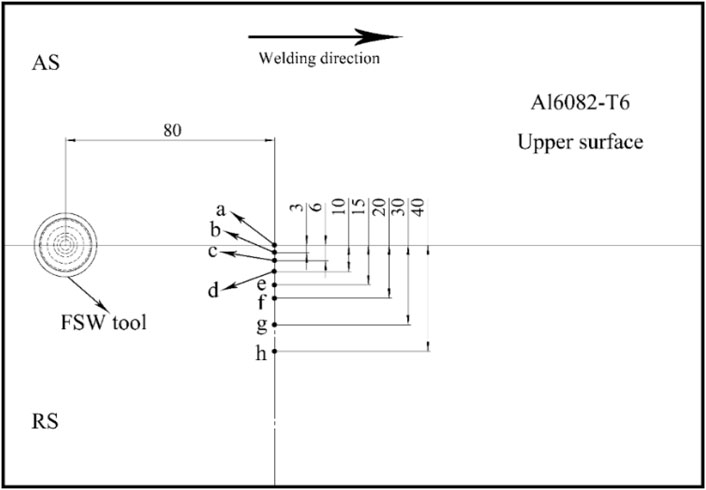
FIGURE 7. Distribution of feature points on the upper surface of the workpiece.
The thermal cycle curves of each feature point are displayed in Figures 7, 8, respectively. At the position 40 mm from the center of the weld, with the increase of the distance between the feature point and the center of the weld, the peak temperature of each feature point on the upper surface gradually decreases. And the temperature curve gradually becomes flat. The peak temperature distribution on the lower surface also shows a similar trend. The peak temperature of the thermal cycle curve at the feature point b on the lower surface at the corresponding position (468.5°C) is lower than the feature point on the upper surface (478.0°C). The time required for the feature point to reach the peak temperature increases as the distance from the weld increases. This is because this part of the material is far away from the welding tool and heats up mainly through heat convection. When the welding tool passes through the center of the transverse plane where the feature point is located, it does not immediately reach the peak temperature but shows a certain hysteresis. The time at point h 40 mm away from the center of the weld to reach the peak temperature is 8.5 s later than the center point of the weld.
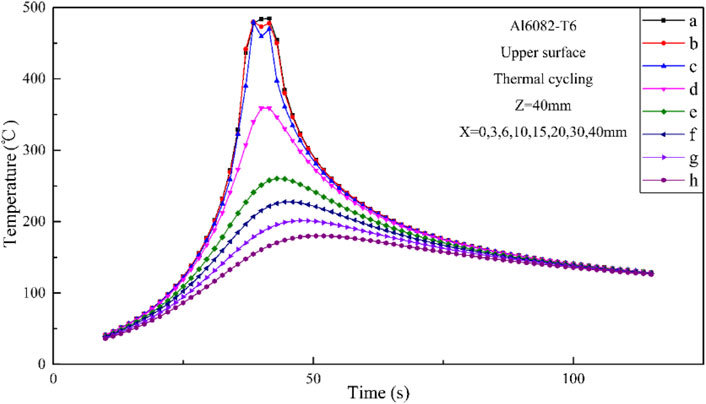
FIGURE 8. Thermal cycle curves of feature points on the upper surface of the workpiece.
Depressions on the thermal cycle curves of points b and c are observed, which are located at the distance of 3 and 6 mm from the center of the weld on the upper surface of the workpiece, as shown in Figure 8. The peak temperature of 484.7°C is not shown at the center of the curve, and the temperature of the center point is 454.5°C. This is due to the two points are located in the shoulder affected zone. As the distance from the center of the weld increases, the linear velocity of the shoulder increases, and the heat generation increases, which leads to the increase of heat dissipation rate. Therefore the peak temperature occurs at the time when the shoulder thermal input is the largest. However, this phenomenon is not observed in Figure 9 due to the insufficient thermal input produced by the relatively smaller lower shoulder.
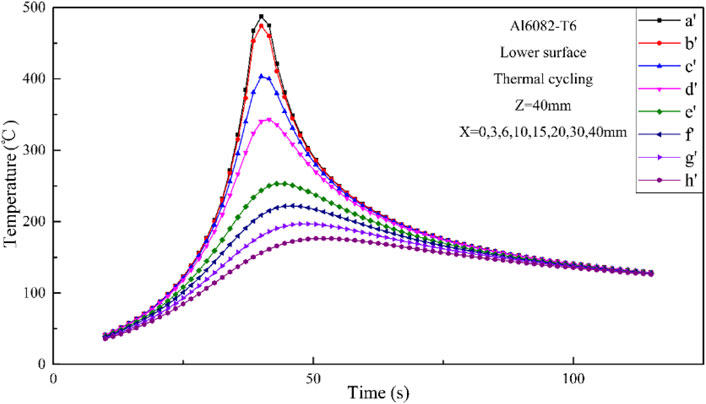
FIGURE 9. Thermal cycle curves of feature points on the lower surface of the workpiece.
To analyze the distribution of temperature field in the thickness direction of the workpiece, take the upper surface feature point b and the lower surface feature point b’ at a distance of 3 mm from the center of the weld, and the midpoint b’’ between the two points to analyze the thermal cycle curve, as shown in Figure 10. The three peak temperatures all exceed the recrystallization temperature of the metal. The peak temperature of midpoint b’’ is 462.3°C, slightly lower than 478.0°C on the upper surface and 468.5°C on the lower surface. This is because the midpoint is mainly affected by the effect of the pin rather than the upper and lower shoulders, and the thermal input is relatively insufficient. In addition, the peak temperature of point b shows a trend of first falling and then rising because it locates at the upper shoulder affected zone.
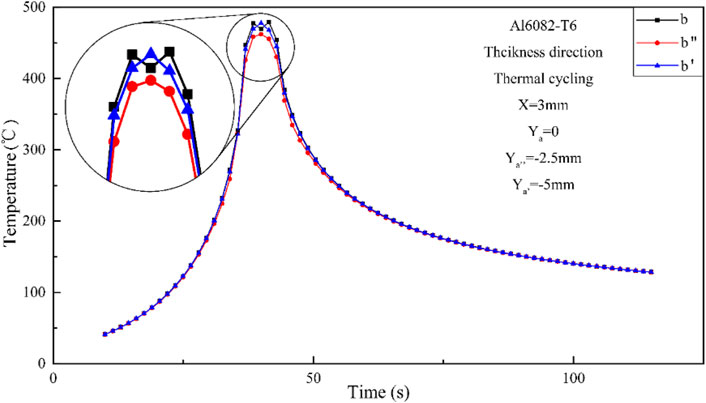
FIGURE 10. Thermal cycle curves of each feature point in the thickness direction at a distance of 3 mm from the center of the weld.
To investigate the temperature changes at the center of the heat source at different welding time, several feature points are selected at the center of the weld along the welding direction on the upper surface of the workpiece with an interval of 10 mm, as shown in Figure 11. The thermal cycle curves of them are displayed in Figure 12. The thermal cycle experienced by each feature point along the welding direction is basically the same. In the preheating stage before welding, the thermal input generated by the welding tool makes the workpiece close to entering the quasi-steady state before arriving at point a. The average peak temperature of this stage reaches 462.3°C, and the high-temperature residence time over 300°C is 15.13 s. The thermal cycle curves generally show a trend of first rising and then falling, and the rate of increase is significantly greater than the rate of decrease. This is because the heating stage experiences the thermal input of the welding tool and heat convection, while the cooling stage only relies on the heat convection effect.
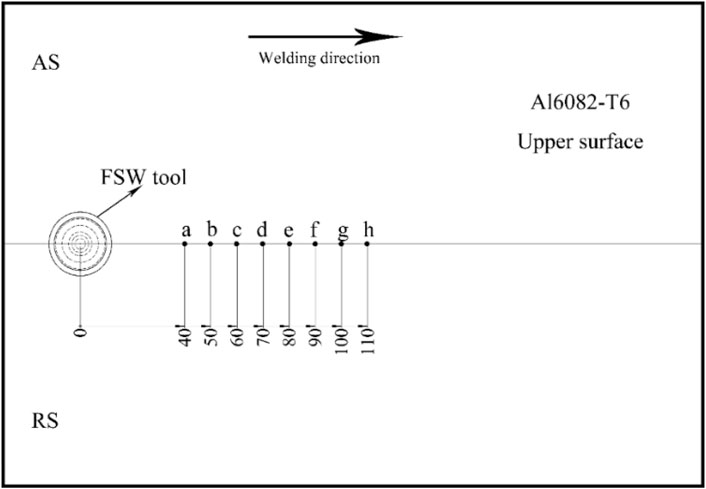
FIGURE 11. Distribution of the longitudinal feature points at the weld center on the upper surface of the workpiece.
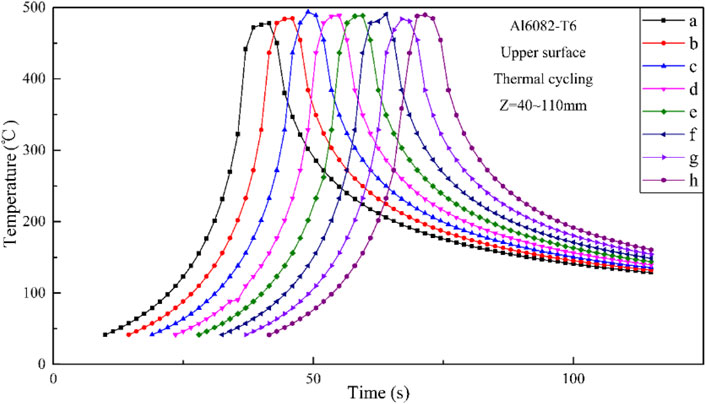
FIGURE 12. Thermal cycle curves of each feature point on the upper surface of the workpiece along the welding direction.
The temperature distribution cloud map along the transverse section direction during the welding quasi-steady state is compared with the experimental results to verify the credibility of this simulation results. As shown in Figure 13, the temperature distribution zone in the quasi-steady state of welding corresponds well to the microscopic area distribution, indicating the simulation results are in great coincidence with experimental results.
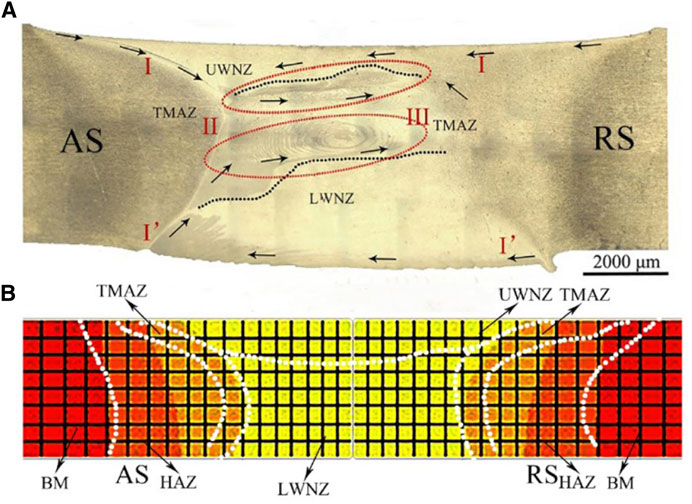
FIGURE 13. Comparison of (A) experimental results and (B) temperature distribution cloud map at welding quasi-steady state.
Because the temperature values at the stir zone are difficult to be measured by thermocouple directly, outer temperature values are selected to compare with the simulation results. The thermal cycle curves of feature points d, e, f, g in Figure 7 with the distances from the center of 10, 15, 20, and 30 mm, respectively are used in this study, as shown in Figure 14. The simulated thermal cycle curves show excellent consistency with the experimental results. Generally, it can be determined that the simulated results meet the actual analysis requirements.
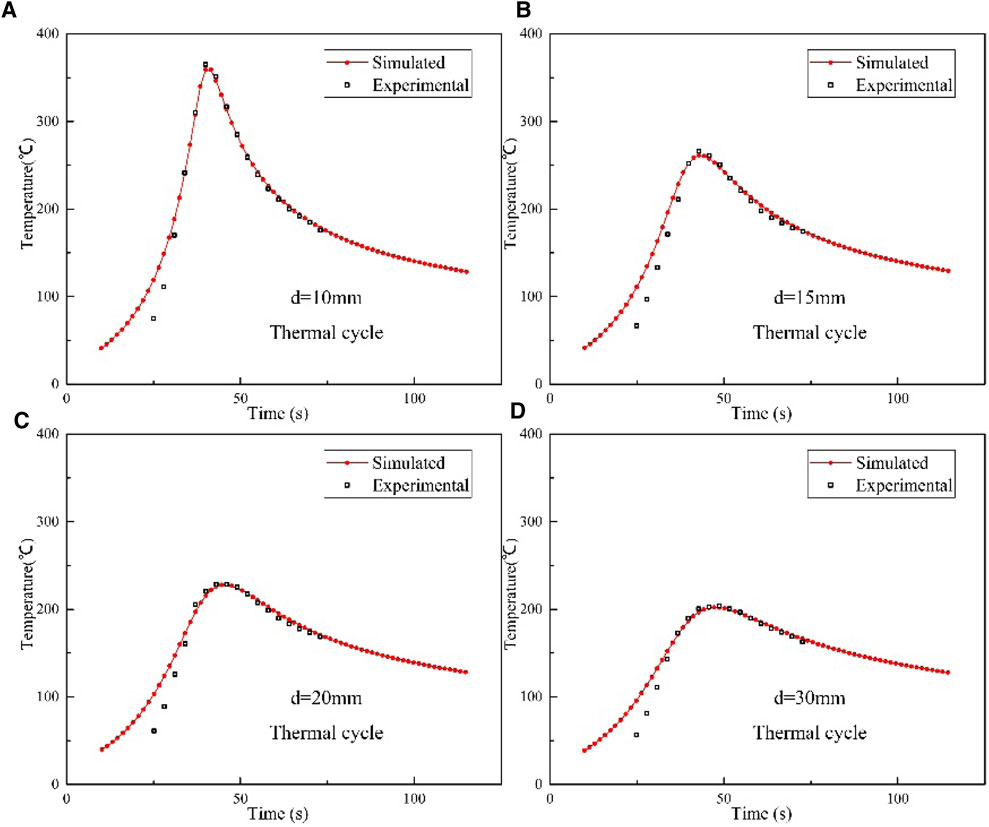
FIGURE 14. Comparison of simulated thermal cycle curves and experimental results, (A) d = 10 mm, (B) d = 15 mm, (C) d = 20 mm, (D) d = 30 mm.
Fixing the 800 rpm rotation speed, the temperature distribution cloud map at quasi-steady state on the upper surface of the workpiece under different travel speeds is shown in Figure 15. As the travel speed increases, the transverse width of the heating zone shrinks significantly, and the longitudinal length shrinks less. The temperature distribution shows a more concentrated trend. Figure 16 shows the thermal cycle curves of feature point b under different travel speeds at the fixed 800 rpm rotation speed. The peak temperature is 462.3°C when the travel speed is 100 mm/min, and the high-temperature residence time over 300°C is 15.29 s. When the travel speed reaches 200 mm/min, the peak temperature and high-temperature residence time are decreased to 454.2°C and 6.65 s, respectively. As the travel speed further increased to 300 mm/min, the peak temperature and high-temperature residence time are further decreased to 439.0°C and 5.46 s, respectively. The lowest peak temperature of 421.3°C and high-temperature residence time of 4.76 s are shown under the travel speed of 400 mm/min.
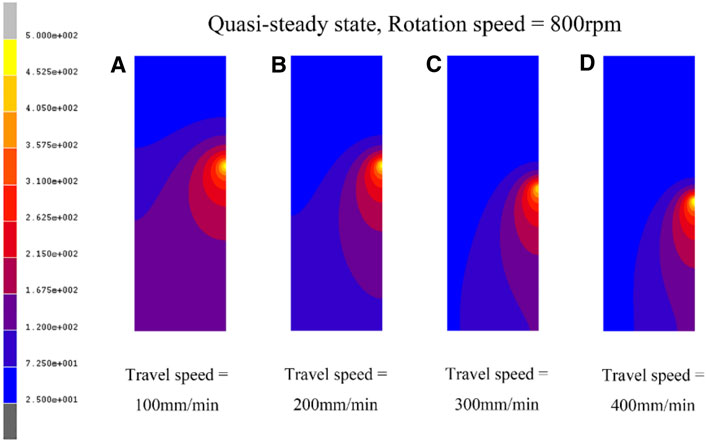
FIGURE 15. Contours of temperature distribution on the upper surface under different travel speeds. (A) 100 mm/min, (B) 200 mm/min, (C) 300 mm/min, (D) 400 mm/min.
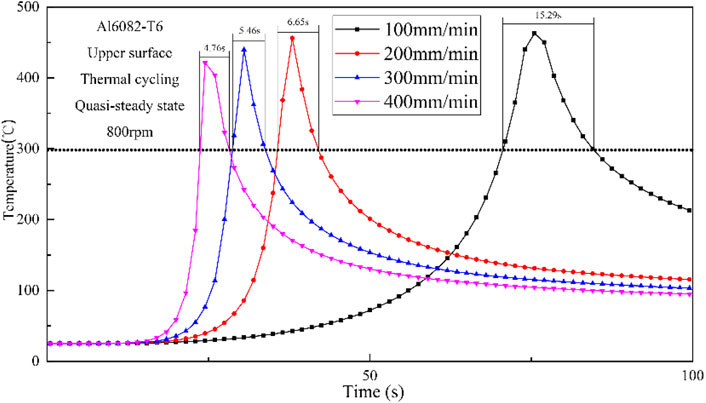
FIGURE 16. Thermal cycle curves of feature points under different travel speeds.
In the SSFSW process, large thermal input may reduce the viscosity of weld metal and produce more flash defects on the upper and lower surfaces of the workpiece, which is also detrimental to the mechanical properties of the joint. Increasing the travel speed can reduce peak temperature and high-temperature residence time, making it an effective method to improve the joint formation and mechanical properties of SSFSW by reducing thermal input. Compared with 100 mm/min, the high-temperature residence time is reduced by 56.5% under 200 mm/min, and the peak temperature is slightly reduced. When the travel speed is further increased to 300 and 400 mm/min, the high-temperature residence time is only reduced by 28.2%. Considering the above two factors, when the travel speed is 200 mm/min, both great joint formation and excellent mechanical properties can be obtained.
Figure 17 depicts the temperature distribution on the upper surface at a quasi-steady state under different rotation speeds when the travel speed is fixed as 100 mm/min. As the rotation speed increases, the transverse width and longitudinal length of the heating zone are increased, and the range of the high-temperature zone is significantly expanded, with the peak temperature rising. Figure 18 shows the thermal cycle curves of feature point b under different rotation speeds at the 100 mm/min travel speed. The peak temperature is 450.6°C when the rotation speed is 600 rpm, and the high-temperature residence time over 300°C is 12.58 s. When the rotation speed reaches 800 rpm, the peak temperature and high-temperature residence time are increased to 462.8°C and 15.29 s, respectively. The lowest peak temperature of 489.4°C and high-temperature residence time of 16.47 s are shown under the rotation speed of 1,000 rpm.
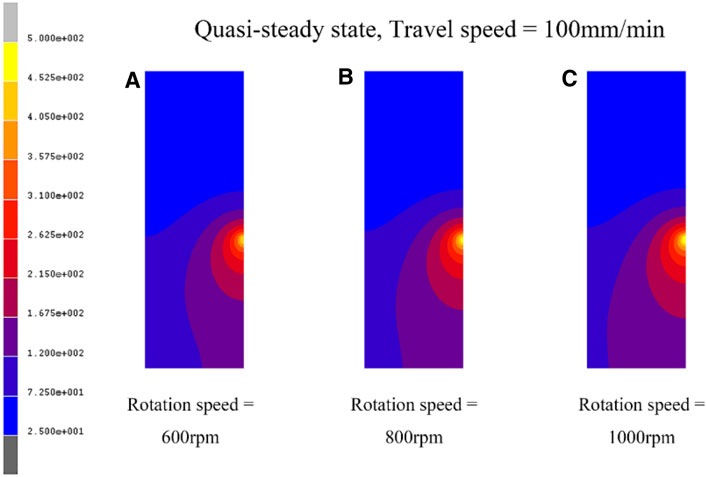
FIGURE 17. Contours of temperature distribution on the upper surface under different rotation speeds: (A) 600 rpm, (B) 800 rpm, (C) 1000 rpm.
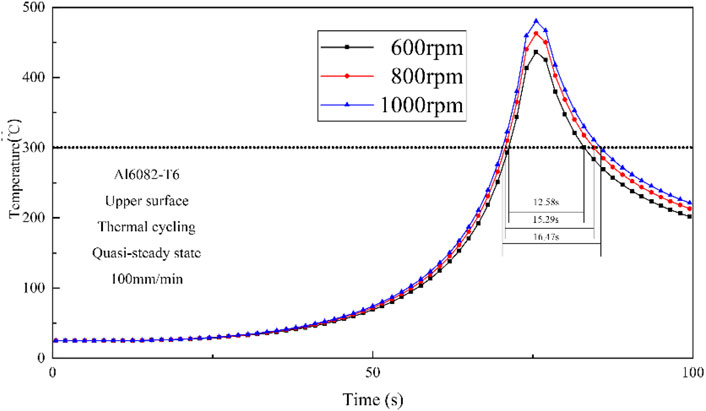
FIGURE 18. Thermal cycle curves of feature points under different rotation speeds.
Contrary to the travel speed, the increase of the rotation speed can increase the peak temperature and the high-temperature residence time. Reducing the thermal input within a certain range is beneficial to the mechanical properties of SSFSW joints. However, the low rotation speed is not able to ensure sufficient material flow, which may lead to welding defects. Therefore the 600 rpm rotation speed is not the best parameter. Compared with 1,000 rpm, the high-temperature residence time of the feature point is reduced by 7.2% under 800 rpm, and the peak temperature is reduced by 5.4%. Therefore, 800 rpm is considered as the proper rotation speed value for limiting the thermal input to a certain extent.
1) The temperature field of the SSFSW process is analyzed. The peak temperature of the stir zone appeared in the upper shoulder affected zone, followed by the lower shoulder affected zone. The temperature cloud map gradually moves along the welding direction as the welding process progresses and gradually expands to a quasi-steady state stage.
2) The influence of travel speed on temperature distribution at quasi-steady state in the SSFSW process is analyzed. Under fixed rotation speed, the peak temperature and the high-temperature residence are reduced with the increase of travel speed. Considering the thermal input and welding quality, 200 mm/min is the best parameter for the SSFSW of 5 mm 6082-T6 Al alloy.
3) The influence of rotation speed on temperature distribution at a quasi-steady state in the SSFSW process is analyzed. Under fixed travel speed, the peak temperature and the high-temperature residence are increased with the increasing rotation speed. Considering the thermal input and welding quality, 800 rpm is the best parameter for the SSFSW of 5 mm 6082-T6 Al alloy.
The raw data supporting the conclusion of this article will be made available by the authors, without undue reservation.
ZL: Conceptualization, Investigation, Writing–original draft. CL: Methodology, Investigation. SL: Popularization, Application. DY: Methodology, Writing–review and editing. ZQ: Methodology, Writing–review and editing. YT: Conceptualization, Supervision.
ZL, CL, SL, DY, ZQ, and YT were employed by Hebei Jingche Rail Transit Vehicle Equipment Co., Ltd.
All claims expressed in this article are solely those of the authors and do not necessarily represent those of their affiliated organizations, or those of the publisher, the editors, and the reviewers. Any product that may be evaluated in this article, or claim that may be made by its manufacturer, is not guaranteed or endorsed by the publisher.
El-Danaf, E. A., and El-Rayes, M. M. (2013). Microstructure and Mechanical Properties of Friction Stir Welded 6082 AA in as Welded and post weld Heat Treated Conditions. Mater. Des. 46, 561–572. doi:10.1016/j.matdes.2012.10.047
Hilgert, J., Schmidt, H. N. B., Dos Santos, J. F., and Huber, N. (2011). Thermal Models for Bobbin Tool Friction Stir Welding. J. Mater. Process. Technology 211, 197–204. doi:10.1016/j.jmatprotec.2010.09.006
Huang, Y., Meng, X., Xie, Y., Wan, L., Lv, Z., Cao, J., et al. (2018). Friction Stir Welding/processing of Polymers and Polymer Matrix Composites. Composites A: Appl. Sci. Manufacturing 105, 235–257. doi:10.1016/j.compositesa.2017.12.005
Huang, Y., Xie, Y., Meng, X., and Li, J. (2019). Atypical Grain Coarsening of Friction Stir Welded AA6082-T6: Characterization and Modeling. Mater. Sci. Eng. A 740-741, 211–217. doi:10.1016/j.msea.2018.10.109
Huang, Y., Xie, Y., Meng, X., Li, J., and Zhou, L. (2019). Joint Formation Mechanism of High Depth-To-Width Ratio Friction Stir Welding. J. Mater. Sci. Technology 35, 1261–1269. doi:10.1016/j.jmst.2019.01.016
Huang, Y., Xie, Y., Meng, X., Lv, Z., and Cao, J. (2018). Numerical Design of High Depth-To-Width Ratio Friction Stir Welding. J. Mater. Process. Technology 252, 233–241. doi:10.1016/j.jmatprotec.2017.09.029
Huang, Y. X., Wan, L., Lv, S. X., and Feng, J. C. (2013). Novel Design of Tool for Joining Hollow Extrusion by Friction Stir Welding. Sci. Technology Welding Joining 18, 239–246. doi:10.1179/1362171812Y.0000000096
Kawasaki, T., Makino, T., Masai, K., Ohba, H., Ina, Y., and Ezumi, M. (2004). Application of Friction Stir Welding to Construction of Railway Vehicles. JSME Int. J. Ser. A. 47, 502–511. doi:10.1299/jsmea.47.502
Kuykendall, K., Nelson, T., and Sorensen, C. (2013). On the Selection of Constitutive Laws Used in Modeling Friction Stir Welding. Int. J. Machine Tools Manufacture 74, 74–85. doi:10.1016/j.ijmachtools.2013.07.004
Liu, H. J., Hou, J. C., and Guo, H. (2013). Effect of Welding Speed on Microstructure and Mechanical Properties of Self-Reacting Friction Stir Welded 6061-T6 Aluminum alloy. Mater. Des. 50, 872–878. doi:10.1016/j.matdes.2013.03.105
Meng, X., Huang, Y., Cao, J., Shen, J., and dos Santos, J. F. (2021). Recent Progress on Control Strategies for Inherent Issues in Friction Stir Welding. Prog. Mater. Sci. 115, 100706. doi:10.1016/j.pmatsci.2020.100706
Meyghani, B., Awang, M., and Wu, C. S. (2020). Finite Element Modeling of Friction Stir Welding (FSW) on a Complex Curved Plate. J. Adv. Joining Process. 1, 100007. doi:10.1016/j.jajp.2020.100007
Thomas, W. M., Wiesner, C. S., Marks, D. J., and Staines, D. G. (2009). Conventional and Bobbin Friction Stir Welding of 12% Chromium alloy Steel Using Composite Refractory Tool Materials. Sci. Technol. Weld. Join. 14, 247–253. doi:10.1179/136217109X415893
Trueba, L., Torres, M. A., Johannes, L. B., and Rybicki, D. (2018). Process Optimization in the Self-Reacting Friction Stir Welding of Aluminum 6061-T6. Int. J. Mater. Form. 11, 559–570. doi:10.1007/s12289-017-1365-4
Wan, L., Huang, Y., Guo, W., Lv, S., and Feng, J. (2014). Mechanical Properties and Microstructure of 6082-T6 Aluminum Alloy Joints by Self-Support Friction Stir Welding. J. Mater. Sci. Technology 30, 1243–1250. doi:10.1016/j.jmst.2014.04.009
Wan, L., Huang, Y., Lv, Z., Lv, S., and Feng, J. (2014). Effect of Self-Support Friction Stir Welding on Microstructure and Microhardness of 6082-T6 Aluminum alloy Joint. Mater. Des. 55, 197–203. doi:10.1016/j.matdes.2013.09.073
Wang, G., Zhao, Y., and Hao, Y. (2018). Friction Stir Welding of High-Strength Aerospace Aluminum alloy and Application in Rocket Tank Manufacturing. J. Mater. Sci. Technology 34, 73–91. doi:10.1016/j.jmst.2017.11.041
Wang, X., Gao, Y., Liu, X., McDonnell, M., and Feng, Z. (2021). Tool-workpiece Stick-Slip Conditions and Their Effects on Torque and Heat Generation Rate in the Friction Stir Welding. Acta Materialia 213, 116969. doi:10.1016/j.actamat.2021.116969
Wen, Q., Li, W. Y., Gao, Y. J., Yang, J., and Wang, F. F. (2019). Numerical Simulation and Experimental Investigation of Band Patterns in Bobbin Tool Friction Stir Welding of Aluminum alloy. Int. J. Adv. Manuf. Technol. 100, 2679–2687. doi:10.1007/s00170-018-2750-y
Xie, Y., Huang, Y., Meng, X., Wang, F., Wan, L., Dong, Z., et al. (2020). Friction Rivet Joining towards High-Performance wood-metal Hybrid Structures. Compos. Structures 247, 112472. doi:10.1016/j.compstruct.2020.112472
Xie, Y., Meng, X., Li, Y., Mao, D., Wan, L., and Huang, Y. (2021). Insight into Ultra-refined Grains of Aluminum Matrix Composites via Deformation-Driven Metallurgy. Composites Commun. 26, 100776. doi:10.1016/j.coco.2021.100776
Xie, Y., Meng, X., Mao, D., Qin, Z., Wan, L., and Huang, Y. (2021). Homogeneously Dispersed Graphene Nanoplatelets as Long-Term Corrosion Inhibitors for Aluminum Matrix Composites. ACS Appl. Mater. Inter. 13, 32161–32174. doi:10.1021/acsami.1c07148
Xie, Y., Meng, X., Wang, F., Jiang, Y., Ma, X., Wan, L., et al. (2021). Insight on Corrosion Behavior of Friction Stir Welded AA2219/AA2195 Joints in Astronautical Engineering. Corrosion Sci. 192, 109800. doi:10.1016/j.corsci.2021.109800
Xu, W., Luo, Y., Zhang, W., and Fu, M. (2018). Comparative Study on Local and Global Mechanical Properties of Bobbin Tool and Conventional Friction Stir Welded 7085-T7452 Aluminum Thick Plate. J. Mater. Sci. Technology 34, 173–184. doi:10.1016/j.jmst.2017.05.015
Yang, C., Ni, D. R., Xue, P., Xiao, B. L., Wang, W., Wang, K. S., et al. (2018). A Comparative Research on Bobbin Tool and Conventional Friction Stir Welding of Al-Mg-Si alloy Plates. Mater. Characterization 145, 20–28. doi:10.1016/j.matchar.2018.08.027
Keywords: aluminum alloys, friction stir welding, numerical simulation, modeling, asymmetry thermal analyses
Citation: Li Z, Li C, Li S, Yin D, Qi Z and Tian Y (2022) Asymmetry Thermal Analyses of Self-Supporting Friction Stir Welding. Front. Mater. 8:813661. doi: 10.3389/fmats.2021.813661
Received: 12 November 2021; Accepted: 26 November 2021;
Published: 03 January 2022.
Edited by:
Xiangchen Meng, Harbin Institute of Technology, ChinaReviewed by:
Jinglin Liu, Harbin Institute of Technology, ChinaCopyright © 2022 Li, Li, Li, Yin, Qi and Tian. This is an open-access article distributed under the terms of the Creative Commons Attribution License (CC BY). The use, distribution or reproduction in other forums is permitted, provided the original author(s) and the copyright owner(s) are credited and that the original publication in this journal is cited, in accordance with accepted academic practice. No use, distribution or reproduction is permitted which does not comply with these terms.
*Correspondence: Chong Li, bGljaG9uZ0BydHRlLmNu
Disclaimer: All claims expressed in this article are solely those of the authors and do not necessarily represent those of their affiliated organizations, or those of the publisher, the editors and the reviewers. Any product that may be evaluated in this article or claim that may be made by its manufacturer is not guaranteed or endorsed by the publisher.
Research integrity at Frontiers
Learn more about the work of our research integrity team to safeguard the quality of each article we publish.