 Indrajeet Mandal1
 Saswata Chakraborty2,3Manasi Ghosh4
 Krishna K. Dey5
 K. Annapurna2,3
 Amarnath R. Allu1,3*
- 1Energy Materials and Devices Division, CSIR-Central Glass and Ceramic Research Institute, Kolkata, India
- 2Specialty Glass Division, CSIR-Central Glass and Ceramic Research Institute, Kolkata, India
- 3Academy of Scientific and Innovative Research (AcSIR), CSIR- Human Resource Development Centre, Ghaziabad, India
- 4Physics Section, MMV, Banaras Hindu University, Varanasi, India
- 5Department of Physics, Dr. Harisingh Gour Central University, Sagar, India
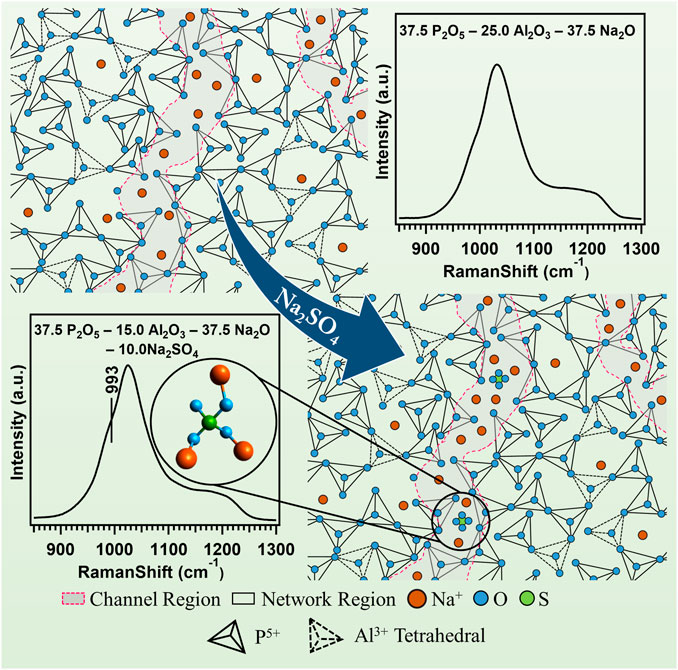
Identifying the factors influencing the movement of sodium cations (Na+) in glasses accelerates the possible options of glass-based solid electrolyte materials for their applications as a promising electrolyte material in sodium-ion batteries. Nevertheless, due to the poor correlation between the structure and conductivity in glass materials, identifying the factors governing the conductivity still exists as a challenging task. Herein, we have investigated the DC-conductivity variations by correlating the structure and conductivity in sodium superionic conductor (NASICON) based Na3Al2P3O12 (NAP) glass (mol%: 37.5 P2O5—25.0 Al2O3—37.5 Na2O) due to the successive substitution of Na2SO4 for Al2O3. Structural variations have been identified using the Raman and magic-angle spinning nuclear magnetic resonance (MAS-NMR) (for 31P, 23Na, and 27Al nuclei) and conductivity measurements have been done using the impedance spectroscopy. From the ac-conductivity spectra, the correlations between mean square displacement (MSD) and dc-conductivity and between the Na+ concentration and dc-conductivity have also been evaluated. Raman spectra reveal that the increase in the Na2SO4 concentration increases the number of isolated SO42− sulfate groups that are charge compensated by the Na+ cations in the NAP glass. MAS-NMR spectra reveal that the increase in Na2SO4 concentration increases the concentration of non-bridging oxygens and further neither S-O-P nor S-O-Al bonds are formed. Impedance spectroscopy reveals that, at 373 K, the DC conductivity of the NAP glass increases with increasing the Na2SO4 up to 7.5 mol% and then decreases with the further increase. In the present study, we have shown that the mobility of sodium cations played a significant role in enhancing the ionic-conductivity. Further, we have shown that inter-ionic Coulombic interactions and the structural modification with the formation of SO42− units significantly influence the critical hopping length < R2 (tp)> of the sodium cations and consequently the mobility and the ionic conductivity. The present study clearly indicates that, based on the compositions, glass materials can also be treated as strong-electrolyte materials.
GRAPHICAL ABSTRACT. Table of contents.
Introduction
Owing to the slow progress in the pace of battery development, the unprecedented development in the field of electronics over the past few decades has not had a full impact on new technologies (Armand and Tarascon, 2008). One of the causes for the slow development of batteries is the lack of high energy density and safe electrolytes. To overcome this problem, most research is being focused on the development of solid electrolytes which are stable and non-flammable (Hayashi et al., 2012; Kim et al., 2017). Among the various types of solid materials, glass electrolytes are far ahead of other electrolytes due to their low cost, durability, and homogeneity, and they are leak-proof. As battery demand continues to grow, it has become necessary to use some of the lithium alternatives due to the scarcity of lithium sources, and sodium has gone a long way in terms of low cost, safety, and adequate availability (Vignarooban et al., 2016; Wang et al., 2019).
Electrolytes are mainly used to allow ions and to block electrons, and the feature of a good electrolyte is that it should allow a large number of ions through it at a higher speed. The conductivity (σ) of ions in electrolytes generally depends on mobility (μ) and carrier concentration (c) of ions. It is expressed with the relation of σ = Zeμc, where Z is the valance number of charge carriers and e is the charge of an electron. In general, glass materials are treated as weak electrolyte materials since the ion conductivity in glass materials is largely dependent on the concentration of charge carriers instead of the mobility of mobile cations (Ingram et al., 1980). Considering this, many attempts have been made to increase the conductivity by increasing the concentration of mobile ions (Adhwaryu and Kanchan, 2021; Mandal et al., 2021). Nonetheless, this concept has not been fulfilled in many glass materials. For example, in the study of Ag+ ion conduction in AgI-Ag2O-B2O3-P2O5 glass, with increasing AgI up to 5 wt% conductivity increases and a further increase in AgI decreases the conductivity (Adhwaryu and Kanchan, 2021). Several studies have reported that the conductivity of glass materials depends on the chemical composition-dependent network structure and the distribution of structural units around the alkali ions (Na+, Li+, etc.) (Jamal et al., 1999; Bhide and Hariharan, 2007; Mandal et al., 2021). Therefore, it is clearly understood that the factors governing the enhanced ionic conductivity in glass materials absolutely depend on the concentration, mobility, and on network structure of glass. It is noted that the relationship between conductivity/property and structure in glass materials has been poorly identified. Due to this, most of the glass materials considered so far for the development of high ionic conductivity materials are designed using a time-consuming trial and error method. Recently, it has been shown that systematic variations in the chemical composition of glass through understanding the structure have led to the development of bilayer glass-ceramic sealant for solid oxide fuel cell applications (Reddy et al., 2015).
NASICON (NAtrium Super Ionic CONductor) type solid electrolyte is far ahead of other electrolytes due to its fast ionic conductivity and structural stability (Hong, 1976; Jian et al., 2017). Generally NASICON type compounds have the formula of AB (XO4)3, where A, B, and X are monovalent, tetravalent, or pentavalent cations (Leo et al., 2002). Due to high conductivity at room temperature, current research focuses on various NASICON–based glass-ceramic composite electrolytes. However, their time-consuming synthesis process becomes a barrier to their industrial application. On the other hand, due to the absence of grain boundary regions and isotropic property of ion migration, NASICON–based phosphorus glass can be adopted as suitable solid electrolyte materials. For example, H.Y-P. Hong (Hong, 1976) has reported that NASICON type Na1+XZr2SiXP3-XO12 crystal structure has faster ion conduction due to its skeleton structure consisting of a three-dimensional network. Recently, NASICON based Na3Al2P3O12 (NAP) glass is studied for its structure and electrical properties and found that the conductivity can be enhanced by modifying its chemical compositions (Keshri et al., 2021; Mandal et al., 2021). NAP glass is mainly composed of PO4 and AlO4 tetrahedral units, where each PO4 unit is surrounded by AlO4 units. In NAP glass structure, the negative charge on the AlO4 tetrahedral unit is usually compensated by the positive PO4 tetrahedral units and most of the Na+ ions act as a network modifier and break the Al-O-P bonds to form new terminal P-O- bonds, which are charge compensated by the Na+ cations. Na+ cations are usually loosely attached to this non-bridging oxygen and help to increase the ionic conductivity in the glass. However, the ionic conductivity of NAP glass needs to be enhanced to utilize it in practical applications of sodium-ion batteries.
In oxide glasses, sulphur ion derivatives (
In view of the above, the present report focuses on the influence of Na2SO4 (2.5–10.0 mol%) on enhancing the ionic conductivity of NAP glass and the correlation between the structure and conductivity properties. With the following expectations, Na2SO4 has been selected for the substitution of Al2O3 in the NAP glass: (1) increases the concentration of sodium cations, (2) decreases the activation energy due to weaker bond strength of Na+ with SO42− units, and (3) modify the structure of NAP glass. Raman and MAS-NMR spectral analyses were conducted to detect structural changes in NAP glasses due to the substitution of different concentrations of Na2SO4 for Al2O3. DTA was used to evaluate the thermal properties of glasses. The ionic conductivity of glass specimens was measured by electrochemical impedance spectroscopy. Ac-conductivity spectra were analysed by applying the scaling method to explore the temperature and other factors such as concentration, hopping length, and mobility effect on the ionic conductivity changes in glasses.
Experimental
Table 1 shows the chemical composition of the NAPS glasses. The glasses in Table 1 are arranged according to their chemical composition. For the preparation of 30 g homogenous batch of glass sample, high purity powder of NH6PO4 (99.9% Sigma Aldrich), Al2O3 (99.9%, Sigma Aldrich), Na2CO3 (99.9%, Sigma Aldrich), and Na2SO4 (99.9% Sigma Aldrich) have been used as raw material. In the present study, all glasses have been prepared using melt-quenching techniques. Glass batches were melted in an electric furnace at a temperature of 1,000°C using alumina crucibles. Molten glass is first poured into a preheated bronze mold and then transferred to an annealing furnace at around 350°C to produce glasses in bulk form. Bulk glasses of different Na2SO4 concentrations were cut into small round pieces with a diameter of 8.8–10.0 mm and a thickness of 1.4–1.5 mm, and they were well polished. Dimensions were then measured using a high-precision digital Vernier caliper for the purpose of data analysis.
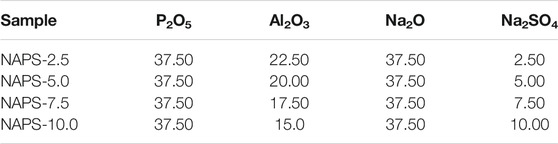
TABLE 1. Chemical composition of glasses (mol%).
All the experiments were carried out in ECX 500 MHz JEOL NMR spectrometer with double resonance probe and a rotor diameter of 3.2 mm. 27Al referenced were done externally with 1M Al(NO3) solution and 31P reference was done with 85% H3PO4 solution, and 23Na reference was done with 1M NaCl solution. Magic Angle Spinning (MAS) frequency for 27Al was 12 kHz for the 1D experiment and pulse length was 20° for better excitation. The relaxation delay for 1D27 Al was 20 s. MAS frequency for 31P 1D NMR was 18 kHz and relaxation delay was 300 s. The pulse length for 31P experiment was 45 Degree for better excitation. For 23Na 1D experiment relaxation delay was 15s and MAS spinning frequency was 12 kHz. Raman spectroscopy for all bulk glasses was performed using the Horiba Labram HR evolution Raman spectrometer under a 488 nm Ar ion laser with a power of 20 mW.
In our current study PGSTAT12/30 Differential Electrometer has been used to measure the electrical impedance spectra (EIS) data using a sinusoidal alternating voltage of amplitude 0.3 V in the frequency range of 0.1–100,000 Hz. This experiment was performed in the air atmosphere using two platinum probes in a temperature range of 323–473 K to collect temperature-dependent EIS data.
Result and Discussions
Raman
The Raman spectra for the entire glass samples within the range of 200 cm−1–1,600 cm−1 are shown in Figure 1A. To simplify the analysis, the spectra are divided into three regions. The first region is the low-frequency region varies between 200 cm−1 and 400 cm−1, the second region is the middle-frequency region between 400 cm−1 and 800 cm−1, and the third region is the high-frequency region between 800 cm−1 and 1,600 cm−1. In the case of NAPS-2.5 glass, a high-intensity vibrational band at 1,031 cm−1 along with a shoulder peak at 1185cm−1 is observed in the high-frequency range. For further analysis, the Raman spectrum in the high-frequency region is deconvoluted into Gaussian peaks and deconvoluted Raman spectra are shown in Supplementary Figure S1. The deconvolution results are provided in Table 2. Previous studies on similar types of glass suggest that the high-intensity vibrational band around 1030 cm−1 is due to the symmetric stretching vibrations of P-O− bonds located in AlPO4 groups, which are enriched with Q0(3Al) and Q0(2Al) units in NAP glass (Mandal et al., 2021). However, as it has been reported by Yifen et al. (Yifen et al., 1986), NAP glass consists of two types of AlPO4 groups (AlPO4)0 and (AlPO4)Na. In the latter group, charge deficiency at the oxygen due to tetrahedral coordination of aluminum is compensated by the sodium, whereas in the former the charge deficiency is compensated by the phosphorus tetrahedral. Peaks observed at 1,032 cm−1 and 1,033 cm−1 are, therefore, attributed to (AlPO4)0 units and (AlPO4)Na units, respectively. The peaks observed at 1,157 and 1,214 cm−1 are ascribed to Q2(0Al) and Q2(1Al) units, respectively. It is known that the Raman shift of a structural unit decreases with decreasing bond strength around the structural units (McKeown et al., 2001). With the increasing substitution of Na2SO4 for Al2O3 in NAP glass, the Raman shifts of all the Gaussian peaks in the higher frequency regions are decreasing, suggesting that P-O-Al bonds in AlPO4groups, Q2(0Al), and Q2(1Al) units are replaced with P-O-Na bonds. A slight shift in the peaks corresponding to the AlPO4 groups indicates minor structural changes in the NAP glass structure with the addition of Na2SO4 up to 10 mol%. For NAPS-10 glass, the peak that appears at 1,112 cm−1 can be attributed to the Q1(1Al) units, and the peak that appear at 1,180 cm−1can be assigned to Q2(0Al) units. From Supplementary Figure S1 and Table 2, it can be noted that the substitution of Na2SO4 for Al2O3 in NAP glass significantly reduced the concentration of (AlPO4)0 and Q2(1Al) units by replacing the P-O-Al bonds with P-O-Na bonds. Nevertheless, a poorly resolved vibrational band at around 993 cm−1 is observed for NAPS-10 glass. This peak can be unambiguously assigned to the SO42− structural units associated with the sodium cations (Tsujimura et al., 2004; Vaishnav et al., 2020). Therefore, it can be confirmed that Sulphur exists in the form of sulfate in the NAP glass and occurs in the deep channel regions of NAP glass. In a previous report, it has been shown that the NAP glass network structure adopts the modified random network (MRN) model (Mandal et al., 2021). According to MRN model, the glass network structure consists of well-defined network regions separated by modifier cations enriched channel regions. The presence of sulfate units in NAPS-2.5, NAPS-5.0, and NAPS-7.5 glass cannot be neglected since the Raman peaks corresponding to these units might have overlapped with the broad Raman peaks of AlPO4 groups. The appearance of a slight bend at around 990 cm−1 in all the spectrum of glasses (Figure 1B) clearly indicates the presence of SO42− units surrounded by sodium cations.
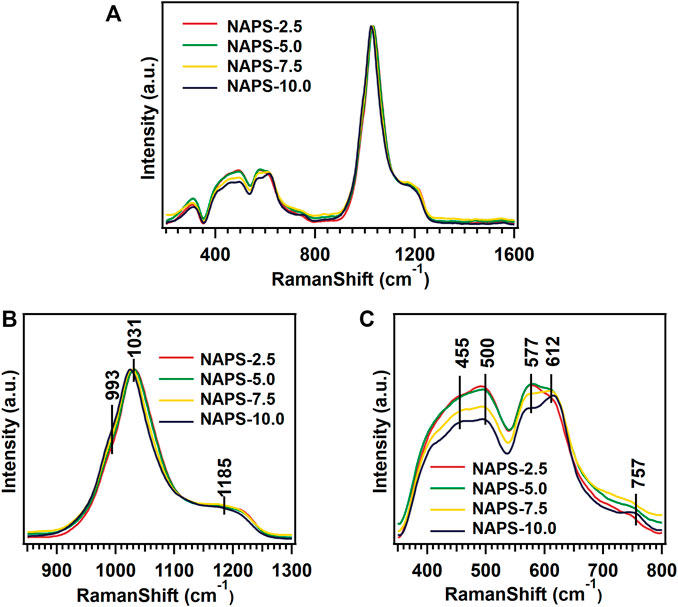
FIGURE 1. Raman spectra for different glass samples.
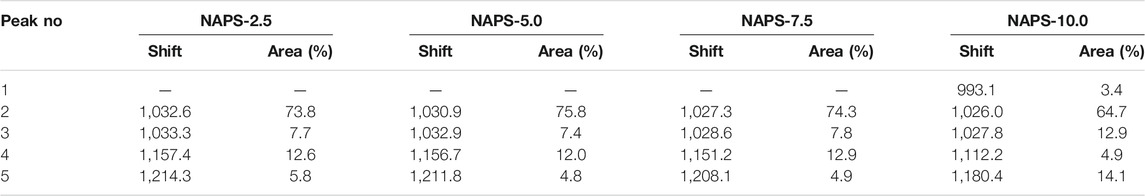
TABLE 2. Raman spectra deconvolution results.
In the middle frequency region of Raman spectra, two less intensity vibrational bands located around 500 cm−1 and 600 cm−1are identified. Each vibrational band is resolved into two vibrational bands and the peaks appear at 455cm−1, 500 cm−1, 577 cm−1, and 612 cm−1 (Figure 1C). The vibration bands around 455cm−1, 500cm−1, and 612 cm−1 represent the O-Al-O, O-P-O, and P-O-Al vibrations in the AlPO4 structural units, respectively (Nelson and Exarhos, 1979; Rokita et al., 2000; Bingham et al., 2009; Möncke et al., 2018). The peak at 577 cm−1 represents the vibration of AlO6 units and the peak at 757 cm−1 that appeared in NAPS-10.0 glass is attributed to the bridging oxygen of P-O-P bonds located in Q1 units. In the low-frequency range, a resolved low-intensity band around 306 cm−1 exhibited in all the spectrum of glasses, and this peak is attributed to the lattice vibrations involving Na+ cations (Miettinen, 2006). In the middle frequency region, the intensity of the peaks decreases with the substitution of >5.0 mol% of Na2SO4. This indicates that the bonds that involved the aluminum such as O-Al-O and P-O-Al might be rearranged with the addition of Na2SO4. It is to be noted that, in the low and middle-frequency region, we have not detected significant changes in the position of the bands.
MAS-NMR
31P, 27Al, and 23Na MAS-NMR spectra for all the glasses are shown in Figure 2. The 31P MAS-NMR spectra for all the glasses show two peaks with the peak positions located at around -5 and -13 ppm. For further analysis, 31P MAS-NMR spectra are deconvoluted (Supplementary Figure S2) into four Gaussian peaks. The parameters obtained after the deconvolution are tabulated in Table 3. For NAPS-2.5 glass, the peaks after deconvolution are identified at around −25, −13.5, −4, and 3 ppm, which are attributed to the isolated phosphate tetrahedral units associated with four, three, two, and one tetrahedral units, i.e., Q0(4Al), Q0(3Al), Q0(2Al), and Q0(1Al), respectively. Considering the presence of the Raman vibrational band at 1,214 cm−1corresponding to the Q2(1Al) structural units, the peak observed at −25 ppm can also be attributed to the Q2(1Al) units. Significant disturbances are observed with the addition of Na2SO4, the intensity of the peak observed at around −4 ppm increases with increasing the addition of Na2SO4 and it becomes dominant for NAPS-10.0 glass. This indicates that, upon the addition of Na2SO4, the NAPS-10.0 glass depolymerizes through the formation of Q0(2Al) structural units. It is to be noted that the chemical shift difference between the Q0(1Al) and Q1(0Al) is very small. Therefore, the peak at around −4 ppm can also represent the existence of Q1(0Al) phosphate units. Nevertheless, the presence of such units is revealed only from the Raman spectra for NAPS-10.0 glass. Thus, the contribution of Q1(0Al) units for the peak at −4 ppm in 31P MAS-NMR spectra may not be significant but their presence cannot be neglected. Apart from the formation of Q0(2Al) units over Q0(3Al) units, the addition of Na2SO4 influenced the chemical shift of Q0(1Al) units and shifts towards more positive values. This indicates the deshielding of Q0(1Al) units, possibly due to the changes in the coordination of aluminium with the addition of Na2SO4. Overall, it is understood that the addition of Na2SO4 significantly reduces the connectivity of the aluminophosphate network within the AlPO4 groups through the formation of Q0(2Al) units and increases the connectivity within the phosphate units through the formation of Q1(0Al) units.
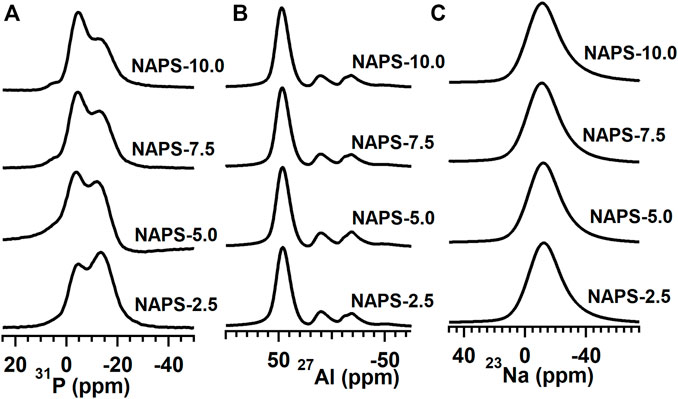
FIGURE 2. (A) 27Al 1D NMR spectrum at MAS speed 12 kHz. (B) 31P 1D NMR spectrum, at MAS speed 18 kHz, and (C) 23Na 1D spectrum at 12 kHz. All these spectra were recorded at 500 MHz JEOL ECX NMR spectrometer.
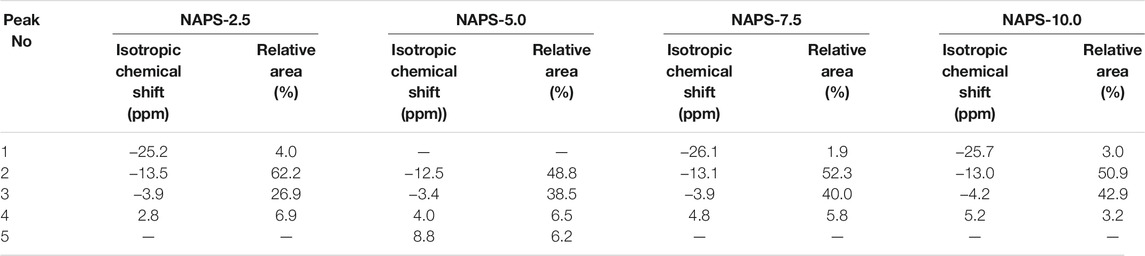
TABLE 3. 31P MAS–NMR deconvolution results using Gaussian model.
The 27Al MAS-NMR spectra for all the glasses clearly show the well-resolved three resonance peaks positioned at around 47, 9, and −18 ppm, which are ascribed to the AlO4, AlO5, and AlO6 structural units. The high intensity of the peak at around 47 ppm in 27Al NMR spectra clearly indicates that all the glasses have a significantly higher content of AlO4 units. 27Al MAS-NMR measured for all the glasses are further deconvoluted (Figure 3) using the CZsimple method in the DMFit software and the fitting parameters are provided in Table 4. The isotropic chemical shift for AlO4 units does not change significantly, except slight deshielding effect, with increasing the addition of Na2SO4. This indicates that environments around the AlO4 units are similar, i.e., solely associated with the PO4 units and not connected with the SO4 units. Changes that are observed in the 27Al MAS-NMR spectra with the addition of Na2SO4 are the fraction of AlO6 and AlO5 units, the former increases while the latter decreases. The presence of a higher fraction of AlO6 units in the present glass systems compared to that of NAP glass could be due to the presence of Q1 units. It has been reported that, in aluminophosphate glasses, the Q1 phosphate tetrahedral units require AlO6 units for charge compensation in addition to sodium cations.
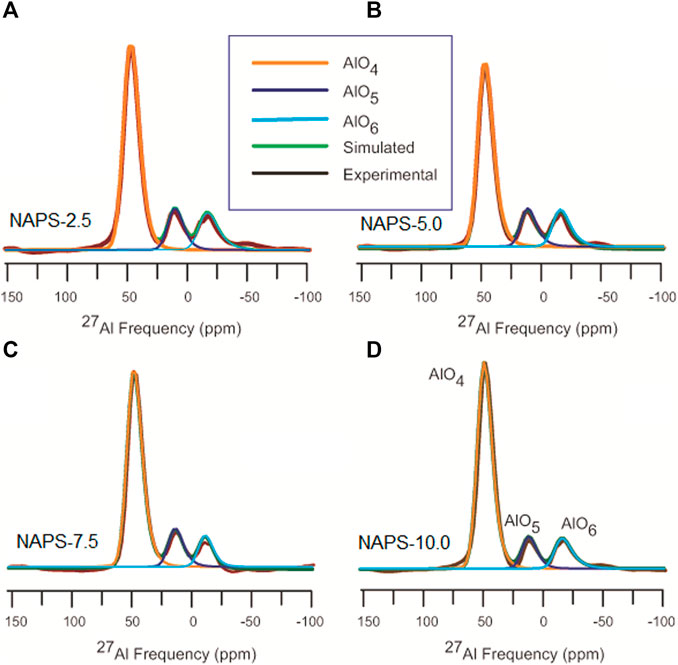
FIGURE 3. Deconvolution of 27Al MAS-NMR spectra using czSimple model using DMfit software. The insert shows simulated and experimental spectra of central transition.
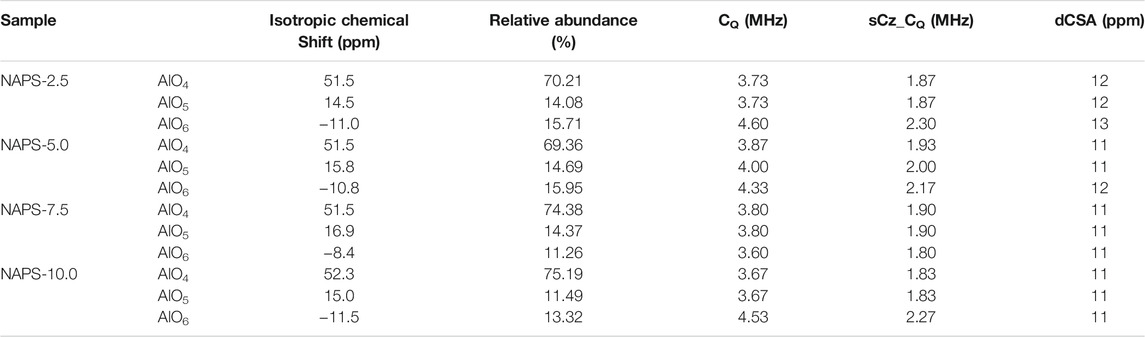
TABLE 4. 27Al MAS-NMR deconvolution parameters. sCZ_CQ represent the distribution of Quadrupolar coupling constant CQ. dCSA represents the distribution of isotropic chemical shift.
23Na MAS-NMR spectra shown in Figure 2 display broad and symmetric line shapes. Spectral details after the implementation of the CZsimple model for 23Na MAS-NMR spectra (Figure 4) are given in Table 5. The isotropic chemical shift of 23Na for NAPS-2.5 glass is observed at around -12 ppm. The chemical shift moves towards the higher chemical shifts with increasing concentration of Na2SO4 and appears at −10 ppm for NAPS-10.0 glass. Sodium cations in aluminophosphate glasses majorly function as modifier cations and are associated with the NBOs for compensating their negative charge. It has been reported that the 23Na chemical shift depends on the Na-O bond length. The chemical shift moves towards the lower chemical shifts with increasing the bond length (Angeli et al., 2000). In the present study, the 23Na chemical shift moves towards the more positive values, indicating the Na-O bond lengths are decreasing with increasing the Na2SO4. It is known that the sodium cations in glasses containing alumina play the role of a charge compensator and modifier cations. The increase in the concentration of the charge compensator increases the Na-O bond length (Angeli et al., 2000; Glatz et al., 2019). Higher covalent S-O bonds create more ionic Na-O bonds, i.e., longer Na-O bonds. The decrease in Na-O bond lengths in the present study suggests that the sodium cations are functioning as modifiers and prefer to bond with the PO43- units in addition to that of SO42− units.
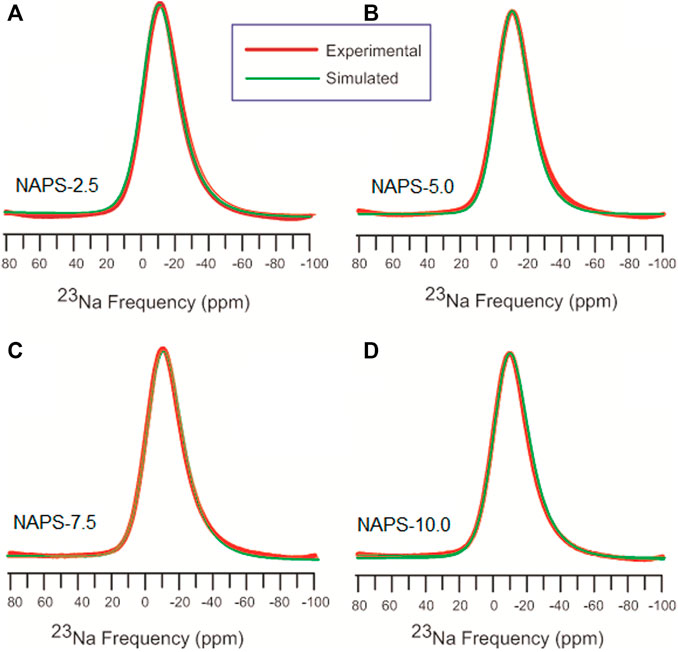
FIGURE 4. 23Na MAS-NMR deconvolution with czSimple model.
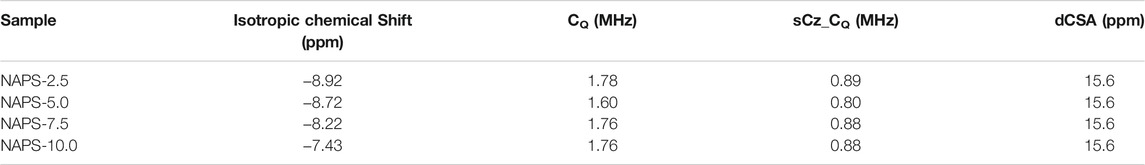
TABLE 5. 23Na MAS-NMR deconvolution parameters. sCZ_CQ represent the distribution of Quadrupolar coupling constant CQ. dCSA represents the distribution of isotropic chemical shift.
DC Conductivity
Impedance spectra of all the glass samples were measured using impedance spectroscopy technique in the frequency range 100 mHz–100 kHz and in the temperature range of 323–473 K. All impedance data have been normalized to its geometrical factor, i.e., A/t so that they can be compared well, where A is the area and t is the thickness of the glass sample. Figure 5A shows the Z″ vs Z′ graph where Z″ and Z′ are the imaginary and real parts of the complex impedance data. Figure 5A clearly shows two different regions in the impedance spectrum of different glass samples. The first region is the high-frequency region where a depressive semicircle is formed, and the second is the low-frequency region where a short tail is formed. Depressed semicircle represents a bulk property of the sample and the short tail represents charge accumulation between the metallic electrode and glass electrolyte (Irvine et al., 1990). An equivalent circuit (shown in the inset of Figure 5A) was fitted in the higher frequency region to extract the DC conductivity data. In the equivalent circuit, R1 is the ohmic resistance due to the resistance of the metal electrode and connected wires., R2 represents bulk resistance of the glass samples, and CPE represents the constant phase element. All the values of R1, R2, and CPE at 373 K for all the samples are tabulated in Supplementary Table S2. DC conductivity was calculated using the formula
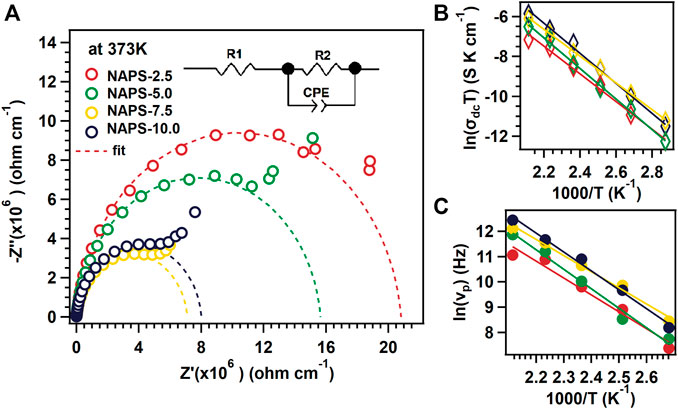
FIGURE 5. (A) Impedance spectra for different glass samples at 373 K temperate. Inset shows equivalent circuit for dashed fitted lines. (B) Arrhenius plot for different temperature and glass samples. (C) Temperature dependence of νP for different glass samples.
At low-temperature range, i.e., from 348–398 K with increasing the substitution of Na2SO4 for Al2O3 the DC conductivity of the NAPS glass increases up to 7.5 mol% of Na2SO4. Nevertheless, the substitution of 10 mol% Na2SO4 decreases the DC-conductivity. In the case of the high-temperature range, i.e., from 348–473 K, the DC-conductivity of NAPS glass increases with increasing the Na2SO4 concentration.
For all glass samples, DC-conductivity increases linearly with the inverse temperature as shown in Figure 5B. To extract the value of Ea the data presented in Figure 5B was fitted with the Arrhenius equation, i.e.,
where σdc is the DC-conductivity, T is the temperature, σ0 is the pre-exponential constant, Ea is the activation energy, and kb is the Boltzmann constant. The extracted activation energy values for different glass samples are in the range of 0.578 ± 0.011 eV to 0.658 ± 0.020 eV. The activation energy is lowest for NAPS-7.5, i.e., 0.578 ± 0.011 eV; this implies that NAPS-7.5 needs less amount of energy to activate the Na + cations for its movement.
AC Conductivity
To understand the ion dynamics in the glass structure, it is necessary to analyze frequency-dependent conductivity. The real part of the frequency-dependent AC-conductivity spectrum was calculated using the formula:
where Z′ and Z″ are the real and imaginary parts of the impedance spectra, t is the thickness, and A is the area of the samples. Figure 6 shows the AC conductivity spectra for NAPS-2.5 and NAPS-10.0 glass sample at different temperature ranges.
FIGURE 6. ac conductivity spectra for NAPS-2.5 and NAPS-10.0 glass samples.
For further analysis, AC conductivity spectra were fitted with the Jonscher’s power law equation (Jonscher, 1977)
where ν is the frequency, νP is the crossover frequency, and s is a constant. All extracted values of νP, s, and σdc are tabulated in Supplementary Table S1. The physical significance of νP frequency is that the long-range longitudinal motion of the mobile cations converts into the short-range back and forth motion. The range of s is usually between 0 and 1. The physical significance of s is that, at a low value of s, with increasing frequency, conductivity changes slowly; with high value of s conductivity changes rapidly with respect to the frequency. This indicates that ion-conduction pathways increase with the increasing value of s. In our present study, value of s is between the range 0.84 and 0.96 which clearly indicates three-dimensional conduction pathways of mobile cations (Sidebottom, 1999)
To analyse the temperature-dependent phenomena of crossover frequency, νP vs 1,000/T graph is plotted and is shown in Figure 5C. All the data points for different glass samples follow a straight line and obey the Arrhenius relation
where
Scaling Procedures
In general, AC-conductivity depends on frequency and temperature; but the shape of the ac-conductivity curve is independent of the temperature. Therefore, it is possible to detect the variables that change during the length scale diffusion using Time Temperature Superposition Principle (TTSP). Ion-conducting glasses mostly adhere to the TTSP principle, which implies that the ion dynamics are independent of temperature. To evaluate the applicability of TTSP principle and therefore to extract the variations in the dynamics of mobile cations either with temperature or the chemical composition of glass variations, a scaling or normalization process is usually adopted. In general, several scaling procedures are developed to validate TTSP using the scaling law of σac(ν)/σdc = F (ν/b), where ν is the frequency, b is the scaling parameter, σac(ν) is the ac conductivity, and σdc is the dc-conductivity. In 1991 Kahnt used νp as a scaling parameter, where νp is the characteristics frequency, and it follows the relation σac (νp) = 2σdc (Kahnt, 1991). Ghosh et al. used the same scaling formalism in Lithium tellurite glasses (Ghosh and Pan, 2000). Similarly, Summerfield proposed σdcT as a scaling parameter (Summerfield, 1985).
In our first approximation, Summerfield scaling law
was used to superimpose the ac-conductivity isotherms measured at various temperatures, and resultant curves are shown in Figures 7A,B for NAPS-2.5 and NAPS-10.0 glasses. Conductivity isotherms at different temperatures for all the samples form a master curve. This result indicates that temperature-dependent mobility is playing a major role in enhancing the ionic conductivity and the concentration of charge carriers are not varying with increasing temperature. Nevertheless, as shown in Figures 7C,D, the conductivity isotherms measured at 373 and 473 K for all the samples do not superimpose with each other to reveal a master curve. This indicates that, at a particular temperature, apart from the mobility other variable parameters vary with varying the concentration of Na2SO4.
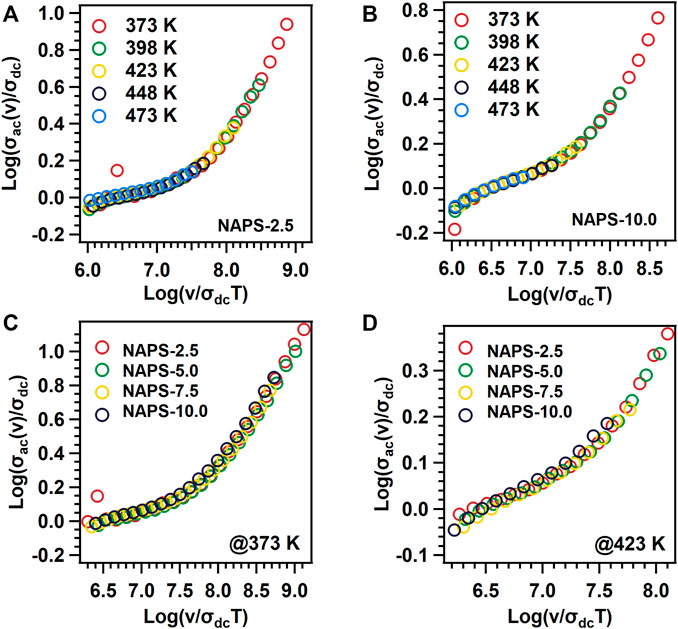
FIGURE 7. Log (σαχ(ν)/σdc) vs Log (ν/σdcT) graphs for (A) NAPS-2.5 (B) NAPS-10.0 glass sample at different temperature range and different glass samples at (C) 373 K and (D) 423 K temperature.
In the second approximation, all the ac-conductivity isotherms measured at various temperatures are superimposed with each other using the νp as a frequency axis scaling factor as is proposed by Ghosh et al., and the curves are shown in Figures 8A,B. Figures 8C,D show the superimposition of ac-conductivity isotherms for all the glass samples measured at 373 and 473 K. Figures 8A,B reveals that the spectra measured at different temperatures superimpose with each other and result in a master curve. Further, contrary to Figures 7C,D, 8C,D disclose that ac-conductivity isotherms for all the glass samples at a specific temperature are superimposed with each other. This indicates that simultaneous variations in the fraction of charge carriers and distance traveled by the mobile cation in a single hop with varying the Na2SO4 concentration in NAP glass.
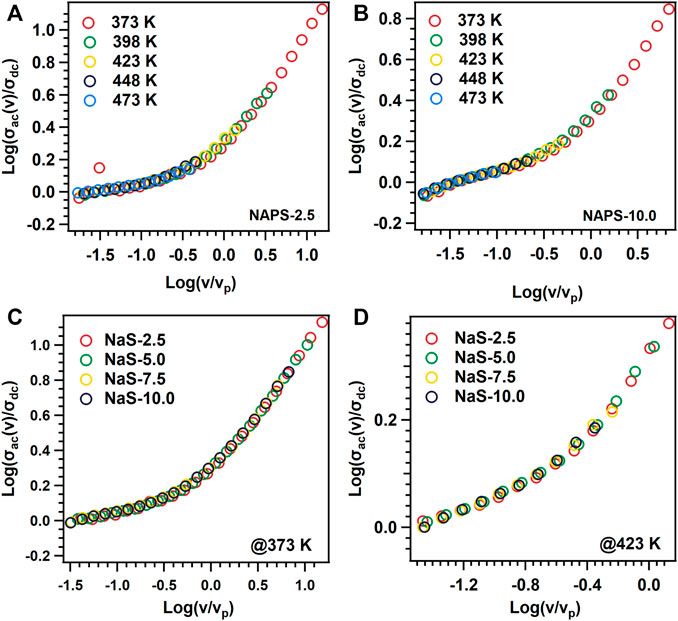
FIGURE 8. Log (σαχ(ν)/σdc) vs Log (ν/νp) graphs for (A) NAPS-2.5 (B) NAPS-10.0 glass sample at different temperature range and different glass samples at (C) 373 K and (D) 423 K temperature.
According to the Walden rule (Sidebottom, 2009; Austen Angell et al., 2012; Rodrigues et al., 2019), for the materials in which the ionic-conductivity is controlled by the ionic hopping and interactions among ions are negligible, the product of σdcT and νp holds the relation of σdcT×νp−1 = C, where C = constant. This suggests that the logσdcT vs logνp plots for ion-conducting materials reveal the slope of unity (Sidebottom, 2009; Rodrigues et al., 2019). Further, the increase in the concentration of charge carriers increases the values of C and results in the shift of the slope towards the higher values of σdcT (Roling et al., 2001). Therefore, to identify the dominant role among the concentration and mobility of the sodium ions in enhancing the ionic-conductivity with increasing the Na2SO4 concentration in NAP glass, a log-log plot between σdcT and νp for all the glasses is drawn and is shown in Figure 9. Figure 9 clearly shows that all the data points spread along the slope of the unity line. This indicates that the effective concentration of charge carriers is not varying either with increasing temperature or with the concentration of Na2SO4 in NAP glass. Therefore, the variations in the ionic conductivity with varying the concentration of Na2SO4 in NAP glass could be attributed to the mobility of sodium cations.
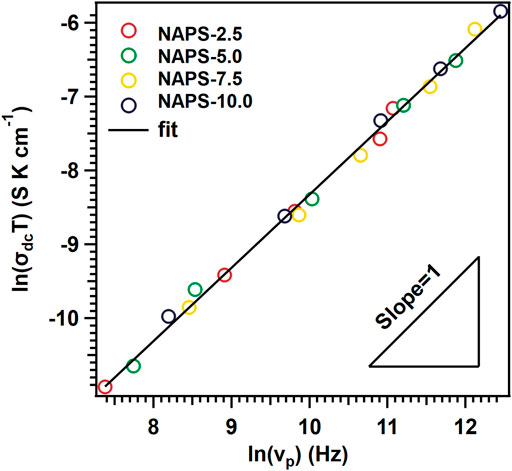
FIGURE 9. ln (σdcT) vs ln (νh) curve for different glass samples.
Structure and Conductivity Correlation Through the Characteristic Displacement Curves
In order to confirm the correlation between the structure and the ionic conductivity for the present glass system, the characteristic mean square displacement values are determined. According to the linear response theory, the mean square displacement, <r2(t)>, and the real part of the ac conductivity are correlated through the following eq (Roling et al., 2001):
where
where kb is the Boltzmann constant, T is the temperature, HR is the Haven ratio, NV is the charge carrier concentration, q is the charge of the mobile ions, and <R2(t)> is the mean square displacement of the centre of change of the mobile ions. Due to not having enough knowledge about the value of HR, Eq. 8 has been used to calculate the <R2(t)> curves for all the glasses. The <R2(t)> curves for NAPS-2.5 at various temperatures are shown in Figure 10A and Figure 10B shows the <R2(t)> curves for all the glasses at 373 K temperature. As like for many other glass systems, Figure 10A shows that the <R2(t)> curves display linear time dependence at a longer time scale, i.e., <R2(t)>∝t, which reflects the diffusive motion of charge cations; in the shorter-time scale, the <R2(t)> curves depicts the <R2(t)>∝t1−n relation, which reflects the sub-diffusive motion of charge carrier. With increasing time, the charge carriers crossover from sub-diffusive motion to diffusive motion at a specific time t, and this time can be defined as the cross-over time tp. Accordingly, the characteristic distance <R2(tp)>corresponding to the cross-over time tp can also be defined. The physical significance of <R2(tp)> is that it represents the minimum distance needed to cover the mobile ions to attain the diffusive motion. The tp values from the <R2(tp)>curves were identified from the intersection of tangents plotted for the shorter time scale regions and the longer-time scale regions. The variation of<R2(tp)> values with the Na2SO4 concentration in NAP glass at 373 K are shown in Figure 10C.
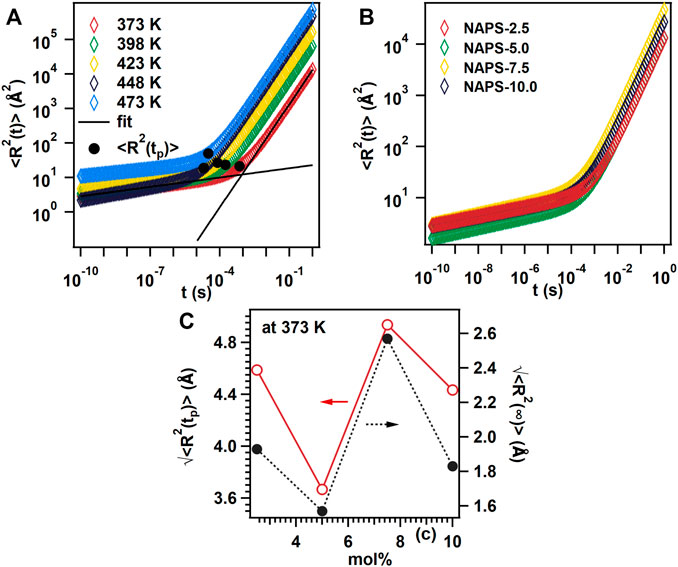
FIGURE 10. (A) Mean square displacement with respect to time plot for NAPS-2.5 glass sample at different temperature. (B) Mean square displacement with respect to time plot for different glass sample at 373 K temperature. (C) Root mean square displacement with respect to time plot for different mol%.
In the spatial extent of sub-diffusive motions <R2(t∞)> has been measured using the equation (Roling et al., 2001)
where Δε = ε′(0)-ε′(∞) is the dielectric strength of the material. Supplementary Figure S3 shows dielectric spectra for different glass composition which has been fitted with the equation (Cole and Cole, 1941) (10) to extract the dielectric strength of the material.
where ε′(0) and ε′(∞) denote the dielectric permittivity at low and high-frequency limits and τcc is the characteristic time. With increasing Na2SO4 concentration both the value of (<R2 (tp)>)1/2 and (<R2 (t∞)>)1/2 follow the same pattern shown in Figure 10C. In the present study at 7.5 mol% Na2SO4 concentration, highest conductivity has been observed and at this concentration, the value of (<R2 (t∞)>)1/2 is higher which indicates that the no of shallower potential walls increased at higher sodium ion concentration.
Though no specific correlation is identified between the σdc conductivity and <R2 (tp)>, the observed high ionic conductivity for NAPS-7.5 glass can be explained considering the highest <R2(tp)> value observed for the same glass. It has been reported for several glass compositions that the increase in the concentration of non-bridging oxygen decreases the <R2 (tp)> as a consequence increases the dc-conductivity (Shaw and Ghosh, 2013; Chatterjee et al., 2020). On the contrary, it has also been identified that the increase in <R2 (tp)> increases the dc-conductivity due to structural modifications in the network structure of glass (Sklepić et al., 2021). The motion of mobile cations in glass materials is considered as hopping from one potential minimum to another potential minimum. When a mobile cation tries to hop to the nearest potential minima, it feels a larger barrier during the forward motion; nevertheless, due to Coulomb interaction, the mobile cation feels a lower energy barrier for backward motion. Therefore, at a shorter time scale, the correlated forward and backward sub-diffusion motion play a significant role. The increase in the concentration of non-bridging oxygen decreases the hopping distance for the mobile cations and thus reduces the <R2 (tp)> to overcome the correlated forward and backward motion. It can be understood that the<R2 (tp)> depends on inter-ionic Coulombic interactions and the network structure of glass. However, in the presence of a single network former, variations in the network structure are minor and thus the inter-ion Coulomb interactions play a major role in controlling the <R2 (tp)>, whereas in mixed network former glasses structural modifications play a major role (Palui and Ghosh, 2019).
As revealed from MAS-NMR spectra (Figure 2), increasing the substitution of Na2SO4 for Al2O3 in NAP glass does significantly increase the concentration of non-bridging oxygen through the formation of Q0(2Al) units over Q0(3Al) units. This suggests that the <R2 (tp)> should decrease with the increase in Na2SO4 concentration in the NAP glass. The Raman spectra (Figure 1) for the present glass system indicate that the sulfur exists in the form of isolated SO42− structural units that are charge compensated by the sodium cations. Further, neither Raman nor the MAS-NMR spectra reveal the presence of S-O-P and S-O-Al bonds. These structural features suggest that the substitution of Na2SO4 for Al2O3 in NAP glass not only increases the concentration of non-bridging oxygens but also modifies the network structure of glass through the formation of isolated SO42− structural units. Though σdc increases with increasing Na2SO4 concentration up to 7.5 mol% in NAP glass, the <R2 (tp)> first decreases with the addition of 5 mol% of Na2SO4 and increases with the addition of 7.5 mol% and then decreases with the addition of 10 mol%. This indicates that both inter-ionic Coulombic interactions and network modifications play a significant role in present glass systems; nevertheless, the dominant role depends on the chemical composition. For NAPS-5.0 glass, the concentration of non-bridging oxygen governed the dc-conductivity. For NAPS-7.5 glass, the structural modifications might have played the dominant role over the inter-ion coulomb interactions. Sklepić et al. (Sklepic et al., 2021) have observed the increase in σdc is parallel to <R2 (tp)> for the Na2O−P2O5−GeO2 glass system. The increase in <R2 (tp)> in the Na2O−P2O5−GeO2 glass system was attributed to the fact that the network modifications around the sodium cations created the shallower potential walls for it. It has been reported that the formation of S-O-Na bonds creates the shallower potential walls for the sodium cations due to the weak bond strength between Na and O in the S-O-Na linkages compared to that of P-O-Na linkages. Owing to this reason, the potential wall for Na+ mobile cations broadens and increases the <R2 (tp)> for the NAPS-7.5 glass and thus enhances the mobility and ionic conductivity. For NAPS-10.0 glass, the <R2 (tp)> decrease could be due to the increase in the concentration of the non-bridging oxygen. It is therefore confirmed from the present study that the variation in the conductivity primarily depends on the chemical composition of glass and thus fine-tuning the glass composition is essential for enhancing the macroscopic properties such as conductivity. Nevertheless, such fine-tuning of chemical composition could only be possible by an in-depth study on the structure and conductivity correlation. This study further highlights that glass materials can be classified both as weak and strong electrolyte material but cannot be generalized.
Conclusion
The present study clearly suggests that Na2SO4 has a significant effect on the ionic conductivity, which increases from 3.75 × 10⁻⁸ S cm−1 to 1.39 × 10⁻⁷ S cm−1 with the 7.5 mol% substitutions for Al2O3 in NAP glass at 100 C. Raman spectra confirm that sulfur ions act as network modifiers and exist as isolated SO42− structural units surrounded by sodium cations. MAS-NMR indicates that the addition of Na2SO4 significantly reduces the connectivity of the aluminophosphate network within the AlPO4 groups through the formation of Q0(2Al) units over Q0(3Al) units and increases the connectivity within the phosphate units through the formation of Q1(0Al) units. The formation of Q0(2Al) units increases the concentration of non-bridging oxygens. Ion dynamics analysis from characteristics mean square displacement curves suggests that the <R2 (tp)> depends on both inter-ionic Coulombic interactions and the network structure of the glass. Correlation of composition and <R2 (tp)> reveals that the increase in the concentration of non-bridging oxygens through the formation of Q0(2Al) units decreases the hopping distance for the mobile cations and thus reduces the <R2 (tp)> to overcome the correlated forward and backward motion. Nevertheless, the formation of SO42− units and Q0(2Al) units, which are connected to sodium, clearly indicate the sodium cations prefer to bond with the PO43− units and SO42− units. Due to the weaker bond strength of Na-O in S-O-Na linkages, the SO42− units create the shallower potential walls for the sodium cations and increases the mobility and thus the <R2 (tp)>, which further enhances the ionic conductivity. Scaling of the AC conductivity spectrum ensures that temperature-dependent mobility plays a significant role in enhancing the ionic conductivity and the concentration of charge carriers is not varying with increasing temperature. LogσdcT vs logνp plots clearly suggests that the effective influence of ion concentration has negligible influence on the ionic conductivity. Therefore, we conclude that temperature-dependent mobility, inter-ion Coulomb interactions, and network modifications play a significant role in enhancing the ionic conductivity in the present glass system.
Data Availability Statement
The original contributions presented in the study are included in the article/Supplementary Material, and further inquiries can be directed to the corresponding author.
Author Contributions
IM: Data curation, Formal analysis, Investigation, Writing—original draft. SC: Data curation, Formal analysis, Investigation. MG: Data curation, Formal analysis, Writing—original draft of NMR data. KD: Data curation, Formal analysis, Writing—original draft of NMR data. KA: Methodology, Resources, Formal analysis, Investigation, Visualization, review and editing. AA: Conceptualization, Methodology, Resources, Formal analysis, Investigation, Writing—original draft, Visualization, Project Administration, Funding Acquisition, Writing—review and editing, Supervision.
Funding
This work was developed under the frame of the project funded by the Science and Engineering Research Board (SERB), DST, Govt. of India, India, through the Early Career Research Award (ECR/2018/000292). IM and AA acknowledge the financial support by DST-SERB (ECR/2018/000292).
Conflict of Interest
The authors declare that the research was conducted in the absence of any commercial or financial relationships that could be construed as a potential conflict of interest.
Publisher’s Note
All claims expressed in this article are solely those of the authors and do not necessarily represent those of their affiliated organizations, or those of the publisher, the editors, and the reviewers. Any product that may be evaluated in this article, or claim that may be made by its manufacturer, is not guaranteed or endorsed by the publisher.
Acknowledgments
The authors thank Dr. Suman Kumari Mishra, Director, CSIR-CGCRI for her continuous support and encouragement. Authors acknowledge the solid-state NMR facility of Sophisticated Instrument Center 318 (SIC) of Dr. Harisingh Gour University, India.
Supplementary Material
The Supplementary Material for this article can be found online at: https://www.frontiersin.org/articles/10.3389/fmats.2021.802379/full#supplementary-material
References
Adhwaryu, V. A., and Kanchan, D. K. (2021). Ag+ Ion Conduction in AgI-Ag2O-B2o3-P2o5 Glass Electrolyte. Mater. Sci. Eng. B 263, 114857. doi:10.1016/j.mseb.2020.114857
Angeli, F., Delaye, J.-M., Charpentier, T., Petit, J.-C., Ghaleb, D., and Faucon, P. (2000). Influence of Glass Chemical Composition on the Na-O Bond Distance: a 23Na 3Q-MAS NMR and Molecular Dynamics Study. J. Non-Cryst. Sol. 276, 132–144. doi:10.1016/S0022-3093(00)00259-3
Armand, M., and Tarascon, J.-M. (2008). Building Better Batteries. Nature 451, 652–657. doi:10.1038/451652a
Austen Angell, C., Ansari, Y., and Zhao, Z. (2012). Ionic Liquids: Past, Present and Future. Faraday Discuss. 154, 9–27. doi:10.1039/C1FD00112D
Bhide, A., and Hariharan, K. (2007). Sodium Ion Transport in NaPO3-Na2SO4 Glasses. Mater. Chem. Phys. 105, 213–221. doi:10.1016/j.matchemphys.2007.04.044
Bingham, P. A., Hand, R. J., Hannant, O. M., Forder, S. D., and Kilcoyne, S. H. (2009). Effects of Modifier Additions on the thermal Properties, Chemical Durability, Oxidation State and Structure of Iron Phosphate Glasses. J. Non-Cryst. Sol. 355, 1526–1538. doi:10.1016/j.jnoncrysol.2009.03.008
Chatterjee, A., Majumdar, S., and Ghosh, A. (2020). Effect of Network Structure on Dynamics of Lithium Ions in Molybdenum Phosphate Mixed Former Glasses. Solid State Ionics 347, 115238. doi:10.1016/j.ssi.2020.115238
Cole, K. S., and Cole, R. H. (1941). Dispersion and Absorption in Dielectrics I. Alternating Current Characteristics. J. Chem. Phys. 9, 341–351. doi:10.1063/1.1750906
Ghosh, A., and Pan, A. (2000). Scaling of the Conductivity Spectra in Ionic Glasses: Dependence on the Structure. Phys. Rev. Lett. 84, 2188–2190. doi:10.1103/PhysRevLett.84.2188
Glatz, P., Comte, M., Montagne, L., Doumert, B., and Cormier, L. (2019). Quantitative Determination of the Phosphorus Environment in Lithium Aluminosilicate Glasses Using Solid-State NMR Techniques. Phys. Chem. Chem. Phys. 21, 18370–18379. doi:10.1039/C9CP03181B
Hayashi, A., Noi, K., Sakuda, A., and Tatsumisago, M. (2012). Superionic Glass-Ceramic Electrolytes for Room-Temperature Rechargeable Sodium Batteries. Nat. Commun. 3, 2–6. doi:10.1038/ncomms1843
Hong, H. Y.-P. (1976). Crystal Structures and crystal Chemistry in the System Na1+xZr2SixP3−xO12. Mater. Res. Bull. 11, 173–182. doi:10.1016/0025-5408(76)90073-8
Ingram, M. D., Moynihan, C. T., and Lesikar, A. V. (1980). Ionic Conductivity and the Weak Electrolyte Theory of Glass. J. Non-Cryst. Sol. 38-39, 371–376. doi:10.1016/0022-3093(80)90447-0
Irvine, J. T. S., Sinclair, D. C., and West, A. R. (1990). Electroceramics: Characterization by Impedance Spectroscopy. Adv. Mater. 2, 132–138. doi:10.1002/adma.19900020304
Jamal, M., Venugopal, G., Shareefuddin, M., and Narasimha Chary, M. (1999). Sodium Ion Conducting Glasses with Mixed Glass Formers NaI-Na2O-V2o5-B2o3: Application to Solid State Battery. Mater. Lett. 39, 28–32. doi:10.1016/S0167-577X(98)00210-9
Jian, Z., Hu, Y. S., Ji, X., and Chen, W. (2017). NASICON‐Structured Materials for Energy Storage. Adv. Mater. 29, 1601925–1602016. doi:10.1002/adma.201601925
Jonscher, A. K. (1977). The 'universal' Dielectric Response. Nature 267, 673–679. doi:10.1038/267673a0
Kahnt, H. (1991). Ionic Transport in Oxide Glasses and Frequency Dependence of Conductivity. Berichte der Bunsengesellschaft für physikalische Chem. 95, 1021–1025. doi:10.1002/bbpc.19910950913
Keshri, S. R., Ganisetti, S., Kumar, R., Gaddam, A., Illath, K., Ajithkumar, T. G., et al. (2021). Ionic Conductivity of Na3Al2P3O12 Glass Electrolytes-Role of Charge Compensators. Inorg. Chem. 60, 12893–12905. doi:10.1021/acs.inorgchem.1c01280
Kim, J.-J., Yoon, K., Park, I., and Kang, K. (2017). Progress in the Development of Sodium-Ion Solid Electrolytes. Small Methods 1, 1700219. doi:10.1002/smtd.201700219
Le, Q. H., Calahoo, C., Xia, Y., Buchheim, J., Bragatto, C. B., and Wondraczek, L. (2020). Optimization of Electrical Conductivity in the Na 2 O‐P 2 O 5 ‐AlF 3 ‐SO 3 Glass System. J. Am. Ceram. Soc. 103, 4939–4956. doi:10.1111/jace.17150
Leo, C. J., Chowdari, B. V. R., Rao, G. V. S., and Souquet, J. L. (2002). Lithium Conducting Glass Ceramic with Nasicon Structure. Mater. Res. Bull. 37, 1419–1430. doi:10.1016/S0025-5408(02)00793-6
Mandal, I., Chakraborty, S., Annapurna, K., Das Sharma, A., Mukhopadhyay, J., and Allu, A. R. (2021). Understanding the Sodium-Ion Dynamics in NASICON (Na3Al2P3O12) Glass Containing NaF: Scaling of Electrical Conductivity Spectra. J. Alloys Compd. 885, 160952. doi:10.1016/j.jallcom.2021.160952
McKeown, D. A., Muller, I. S., Gan, H., Pegg, I. L., and Kendziora, C. A. (2001). Raman Studies of Sulfur in Borosilicate Waste Glasses: Sulfate Environments. J. Non-Cryst. Sol. 288, 191–199. doi:10.1016/S0022-3093(01)00624-X
Miettinen, J. (2006). Thermodynamic-kinetic Model for the Simulation of Solidification in Binary Copper Alloys and Calculation of Thermophysical Properties. Comput. Mater. Sci. 36, 367–380. doi:10.1016/j.commatsci.2005.05.004
Möncke, D., Neto, M. D. C. B., Bradtmüller, H., de Souza, G. B., Rodrigues, A. M., Elkholy, H. S., et al. (2018). NaPO3-AlF3 Glasses: Fluorine Evaporation during Melting and the Resulting Variations in Structure and Properties. J. Chem. Technol. Metall. 53, 1047–1060. Available at https://dl.uctm.edu/journal/node/j2018-6/4_17-206_p_1047-1060.pdf.
Nelson, B. N., and Exarhos, G. J. (1979). Vibrational Spectroscopy of Cation-Site Interactions in Phosphate Glasses. J. Chem. Phys. 71, 2739–2747. doi:10.1063/1.438679
Palui, A., and Ghosh, A. (2019). Structure-transport Correlation of Super-ionic Mixed Network Former Glasses. Solid State Ionics 343, 115126. doi:10.1016/j.ssi.2019.115126
Reddy, A. A., Tulyaganov, D. U., Kharton, V. V., and Ferreira, J. M. F. (2015). Development of Bilayer Glass-Ceramic SOFC Sealants via Optimizing the Chemical Composition of Glasses-A Review. J. Solid State. Electrochem. 19, 2899–2916. doi:10.1007/s10008-015-2925-5
Rodrigues, B. P., Ebendorff-Heidepriem, H., and Wondraczek, L. (2019). Decoupling Mobility and Charge Carrier Concentration in AgR-AgPO3 Glasses (R = Cl, Br, I). Solid State Ionics 334, 99–104. doi:10.1016/j.ssi.2019.02.009
Rokita, M., Handke, M., and Mozgawa, W. (2000). The AIPO4 Polymorphs Structure in the Light of Raman and IR Spectroscopy Studies. J. Mol. Struct. 555, 351–356. doi:10.1016/S0022-2860(00)00620-7
Roling, B., Martiny, C., and Brückner, S. (2001). Ion Transport in Glass: Influence of Glassy Structure on Spatial Extent of Nonrandom Ion Hopping. Phys. Rev. B 63, 1–9. doi:10.1103/PhysRevB.63.214203
Shaw, A., and Ghosh, A. (2013). Correlation of Ion Dynamics with Characteristic Length Scales and Network Structural Units in Bismuth Borate Glasses. J. Chem. Phys. 139, 114503. doi:10.1063/1.4821154
Sidebottom, D. L. (2009). Colloquium: Understanding Ion Motion in Disordered Solids from Impedance Spectroscopy Scaling. Rev. Mod. Phys. 81, 999–1014. doi:10.1103/RevModPhys.81.999
Sidebottom, D. L. (1999). Dimensionality Dependence of the Conductivity Dispersion in Ionic Materials. Phys. Rev. Lett. 83, 983–986. doi:10.1103/PhysRevLett.83.983
Sklepić, K., Tricot, G., Mošner, P., Koudelka, L., and Moguš-Milanković, A. (2021). Sodium Ion Conductivity in Mixed Former Na2O-P2o5-GeO2 and Na2O-B2o3-P2o5-GeO2 Glasses. J. Phys. Chem. C 125, 10593–10604. doi:10.1021/acs.jpcc.1c00072
Sokolov, I. A., Murin, I. V., Kriyt, V. E., and Pronkin, A. A. (2011). Structure and Electrical Conductivity of Glasses in the Na2O-Na2SO4-P2o5 System. Glass Phys. Chem. 37, 351–361. doi:10.1134/S1087659611040158
Sokolov, I. A., Valova, N. A., Tarlakov, Y. P., and Pronkin, A. A. (2003). Electrical Properties and the Structure of Glasses in the Li2SO4-LiPO3System. Glass Phys. Chem. 29, 548–554. doi:10.1023/B:GPAC.0000007930.11101.ee
Summerfield, S. (1985). Universal Low-Frequency Behaviour in the a.C. Hopping Conductivity of Disordered Systems. Philos. Mag. B 52, 9–22. doi:10.1080/13642818508243162
Tsujimura, T., Xue, X., Kanzaki, M., and Walter, M. J. (2004). Sulfur Speciation and Network Structural Changes in Sodium Silicate Glasses: Constraints from NMR and Raman Spectroscopy. Geochim. Cosmochim. Acta 68, 5081–5101. doi:10.1016/j.gca.2004.08.029
Vaishnav, S., Hannon, A. C., Barney, E. R., and Bingham, P. A. (2020). Neutron Diffraction and Raman Studies of the Incorporation of Sulfate in Silicate Glasses. J. Phys. Chem. C 124, 5409–5424. doi:10.1021/acs.jpcc.9b10924
Vignarooban, K., Kushagra, R., Elango, A., Badami, P., Mellander, B.-E., Xu, X., et al. (2016). Current Trends and Future Challenges of Electrolytes for Sodium-Ion Batteries. Int. J. Hydrogen Energ. 41, 2829–2846. doi:10.1016/j.ijhydene.2015.12.090
Wang, Y., Song, S., Xu, C., Hu, N., Molenda, J., and Lu, L. (2019). Development of Solid-State Electrolytes for Sodium-Ion Battery-A Short Review. Nano Mater. Sci. 1, 91–100. doi:10.1016/j.nanoms.2019.02.007
Keywords: NASICON, phosphate glass, Na2SO4, conductivity, scaling, mean square displacement
Citation: Mandal I, Chakraborty S, Ghosh M, Dey KK, Annapurna K and Allu AR (2022) Structure and Conductivity Correlation in NASICON Based Na3Al2P3O12 Glass: Effect of Na2SO4. Front. Mater. 8:802379. doi: 10.3389/fmats.2021.802379
Received: 26 October 2021; Accepted: 09 December 2021;
Published: 27 January 2022.
Edited by:
Sunil Kumar, Indian Institute of Technology Indore, IndiaReviewed by:
Ana C. M. Rodrigues, Federal University of São Carlos, BrazilSiddharth Sundararaman, Lawrence Berkeley National Laboratory, United States
Copyright © 2022 Mandal, Chakraborty, Ghosh, Dey, Annapurna and Allu. This is an open-access article distributed under the terms of the Creative Commons Attribution License (CC BY). The use, distribution or reproduction in other forums is permitted, provided the original author(s) and the copyright owner(s) are credited and that the original publication in this journal is cited, in accordance with accepted academic practice. No use, distribution or reproduction is permitted which does not comply with these terms.
*Correspondence: Amarnath R. Allu, YWxsdWFtYXJuYXRocmVkZHlAZ21haWwuY29t