 Yue Zhang
 Zhihong Zhang
 Lijie Guo
 Xiuli Du1
- 1Key Laboratory of Urban Security and Disaster Engineering, Ministry of Education, Beijing University of Technology, Beijing, China
- 2Beijing General Research Institute of Mining and Metallurgy, Beijing, China
In the two-step open stope subsequent filling mining method, the determination of the strength model for the backfill-rock interface is of great engineering significance to study the stress distribution and stability of the backfill in the stope. Considering the deformation mechanism of the interface and the interaction of the asperities, a strength model for backfill-rock with irregular interface has been proposed based on fractal theory, which can effectively describe the shear mechanical behavior of interfaces with random roughness. The model has been compared with the two-body mechanistic model and good agreements have been achieved. The results show that the shear strength of the interface changes non-linearly with increasing fractal dimension D, when the fractal dimension D is in the range of 1∼1.12. The complete relationship between the interface shear strength and the fractal dimension is given, as the fractal dimension increases from 1 to 2 based on the presented model. At the same time, the quantitative relationship between the interface and backfill friction angles during direct shear testing is analyzed.
Introduction
In recent years, the backfill mining method has been continuously developed (Fall et al., 2005; Ghirian and Fall, 2013; Lingga and Apel, 2018; Jiang et al., 2019) due to its advantages, such as maximizing the rate of ore recovery, improving the safety of the working face, and solving the pollution problem of the tailings pond (Belem and Benzaazoua, 2008; Chen et al., 2018; Tariq and Yanful, 2018). The shear stress between the backfill and surrounding rock reduces part of the self-weight stress, resulting in the arching effect of the backfill (Cui and Fall, 2017; Liu et al., 2017; Fang and Fall, 2019; Fang et al., 2020), as shown in Figure 1. The arching effect leads to the redistribution of the backfill internal stress, which has an effect on the stability of the backfill. Therefore, researching the mechanical properties of the interface between backfill and surrounding rock is of great engineering significance.
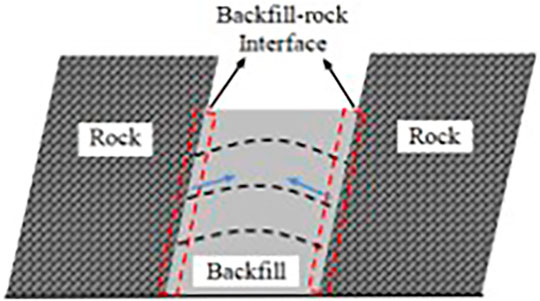
FIGURE 1. Schematic diagram of the arching effect.
Numerical simulation is required to more fully reveal the mechanical behavior of the interaction between the backfill and surrounding rock (Sivakugan et al., 2013; Ting et al., 2014; Li and Aubertin, 2015). However, only a few models take the influence of interface elements into account. Liu et al. (2016) investigated the influence of the mechanical interface characteristics on the stress distribution within backfill by setting up boundary elements. However, the interface had a regular saw tooth shape. The roughness of the interface was characterized by the height and angle of the saw teeth. Due to the heterogeneity of rock and the influence of mining and blasting operations, the exposed surface of surrounding rock is usually rough and irregular. At the same time, laboratory tests are an important research method used to reveal the mechanical properties of an interface. Selcuk and Asma (2019), Li et al. (2014), and Wu et al. (2021) carried out uniaxial compression tests and triaxial compression tests to investigate the influence of the interface inclination on the strength and deformation response. Koupouli et al. (2016), Fall and Nasir (2010), Fang and Fall (2018), and Jiang and Fall (2017) obtained qualitative and quantitative relationships between the strength parameters of the backfill-rock interface and backfill under different curing times, curing temperatures and normal stresses by direct shear testing. The laboratory test method can truly reflect the macroscopic mechanical behavior of an interface but ignores the microscopic deformation mechanism of the interface. Therefore, by considering random roughness, establishing an interface strength model is necessary to provide a theoretical basis for further exploring the microscopic deformation mechanism of the interface and more realistically simulating the mechanical properties of the interface.
To solve the contact problem taking into account the microscopic deformation mechanism and irregular roughness, the statistical model and the fractal theoretical model are mainly used. The statistical model uses the parameters that are influenced by the resolution of the measuring device. Thus, the results of the interface characterization and analysis are not unique (Greenwood and Williamson, 1966; Sayles and Thomas, 1978; Carbone, 2009; Beheshti and Khonsari, 2014). Majumdar and Bhushan (1991) proposed an interface contact model based on fractal theory, namely, the M-B fractal model, to overcome the deficiencies of the statistical method. The fractal dimension is used to characterize the random roughness of the interface, and could describe the mechanical characteristics of the material during deformation (Maruschak et al., 2012). But the elastoplastic deformation is not considered in this model. Then, Morag and Etsion (2007) and Liou et al. (2010) modified the model proposed by Majumdar and Bhushan and came to the important conclusion that the deformation of an asperity is first elastic. However, Liu et al. (2015) showed that the deformation of an asperity is first plastic, which is the same as the conclusion of Majumdar and Bhushan. During elastoplastic deformation, the relationship between the contact area and contact load of an asperity is very complicated (Kogut and Etsion, 2002; Jackson and Green, 2003). Therefore, the modified model is controversial.
In this paper, the M-B fractal model is modified based on the proportion of elastic deformation and plastic deformation to better describe the deformation mechanism. The interaction of asperities is described by force analysis. Combined with the Mohr-Coulomb criterion, a strength model of the backfill-rock interface with random roughness is proposed on this basis to further reveal the mechanical behavior of the backfill-rock interface. The relationship between the fractal dimension and the shear strength is also investigated. Finally, the quantitative relationship between the interface and backfill friction angles is presented.
Modeling
Establishment of a Single Asperity Strength Model Based on Fractal Theory
Fractal Model of a Single Asperity
The contact between two rough surfaces can be approximately equivalent to the contact between a rough surface and a rigid smooth flat plane (Majumder and Tien, 1990). From the W-M fractal function, it follows that the profile curve of a single asperity on the backfill surface before deformation can be expressed as (Berry and Lewis, 1980; Mandelbrot, 1985)
where D is the fractal dimension of the rough surface, and 1 < D < 2; G is the characteristic length scale of the rough surface; l is the base length of an asperity; x is the horizontal distance from any point on the base to the tip of an asperity; and z(x) is the profile curve of a single asperity before deformation.
Figure 2 presents the deformation schematic diagram of a single asperity. The parameters δ, r, and a are the deformation at the tip of an asperity, the microcontact radius, and the microcontact area in Figure 2, respectively. Meanwhile, according to the M-B fractal model, the relationship between a and l can be simplified as l = a1/2. Then, the deformation and the curvature radius of an asperity are given as follows:
where R is the radius of curvature at the tip of an asperity.
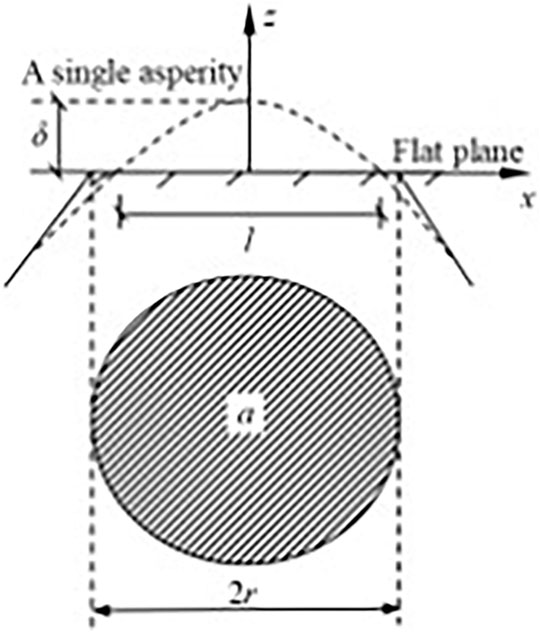
FIGURE 2. Deformation schematic diagram of a single asperity.
The microcontact area and micro- contact load of an asperity depend on its deformation regime: Elastic, elastoplastic, or plastic.
1) Elastic Deformation
Considering Hertz contact theory (Johnson, 1985), the elastic microcontact area, the elastic microcontact area-load relation, and the maximum microcontact pressure of an asperity are
where E* is the composite elastic modulus of the interface, and
The maximum microcontact pressure is 3/2 times the average microcontact pressure that arises during elastic deformation (Johnson, 1985), namely,
where Pe is the average elastic microcontact pressure on an asperity.
Without taking friction into account, the critical average pressure of an asperity at the first yield is
where Pec is the critical average pressure of an asperity, demarcating the elastic and elastoplastic microcontacts, and σy is the yield strength of the softer material.
Therefore, the critical microcontact deformation is
where δec is the critical microcontact deformation of an asperity, demarcating the elastic and elastoplastic deformations.
Then,
When δ = δec, the critical microcontact area of an asperity at the first yield is obtained as follows:
where aec is the critical microcontact area of an asperity, demarcating the elastic and elastoplastic microcontact areas.
2) Completely Plastic Deformation.
When an asperity undergoes completely plastic deformation, the microcontact area is equal to the truncated microcontact area (Johnson, 1985), that is,
At this time,
Thereby,
where apc is the critical microcontact area of an asperity, which delimits the elastoplastic and plastic microcontact area, and δpc is the critical microcontact deformation of an asperity, which delimits the elastoplastic and plastic microcontact deformation.
When the average microcontact pressure is equal to 3σy, the asperity is in the completely plastic deformation (Johnson, 1985), namely,
where Ppc is the critical microcontact pressure of an asperity, demarcating the elastoplastic and plastic microcontacts, and Pp is the average microcontact pressure of an asperity.
In summary, the critical microcontact areas (aec and apc) and the critical microcontact deformations (δec and δpc) are independent of the radius of curvature at the tip of an asperity. These parameters relate to only the physical parameters of the materials and the fractal parameters of the surface. In other words, the critical microcontact area and critical microcontact deformation are unique for a rough surface. Then, the critical microcontact deformations are used to determine the microcontact area and microcontact load of an asperity during elastoplastic deformation.
3) Elastoplastic Deformation
When
where Pep is the average elastoplastic microcontact pressure on an asperity.
The microcontact area and microcontact load of an asperity are
where aep is the elastoplastic microcontact area of an asperity, and Fep is the elastoplastic microcontact load of an asperity.
In summary, the different deformation regimes of an asperity can be determined by the critical deformation. When δ>δpc, an asperity is undergoing completely plastic deformation. When
Strength Model of a Single Asperity
The M-B fractal model clearly shows that the vertical deformation of an asperity gradually evolves from plastic to elastic deformation. The asperity volume is assumed to remain constant during loading (Hill, 1950), considering the energy conservation theorem. The asperity shape evolves from “tall and thin” to “short and fat”, as shown in Figure 3. The force p is the vertical external load, and the force T is the horizontal internal force. Thus, the horizontal deformation of an asperity gradually evolves from elastic to plastic.
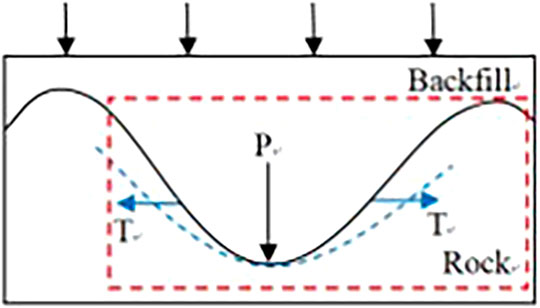
FIGURE 3. Force schematic diagram of interface under a vertical loading.
The dashed box in Figure 3 is enlarged to analyze the interaction between two asperities during microcontact. The microcontact stress schematic diagram of the two asperities is drawn in Figure 4.
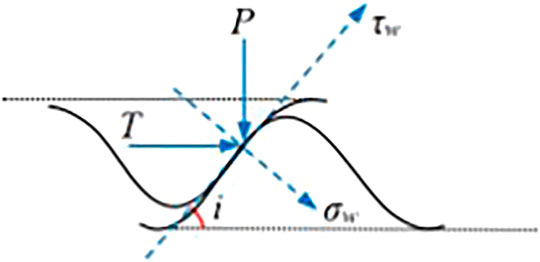
FIGURE 4. Microcontact stress schematic diagram of two asperities.
Combined with the Mohr-Coulomb criterion, the shear strengths of the microcontact interface, backfill and rock can be expressed as follows:
where τw and σw are the shear stress and the normal stress of the microcontact interface, respectively; τ1 and σ1 are the shear stress and the normal stress on the shear failure surface of the backfill, respectively; and τ2 and σ2 are the shear stress and the normal stress on the shear failure surface of the rock, respectively. Adhesion is defined as the ability of one material to adhere to the surface of another material (Luo et al., 2017). Cohesion is defined as the ability of adjacent parts of the same material to attract each other. Thus, cw is defined as the adhesion of the microcontact interface; c1 and c2 are the cohesion of the backfill and rock, respectively; φw is the friction angle of the microcontact interface; φ1 and φ2 are the friction angles of backfill and rock, respectively; and i is the inclined angle of the asperities on the rock surface to impede the movement of the asperities on the backfill surface.
A unit on the microcontact interface in Figure 4 is taken for force analysis, as shown in Figure 5. According to Figure 5, the static equilibrium equations of the unit are established for different deformation regimes. The relationships of the strength parameters between the microcontact interface and backfill in different deformation regimes are solved.
1) Elastic Deformation
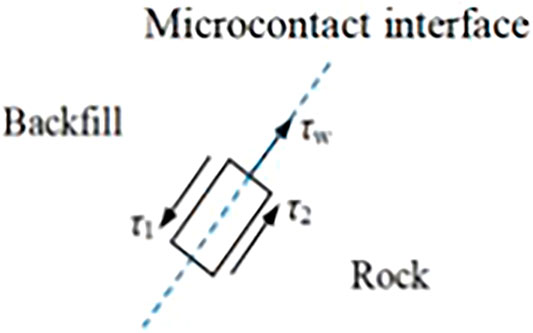
FIGURE 5. Force schematic diagram of the unit.
When the asperity on the backfill surface is undergoing elastic deformation, the normal stress on the microcontact interface is σw = σ1 = σ2 = Pe. The shear strength of the interface is mainly determined by the backfill, namely,
2) Elastoplastic Deformation
When the asperity on the backfill surface is undergoing elastoplastic deformation, the normal stress on the microcontact interface is σw = σ1 = σ2 = Pep. The shear strength is mainly determined by the backfill and rock, namely,
where
3) Completely Plastic Deformation
When the asperity on the backfill surface is undergoing completely plastic deformation, the normal stress on the microcontact interface is σw = σ1 = σ2 = Pp. The shear strength is mainly determined by the backfill and rock, namely,
Establishment of the Interface Strength Model Based on Fractal Theory
Fractal Model of the Irregular Interface
In different deformation regimes, the contact area and contact load are related to the deformation of the largest microcontact when the two rough surfaces are in contact.
1) Completely Plastic Deformation
If
where aL is the largest microcontact area of the interface and n(a) is the size distribution of the microcontact areas under completely plastic and elastoplastic deformation.
Then, the plastic contact area and contact load can be given by
where Arp and Fcp are the contact area and contact load of the interface, respectively, during completely plastic deformation only.
2) Elastoplastic Deformation
The interface contact area and contact load during elastoplastic deformation are solved by the critical microcontact area and critical microcontact deformation of the different deformation regimes. If
where Arep and Fcep are the contact area and contact load of the interface, respectively, during elastoplastic deformation only.
3) Elastic Deformation
If
where n(a) is the size distribution of the microcontact areas during elastic deformation.
Then, the plastic contact area and contact load are expressed as follows:
If 1 < D < 2 and
Similarly, if D = 1.5,
where Are and Fce are the contact area and contact load of the interface, respectively, during elastic deformation only.
Strength Model of the Irregular Interface
A contact strength model of the interface is established by analyzing the strength model parameters of a single asperity.
1) Elastic Deformation.
The shear strength of the interface can be expressed as follows:
where
2) Elastoplastic Deformation
The shear strength of the interface can be given by
where τwe is the shear strength of the interface during elastoplastic deformation only.
3) Completely Plastic Deformation
The shear strength of the interface is
where τwp is the shear strength of the interface during completely plastic deformation only.
Therefore, the total shear strength of the interface is
where τw is the total shear strength of the interface.
Eq. 35 indicates that the shear strength of the interface is determined by the adhesion and friction. To ensure the stability of the backfill-rock interface, the maximum adhesion (namely, c1) during deformation is taken as the total adhesion of the interface in Eq. 35. The total friction of the interface is the sum of all the frictions corresponding to different deformation regimes.
Meanwhile, the relationship among the parameters can be obtained as:
Verification
Liu et al. (2005) investigated the effect of the interface roughness on the shear strength by the two-body mechanistic model. Based on this work, the presented model is verified in this section. The yield strength of the concrete is chosen to 3 MPa. The characteristic length scale of the rough surface is chosen to 10−11 m. The material parameters are shown in Table 1.
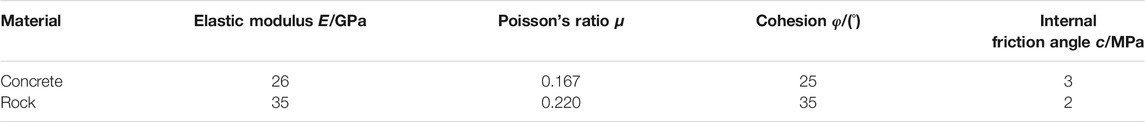
TABLE 1. Material parameters.
Figure 6 shows the verification diagram of the relationship between the shear strength and the fractal dimension. The shear strengths of the presented model and the two-body mechanistic model are normalized to further comparatively analyze the evolution laws between the shear strength and the fractal dimension of the newly presented model and the two-body mechanistic model. The trends of the two models have good agreements, namely, the shear strength changes non-linearly with increasing fractal dimension. The shear strength increases with increasing fractal dimension when D < 1.095, peaks at D = 1.095 and decreases when D > 1.095, which is the same as the evolution laws presented by Liu. Analysis suggests that it is related to the main dislocation form of the asperities on the interface. It should be noted that increasing the fractal dimension corresponds to increasing the distribution density of the asperities on the interface, namely, increasing the frequency of the asperities for the same amplitude. The forms of dislocation between two asperities are sliding, interlocking, and shearing. Some small asperities merge with each other to form large asperities with shear when D < 1.095. The dislocation form of asperities gradually evolves from slipping to interlocking with increasing fractal dimension. The dislocation form of the asperities on the interface is dominated by interlocking. The more asperities tend to be interlocked. As a result, the shear strength of the interface increases. When D > 1.095, the increase of interface roughness means the decrease of asperity base area and the asperity is easier to cut off. The dislocation form of asperity gradually evolves from interlocking to cutting off. The dislocation form of the asperities on the interface is dominated by cutting off with increasing fractal dimension. The number of interlocking asperities decreases. Therefore, the shear strength of the interface decreases. When D = 1.095, there are most interlocking asperities on the interface and the interlocking effect reaches the maximum. Thereby, the shear strength of interface peaks at this fractal dimension. Noted that it is the critical point of transformation of the main dislocation form from interlocking to cutting off. The cutting off of the asperities is related to the parameters of the weak material.
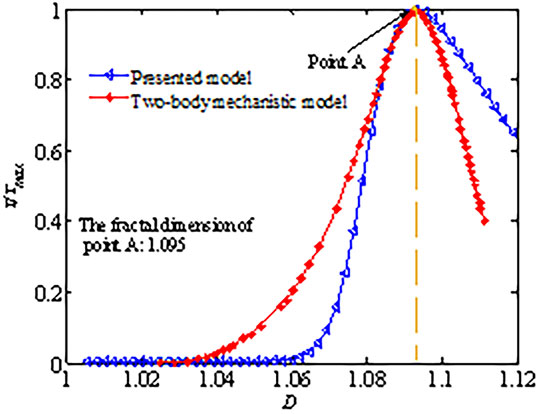
FIGURE 6. Verification diagram of the relationship between the shear strength and the fractal dimension.
There is slightly difference between the presented model and the two-body mechanistic model. Analysis shows that the interface roughness is described by only the fractal dimension D in the two-body mechanical model, ignoring the amplitude of the asperities on the interface, namely, the parameter G. The fractal dimension D is known to determine only the frequency of occurrence for the large and small asperities on the interface. The developed model considers the influence of the asperity amplitude on the shear strength of the interface. It should be emphasized that, the number, D = 1.095 in Figure 6, is to show that the results of the presented model are consistent with the two-body mechanistic model, demonstrating the feasibility of the presented model.
However, the two-body mechanistic model obtained the shear strength evolution laws when the fractal dimension is in the range of 1∼1.12 only. Figure 7 shows the complete relationship between the interface shear strength and the fractal dimension as the fractal dimension increases from 1 to 2 based on the presented model. When D > 1.366, the change in the fractal dimension has little effect on the shear strength, namely, the shear strength basically remains constant when D > 1.366, indicated by point B in Figure 7.
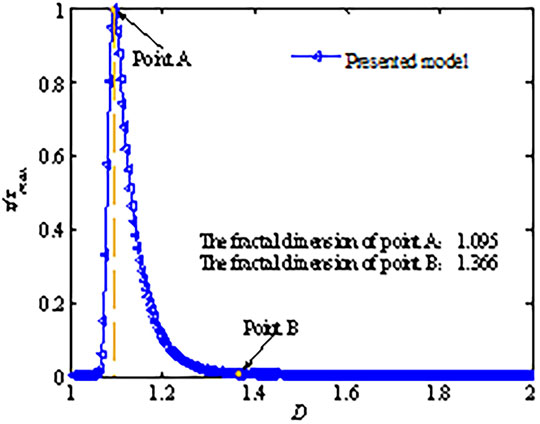
FIGURE 7. Relationship between the shear strength and the fractal dimension D.
Discussion
The direct shear test results with the backfill-rock combination indicate that the interface friction angle can be larger or smaller than that of the backfill. However, the interface adhesion is always less than that of the backfill (Fall and Nasir, 2010; Koupouli et al., 2016; Fang and Fall, 2018).
Analysis suggests that the reasons for the contradictory friction angle results of the direct shear tests are mainly related to the difference in the strength of the contact materials and the inclined angle of the asperities on the rock surface. The interface friction angle is larger than that of backfill, if
Meanwhile, it is known that the ability of one material to adhere to the surface of another material remains constant. However, the areas providing the adhesion are not the same in different deformation regimes. The interface adhesion can be explained by the schematic diagram of the asperity failure mechanism, as shown in Figure 8. At the beginning, the two asperities come into locking. Adhesion is provided by the asperity surfaces when the asperities undergo elastic deformation. Then, the two asperities undergo dilatation with loading, separating on the backside of the interface relative to the direction of motion, as shown by the red line in Figure 7. Thus, the area providing adhesion decreases. Finally, the asperity in the backfill is cut off, and the area providing adhesion disappears completely. In summary, the interface adhesion is smaller than that of backfill, which is consistent with the experimental trend.
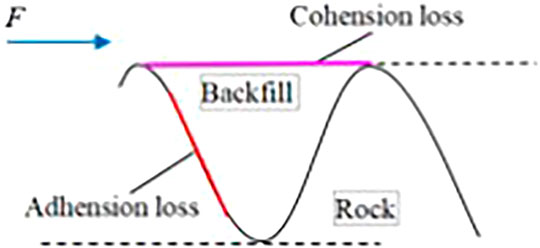
FIGURE 8. Schematic diagram of the asperity failure mechanism.
Conclusion
The original M-B fractal model is modified. A model of backfill-rock interface strength is proposed based on the modified M-B fractal model and the Mohr-Coulomb criterion. After verification, the following conclusions are obtained:
1) Based on fractal theory, a strength model that can reasonably describe the shear mechanical behavior of interfaces with random roughness is developed when materials with different strength come into contact. The deformation mechanism of the interface and the interaction of the asperities can be considered in this model.
2) The relationship between the strength parameters of the interface and that of the backfill is obtained. When the tangent of the rock friction angle is larger than twice that of the backfill, the interface friction angle is larger than that of the backfill. Otherwise, the interface friction angle is smaller than that of the backfill.
3) The shear strength of the interface changes nonlinearly with increasing fractal dimension. The shear strength increases with increasing fractal dimension when D < 1.095. The shear strength peaks when D = 1.095. The shear strength decreases with increasing fractal dimension when D > 1.095. Meanwhile, the shear strength basically remains constant when D > 1.366.
In this model, the interface shear strength is related to the interface fractal dimension and the strength parameters of the two contacting materials. In practical application, the interface roughness and the strength of the surrounding rock can be measured. The backfill strength corresponding to the maximum shear strength of the interface is obtained by this model, ensuring the stability of the underground backfill system. However, it should be noted that, the model still has some limitations that need to be solved in the future. The three-dimensional strength model of the interface is beyond the scope of this research and will continue to explore in the future. The proposed model should satisfy the assumption of the M-B fractal model, that the contact between two rough surfaces is approximately equivalent to the contact between a rough surface and a rigid flat plane. Therefore, the model is more suitable for solving the contact problem between materials with large differences in strength. Moreover, when the fractal model of the interface is established, the contact area and contact load during elastoplastic deformation are derived from the proportion of elastic and plastic deformation. The size distribution of the microcontact areas during elastoplastic deformation is assumed to be the same as that during plastic deformation. Therefore, further research on elastoplastic deformation is needed.
Data Availability Statement
The original contributions presented in the study are included in the article/Supplementary Material, further inquiries can be directed to the corresponding author.
Author Contributions
YZ developed the model and wrote the first draft of the manuscript. ZZ, LG, and XD provided constructive discussions and contributed to manuscript revision. YZ, ZZ, and LG contributed significantly to the design of the study. All authors agree to be accountable for the content of this work.
Funding
This research was supported by the Key Program of National Natural Science Foundation of China (No.52130905).
Conflict of Interest
The authors declare that the research was conducted in the absence of any commercial or financial relationships that could be construed as a potential conflict of interest.
Publisher’s Note
All claims expressed in this article are solely those of the authors and do not necessarily represent those of their affiliated organizations, or those of the publisher, the editors and the reviewers. Any product that may be evaluated in this article, or claim that may be made by its manufacturer, is not guaranteed or endorsed by the publisher.
Acknowledgments
The reviewers are gratefully acknowledged for their constructive comments.
References
Beheshti, A., and Khonsari, M. M. (2014). On the Contact of Curved Rough Surfaces: Contact Behavior and Predictive Formulas. J. Appl. Mech. 81 (11), 111004. doi:10.1115/1.4028426
Belem, T., and Benzaazoua, M. (2008). Design and Application of Underground Mine Paste Backfill Technology. Geotech. Geol. Eng. 26, 147–174. doi:10.1007/s10706-007-9154-3
Berry, M. V., and Lewis, Z. V. (1980). On the Weierstrass-Mandelbrot Fractal Function. Proc. R. Soc. Lond. A. 370, 459–484. doi:10.1098/rspa.1980.0044
Carbone, G. (2009). A Slightly Corrected Greenwood and Williamson Model Predicts Asymptotic Linearity between Contact Area and Load. J. Mech. Phys. Sol. 57 (7), 1093–1102. doi:10.1016/j.jmps.2009.03.004
Chen, X., Shi, X., Zhou, J., Chen, Q., Li, E., and Du, X. (2018). Compressive Behavior and Microstructural Properties of Tailings Polypropylene Fibre-Reinforced Cemented Paste Backfill. Construction Building Mater. 190, 211–221. doi:10.1016/j.conbuildmat.2018.09.092
Cui, L., and Fall, M. (2017). Multiphysics Modeling of Arching Effects in Fill Mass. Comput. Geotechnics 83, 114–131. doi:10.1016/j.compgeo.2016.10.021
Fall, M., Benzaazoua, M., and Ouellet, S. (2005). Experimental Characterization of the Influence of Tailings Fineness and Density on the Quality of Cemented Paste Backfill. Minerals Eng. 18 (1), 41–44. doi:10.1016/j.mineng.2004.05.012
Fall, M., and Nasir, O. (2010). Mechanical Behaviour of the Interface between Cemented Tailings Backfill and Retaining Structures under Shear Loads. Geotech. Geol. Eng. 28 (6), 779–790. doi:10.1007/s10706-010-9338-0
Fang, K., Cui, L., and Fall, M. (2020). A Coupled Chemo-Elastic Cohesive Zone Model for Backfill-Rock Interface. Comput. Geotechnics 125, 103666. doi:10.1016/j.compgeo.2020.103666
Fang, K., and Fall, M. (2019). Chemically Induced Changes in the Shear Behaviour of Interface between Rock and Tailings Backfill Undergoing Cementation. Rock Mech. Rock Eng. 52, 3047–3062. doi:10.1007/s00603-019-01757-0
Fang, K., and Fall, M. (2018). Effects of Curing Temperature on Shear Behaviour of Cemented Paste Backfill-Rock Interface. Int. J. Rock Mech. Mining Sci. 112, 184–192. doi:10.1016/j.ijrmms.2018.10.024
Ghirian, A., and Fall, M. (2013). Coupled Thermo-Hydro-Mechanical-Chemical Behaviour of Cemented Paste Backfill in Column Experiments. Part I: Physical, Hydraulic and thermal Processes and Characteristics. Eng. Geology. 164, 195–207. doi:10.1016/j.enggeo.2013.01.015
Greenwood, J. A., and Williamson, J. B. P. (1966). Contact of Nominally Flat Surfaces. Proc. R. Soc. Lond. A. 295 (1442), 300–319. doi:10.1098/rspa.1966.0242
Jackson, R. L., and Green, I. (2003). A Finite Element Study of Elasto-Plastic Hemis- Pherical Contact against a Rigid Flat. J. Tribol.-T. ASME 127 (2), 343–354. doi:10.1115/2003-TRIB-0268
Jiang, H.-q., Fall, M., Li, Y.-H., and Han, J. (2019). An Experimental Study on Com- Pressive Behavior of Cemented Rockfill. Constr. Build. Mater. 147, 837–846. doi:10.1016/j.conbuildmat.2019.04.061
Jiang, H., and Fall, M. (2017). Yield Stress and Strength of saline Cemented Tailings Materials in Sub-zero Environments: Slag-Paste Backfill. J. Sust. Cement-Based Mater. 6 (5), 314–331. doi:10.1080/21650373.2017.1280428
Kogut, L., and Etsion, I. (2002). Elastic-Plastic Contact Analysis of a Sphere and a Rigid Flat. J. Appl. Mech.-T ASME 69 (5), 657–662. doi:10.1115/1.1490373
Koupouli, N. J. F., Belem, T., Rivard, P., and Effenguet, H. (2016). Direct Shear Tests on Cemented Paste Backfill-Rock Wall and Cemented Paste Backfill-Backfill Interfaces. J. Rock Mech. Geotechnical Eng. 8, 472–479. doi:10.1016/j.jrmge.2016.02.001
Li, L., and Aubertin, M. (2015). Numerical Analysis of the Stress Distribution in Symmetrical Backfilled Trenches with Inclined Walls. Indian Geotech. J. 45 (3), 278–290. doi:10.1007/s40098-014-0131-5
Li, Y., Liu, W., Yang, C., and Daemen, J. J. K. (2014). Experimental Investigation of Mechanical Behavior of Bedded Rock Salt Containing Inclined Interlayer. Int. J. Rock Mech. Mining Sci. 69, 39–49. doi:10.1016/j.ijrmms.2014.03.006
Lingga, B. A., and Apel, D. B. (2018). Shear Properties of Cemented Rockfills. J. Rock Mech. Geotechnical Eng. 10 (4), 635–644. doi:10.1016/j.jrmge.2018.03.005
Liou, J. L., Tsai, C. M., and Lin, J.-f. (2010). A Microcontact Model Developed for Sphere- and cylinder-based Fractal Bodies in Contact with a Rigid Flat Surface. Wear 268, 431–442. doi:10.1016/j.wear.2009.08.033
Liu, G., Li, L., Yang, X., and Guo, L. (2016). A Numerical Analysis of the Stress Distribution in Backfilled Stopes Considering Nonplanar Interfaces between the Backfill and Rock Walls. Int. J. Geotechnical Eng. 10 (3), 271–282. doi:10.1080/19386362.2015.1132123
Liu, G., Li, L., Yang, X., and Guo, L. (2017). Numerical Analysis of Stress Distribution in Backfilled Stopes Considering Interfaces between the Backfill and Rock Walls. Int. J. Geomech. 17 (2), 06016014. doi:10.1061/(ASCE)GM.1943-5622.0000702
Liu, P., Zhao, H., Huang, K., and Chen, Q. (2015). Research on Normal Contact Stiffness of Rough Surface Considering Friction Based on Fractal Theory. Appl. Surf. Sci. 349, 43–48. doi:10.1016/j.apsusc.2015.04.174
Liu, X.-r., Zhou, H.-w., and Li, H. (2005). Numerical Simulation of Interface Behavior in Rock-Concrete Interaction Problem. Chin. J. Rock Mech. Eng. 24 (S2), 5648–5651. CNKI:SUN:YSLX.0.2005-S2-065.
Luo, L., Li, X., Tao, M., and Dong, L. (2017). Mechanical Behavior of Rock-Shotcrete Interface under Static and Dynamic Tensile Loads. Tunnelling Underground Space Tech. 65, 215–224. doi:10.1016/j.tust.2017.03.005
Majumdar, A., and Bhushan, B. (1991). Fractal Model of Elastic-Plastic Contact between Rough Surfaces. J. Tribol. 113 (1), 1–11. doi:10.1115/1.2920588
Majumder, A., and Tien, C. L. (1990). Fractal Characterization and Simulation of Rough Surfaces. Wear 136 (2), 313–327. doi:10.1016/0043-1648(90)90154-3
Mandelbrot, B. B. (1985). Self-Affine Fractals and Fractal Dimension. Phys. Scr. 32, 257–260. doi:10.1088/0031-8949/32/4/001
Maruschak, P. O., Konovalenko, I. V., and Bishchak, R. T. (2012). Effect of Thermal Fatigue Cracks on Brittle-Ductile Deformation and Failure of Cbcm Roller Surface Layers. Metallurgist 56 (1-2), 30–36. doi:10.1007/s11015-012-9532-9
Morag, Y., and Etsion, I. (2007). Resolving the Contradiction of Asperities Plastic to Elastic Mode Transition in Current Contact Models of Fractal Rough Surfaces. Wear 262 (5), 624–629. doi:10.1016/j.wear.2006.07.007
Sayles, R. S., and Thomas, T. R. (1978). Surface Topography as a Nonstationary Random Process. Nature 271 (2), 431–434. doi:10.1038/271431a0
Selçuk, L., and Aşma, D. (2019). Experimental Investigation of the Rock-Concrete Bi Materials Influence of Inclined Interface on Strength and Failure Behavior. Int. J. Rock Mech. Mining Sci. 123, 1–11. doi:10.1016/j.ijrmms.2019.104119
Sivakugan, N., Widisinghe, S., and Wang, V. Z. (2013). Vertical Stress Determination within Backfilled Mine Stopes. Int. J. Geomech. 14 (5), 1–5. doi:10.1061/(ASCE)GM.1943-5622
Tariq, A., and Yanful, E. K. (2018). A Review of Binders Used in Cemented Paste Tailings for Underground and Surface Disposal Practices. J. Environ. Manage. 131, 138–149. doi:10.1016/j.jenvman.2013.09.039
Ting, C. H., Sivakugan, N., Read, W., and Shukla, S. K. (2014). Analytical Expression for Vertical Stress within an Inclined Mine Stope with Non-parallel Walls. Geotech. Geol. Eng. 32 (2), 577–586. doi:10.1007/s10706-014-9735-x
Weilv, W., Xu, W., and Jianpin, Z. (2021). Effect of Inclined Interface Angle on Shear Strength and Deformation Response of Cemented Paste Backfill-Rock under Triaxial Compression. Construction Building Mater. 279, 122478. doi:10.1016/j.conbuildmat.2021.122478
Keywords: backfill, irregular interface, strength model, fractal theory, roughness
Citation: Zhang Y, Zhang Z, Guo L and Du X (2021) Strength Model of Backfill-Rock Irregular Interface Based on Fractal Theory. Front. Mater. 8:792014. doi: 10.3389/fmats.2021.792014
Received: 09 October 2021; Accepted: 10 November 2021;
Published: 10 December 2021.
Edited by:
John L. Provis, The University of Sheffield, United KingdomReviewed by:
Pavlo Maruschak, Ternopil Ivan Pului National Technical University, UkraineHitoshi Washizu, University of Hyogo, Japan
Copyright © 2021 Zhang, Zhang, Guo and Du. This is an open-access article distributed under the terms of the Creative Commons Attribution License (CC BY). The use, distribution or reproduction in other forums is permitted, provided the original author(s) and the copyright owner(s) are credited and that the original publication in this journal is cited, in accordance with accepted academic practice. No use, distribution or reproduction is permitted which does not comply with these terms.
*Correspondence: Lijie Guo, bGpndW8yNjRAMTI2LmNvbQ==