 Quantong Jiang
 Dongzhu Lu
 Chang Liu1,2,3
 Nazhen Liu
94% of researchers rate our articles as excellent or good
Learn more about the work of our research integrity team to safeguard the quality of each article we publish.
Find out more
ORIGINAL RESEARCH article
Front. Mater. , 16 November 2021
Sec. Structural Materials
Volume 8 - 2021 | https://doi.org/10.3389/fmats.2021.761052
This article is part of the Research Topic Corrosion and Protection of Magnesium Alloys View all 11 articles
The Pilling-Bedworth ratio of oxides preferentially formed from the precipitated phases in magnesium alloys were calculated. The results showed that the PBR value of Nd2O3 preferentially formed from Mg12Nd was 1.0584, and the PBR value of Y2O3 preferentially formed from Mg24Y5 was 1.1923. Both the Nd2O3 and Y2O3 would provide a good protection to the Mg matrix. The Gd2O3 preferentially formed from Mg3Gd, whereas the MgO preferentially formed from MgNi2. The PBR value of these two oxides were both larger than 2. The corresponding oxides formed from the common precipitated phases Mg17Al12, MgZn2, MgCu2, Mg2Ca, Mg12Ce, and MgAg were all less than 1. The oxide films formed on surfaces of pure Mg and Mg-xY (x = 3, 5, 7 wt.%) alloys at high temperatures were analyzed. The results showed that the oxide films were composed of a Y2O3/MgO outer layer and an inner layer rich with Y2O3. The formation of Y2O3 was mainly caused by the oxidation of Mg24Y5. The more Y2O3 existed in the composite oxidation film, the better corrosion resistance of the Mg-Y samples.
The PBR (Pilling-Bedworth Ratio) value of oxide film is an important parameter to evaluate the film protection performance to the base metal (Xu and Gao, 2000). When the PBR value is less than 1, the protection performance of the oxide film is poor, due to the existing tensile stress and the resultant incomplete coverage of the oxide film to the metal. Similarly, when the PBR value is larger than 3, the oxide film also shows a weak protection, due to the compressive stress in the film. When the PBR value is between 1 and 2, the oxide film is protective (Bradford 1993; Tan et al., 2016; Song et al., 2021).
Magnesium is active, so the α-Mg matrix and precipitated phases in magnesium alloys are prone to be oxidized in the atmospheric environment (Czerwinski 2002; Liu et al., 2009; Medved et al., 2009), leading to the formation of different kinds of oxidation films on the magnesium alloy surface (Czerwinski, 2012; Czerwinski, 2015). The PBR value of oxidation film formed on pure magnesium is about 0.8, which is not protective (You et al., 2000; Mebarki et al., 2005; Cheng et al., 2009; López et al., 2010).
There are many precipitated phases existing in magnesium alloys, including Mg17Al12, MgZn2, Mg2Ca, Mg5Gd, Mg12Nd and Mg24Y5, etc., (Nie 2012; Zhu and Chen, 2019; Kaya, 2020; Shi et al., 2020). The crystallography of the precipitated phases determines the microstructure and property of magnesium alloys. According to the literatures, the film formed by oxidation of precipitated phases during the heat treatment process, has good corrosion resistance (Sudholz et al., 2011; Chang et al., 2015; Yu et al., 2015). Due to the different activity of alloying elements, the property of oxide film formed from the precipitated phases in the atmospheric environment is different (Van Orman and Crispin, 2010). PBR is the ratio of oxide volume consisting metal and oxygen on the metal surface, to the volume of base metal atoms, which reflects the stress condition in the oxide film. The corrosion tendency of magnesium alloy is closely related to the conditions of the oxide layer (Wang et al., 2007; Fan et al., 2011).
In this work, the PBR values of oxides formed from the precipitated phases in magnesium alloys were calculated. In order to verify the PBR calculation results of oxides formed from the precipitated phases in magnesium alloys, the morphologies of oxidation films formed on the surfaces of pure Mg and Mg-xY alloys (x = 3, 5, 7 wt.%) at high temperature were characterized. The effect of the oxidation films on corrosion resistance were also studied. This work is expected to give a scientific and reasonable method to improve intrinsic corrosion resistance of magnesium alloys by regulating the types of precipitates.
The relative atomic mass values of the alloying elements, including Al,Zn, Cu, Ca, Gd, Nd, Ce, Ag, Ni, Y and C12 were obtained from the periodic table of elements. The absolute atomic mass values of the alloying elements were calculated via the following formula:
The results were shown in Table 1.
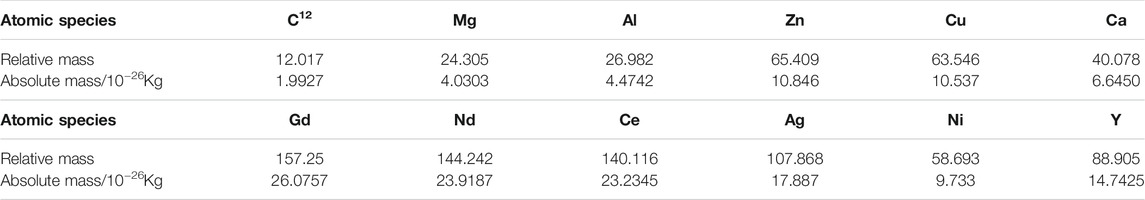
TABLE 1. Absolute atomic mass of different alloying elements.
The crystal structure and parameters of the common precipitated phases in the magnesium alloys, including Mg17Al12, MgZn2, MgCu2, Mg2Ca, Mg3 Gd, Mg12Nd, Mg12Ce, MgAg, MgNi2 and Mg24Y5 were obtained by the phase diagram.
The atom number in a single unit cell of the precipitated phases MgAXB was calculated via the crystal structure. For example, the crystal structure of Mg24Y5 is body-centered cubic (BCC), so there are two Mg24Y5 intermetallics in each unit cell. The total atom number in a single Mg24Y5 unit cell is 2 × (24Mg+5Y) = 48Mg + 10Y. The absolute mass of a single Mg24Y5 unit cell (the sum of 48Mg atoms and 10 Y atoms) was obtained as following: 48 × 4.0303×10−23 g + 10 × 14.7425 × 10−23 g = 340.8794 × 10⁻²³ g. The absolute mass of other single precipitated phases MgAXB was calculated via the same method with results shown in Table 2.

TABLE 2. Molar volume of precipitated phases MgAXB in magnesium alloys.
The volume of a single unit cell was calculated according to the crystal structure and parameters obtained from the XRD card. The density of a single unit cell was calculated via the following formula:
The Mg24Y5 unit cell is body-centered cubic (BCC) structure, and the lattice parameters is a = 1.1257 × 10⁻⁷ cm. So the Volume of a single unit cell is a3 = (1.1257 × 10⁻⁷ cm)3 = 1.4265 × 10⁻²¹ cm3, the density of a single Mg24Y5 unit cell is
The molar volume of precipitated phases MgAXB in magnesium alloys was calculated via the formula as follow:
For example, the molar volume of
According to the formation Gibbs energies of the metal’s oxides (James 2005), the preferential metal atom of the precipitated phases MgAXB in magnesium alloys during oxidation reaction in the atmospheric environment were:
1) ΔfG°Al2O3 = −38.5 kJ/mol>ΔfG°MgO = −135.27 kJ/mol; Mg17Al12→Mg→MgO
2) ΔfG°ZnO = −76.08 kJ/mol>ΔfG°MgO = −135.27 kJ/mol; MgZn2→Mg→MgO
3) ΔfG°CuO = −31.0 kJ/mol>ΔfG°MgO = −135.27 kJ/mol; MgCu2→Mg→MgO
4) ΔfG°CaO = −144.25 kJ/mol<ΔfG°MgO = −135.27 kJ/mol; Mg2Ca→Ca→CaO
5) ΔfG°Gd2O3 = −434.9 kJ/mol<ΔfG°MgO = −135.27 kJ/mol; Mg3Gd→Gd→Gd2O3
6) ΔfG°Nd2O3 = −411.3 kJ/mol<ΔfG°MgO = −135.27 kJ/mol; Mg12Nd→Nd→Nd2O3
7) ΔfG°Ce2O3 = −407.80 kJ/mol<ΔfG°MgO = −135.27 kJ/mol; Mg12Ce→Ce→Ce2O3
8) ΔfG°Ag2O = −2.68 kJ/mol>ΔfG°MgO = −135.27 kJ/mol; MgAg→Mg→MgO
9) ΔfG°NiO = −50.6 kJ/mol>ΔfG°MgO = −135.27 kJ/mol; MgNi2→Mg →MgO
10) ΔfG°Y2O3 = −434.19 kJ/mol<ΔfG°MgO = −135.27 kJ/mol; Mg24Y5→Y→Y2O3
If there is one type of precipitated phase AUBV in magnesium alloy, the preferentially oxidized element is B-content in the AUBV single unit cell. Because the preferentially oxidized B-content is derived from AUBV, which is a solid solution structure. Therefore, the volume of B-content can be obtained from the volume of AUBV single unit cell subtracted the volume of unoxidized A-content (Xu and Gao, 2000), as shown by the following formula,
For example, the molar volume of Y atom in Mg24Y5 unit cell was calculated via:
Then, the density and molar mass of oxide product can be obtained via periodic table of elements. Thus, the molar volume of oxidized product can be calculated via the formula:
For example, the molar volume of oxide product Y2O3 from the oxidation of precipitated phases Mg24Y5 was calculated as follow:
The PBR value of oxidation films formed from the precipitated phases in magnesium alloys was calculated via the formula:
All the results were shown in Table 3.
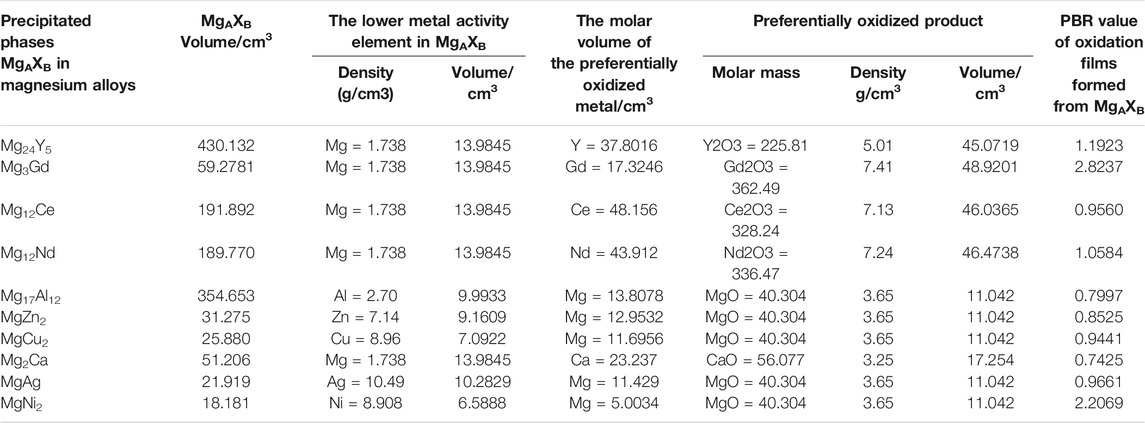
TABLE 3. PBR value of the oxide film formed from the precipitated phases of magnesium alloys.
Commercially pure Mg (99.9 wt. %), Mg- 3Y wt.%, Mg- 5Y wt.% and Mg- 7Y wt.% were used to characterize the oxide film on the surface of magnesium alloys. The samples with dimensions of 1 cm × 1 cm×1 cm were heated in the dry air at 400°C for 36 h. These samples were used to analyze the microstructure of oxide films, including the morphologies, thicknesses and compositions by scanning electron microscopy (SEM) and energy dispersive spectroscopy (EDS). The samples with dimensions of 2 cm × 2 cm × 0.5 cm were also heated in dry air at 400°C for 36 h, which were used to test the open circuit potential (OCP) using the electrochemical workstation. Three parallel samples were used to ensure the accuracy of the test results. All the samples were polished with 1,000, 3,000 and 5,000# SiC papers and then cleaned with absolute ethanol.
Due to the affinity of oxygen to magnesium alloys, samples are oxidized rapidly at a high temperature in dry air. The rate of oxidation increases first linearly, then exponentially with the extension of oxidation time (Zhou et al., 2013; Yu et al., 2016). Below 400–450°C, the magnesium alloys have certain oxidation resistance, with a parabolic oxidation kinetics and intact oxide film (Yu et al., 2018). Once the temperature exceedes 400°C, the oxidation reaction kinetics will change from parabolic to linear. The acceleration of oxidation reaction leads to the formation of film cracks on the surface. Therefore, in order to study the microstructure of the dense oxide films on Mg-Y alloys, the oxidation temperature of 400°C was chosen. The thermo gravimetric analysis (TGA) was used to measure the weight increment of different samples. The heating rate was 10°C/min in the air environment from room temperature to 500°C.
As shown in Figure 1, the morphologies of oxide films formed on Mg-xY (x = 0, 3, 5, 7 wt.%) samples are quite different. Many MgO particles and pores existed on the surface of pure Mg, indicating a poor corrosion resistance of the oxide film. With the addition of 3 wt.% Y, the surface tended to be smooth and compact, and the pores were also disappeared. However, there were still a small amount of MgO particles on the sample surface. With the increasing of Y-content, MgO particles disappeared completely, whereas the squama-like oxides formed on the surface of Mg-5Y alloys. As the Y content increased to 7 wt.%, the size of the squama-like oxides becomes larger, and the boundary of oxides turned clearly.
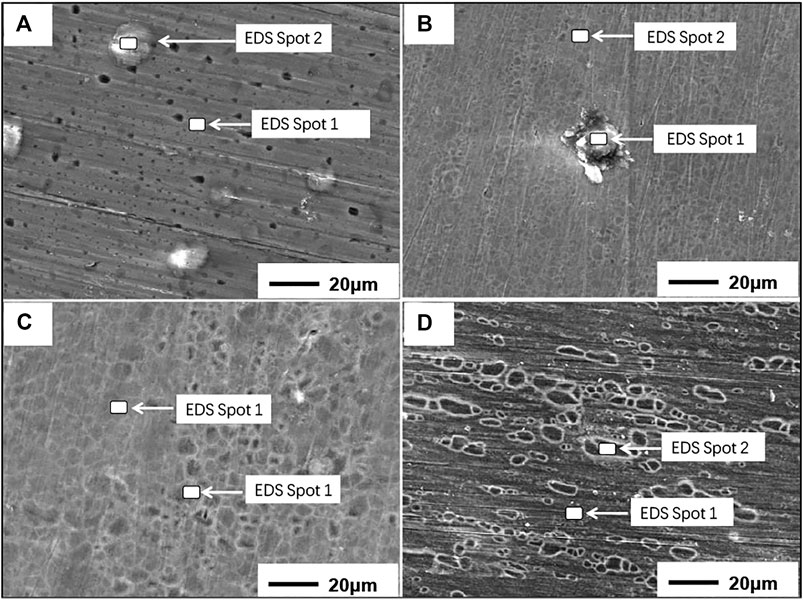
FIGURE 1. The oxides morphologies of different samples: (A) pure Mg; (B) Mg-3Y; (C) Mg-5Y; (D) Mg-7Y.
The EDS results of oxides on the surface of Mg-xY (x = 0, 3, 5, 7 wt.%) samples are shown in Table 4. The Y-contents in the oxides are more than the matrix. Both the O-content and Y-content increased with the addition of Y element, whereas the Mg-content decreased. This phenomenon because that the activity of Y element is higher than Mg element. With the extension of oxidation time, the thickness of oxides increased. The oxidation rate of all the samples was reduced by the oxides barrier, which inhibited the inward diffusion of O2 and the outward diffusion of Mg2+. According to the calculation in Table 3, the PBR of Y2O3 formed from the Mg24Y5 unit cell was 1.1923, which indicated that the Y2O3 oxidation film was compact. Moreover, the chemical property of Y2O3 was relatively stable. Therefore, when Mg-Y alloys were exposed in the high temperature environment, the dense MgO/Y2O3 composite oxide layers were formed on the sample surfaces. The composite oxide layer acted as a physical barrier to hinder the oxidation reaction, thus the oxidation of magnesium alloys was slowed down (Wang et al., 2008).
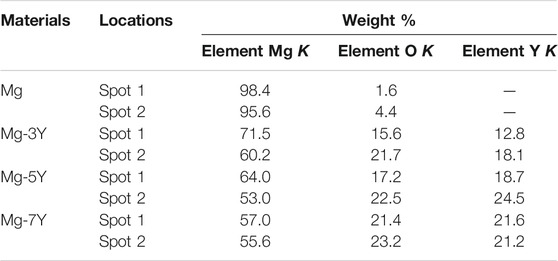
TABLE 4. The EDS results of oxides of different materials.
The TGA result was shown in Figure 2. From the trends of the curves in the figure, all samples had a fast oxidation rate at the initial stage. The oxidation reaction rate decreased with the prolong of oxidation reaction time and the rising of temperature. The Mg-5Y alloys had the faster oxide reaction rate than the pure Mg, Mg-3Y and Mg-7Y samples at the initial stage of oxidation. Then, the thin, smooth and dense oxide films were formed on the surface of samples, the oxidation rates were all reduced. At the maximum temperature, the weight improvement ratio of pure Mg, Mg-3Y, Mg-5Y and Mg-7Y was 0.80, 0.82, 0.85 and 0.91%, respectively. This phenomenon indicated that Y element had the higher activity to bind with oxygen than Mg.
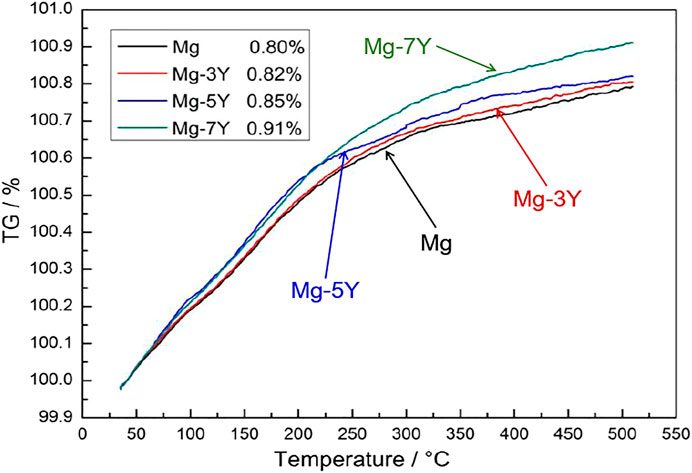
FIGURE 2. The thermo gravimetric analysis results of different samples.
According to the mapping results in Figure 3, the difference of Y-content in Mg-xY (x = 3, 5, 7 wt.%) alloys led to the different elementary composition in the oxidation products.
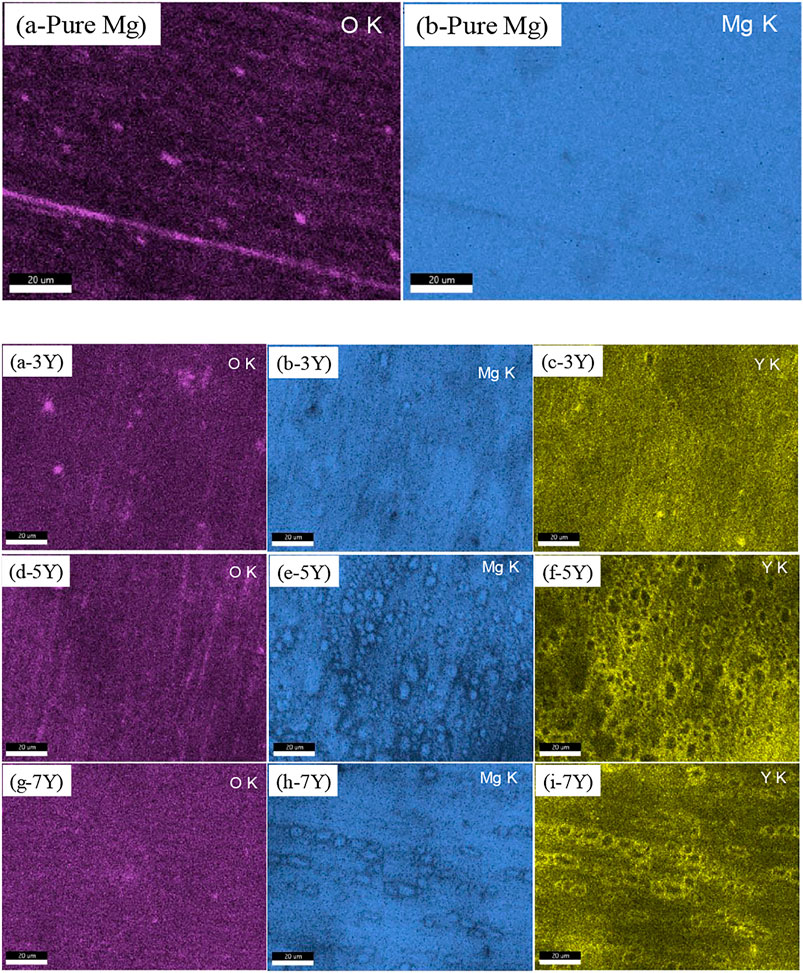
FIGURE 3. The mapping results of elementary composition in the oxidation products on different samples surfaces: (a-pure Mg) and (b-pure Mg): pure Mg; (a-3Y) and (b-3Y) and (c-3Y): Mg-3Y; (d-5Y) and (e--5Y) and (f-5Y): Mg-5Y; (g-7Y) and (h-7Y) and (i-7Y): Mg-7Y.
As shown in Table 5, mapping analysis on the surface of pure magnesium showed that the O content was only 2.5%. This phenomenon proved that the oxide film on the surface was very thin, so that the electron beam can penetrate the oxide film and reach the Mg matrix. The oxidation films of Mg-3Y samples were composed of MgO as the major constituent and minor Y2O3. When Y-content was 3 wt.%, the average content of oxygen element in the surface mapping analysis was about 13.8 wt.%, and the Y element was about 21.1 wt.%, which indicated that a large number of Y2O3 were formed in the oxide film. The content of Y element was larger than that of in the alloy matrix without oxidation. With the increase of Y-content to 7 wt.%, the O element on the surface film increased to 16.1 wt.%, while the Y content increased to 26.9 wt.%.
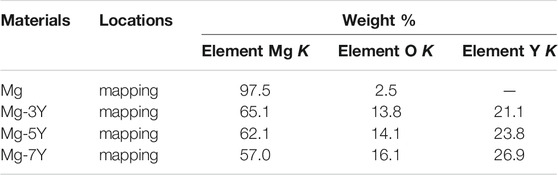
TABLE 5. The EDS mapping analysis of different samples.
The average thicknesses of oxidation films for different samples were measured by backscattered electrons scanning spectroscopy, as shown in Figure 3. And the elemental composition at different cross-section locations was also analyzed by EDS, with results summarized in Table 6. In Figure 4 the average thickness of oxidation films on the surface of pure Mg was about 0.4 μm. With the addition of Y-content, the oxidation film thickness increased from 0.5 μm (Mg-3Y) to more than 1.5 μm (Mg-7Y). This phenomenon was attributed to the high activity of Y element, which preferentially combines with oxygen to form oxide films (Wang et al., 2009).
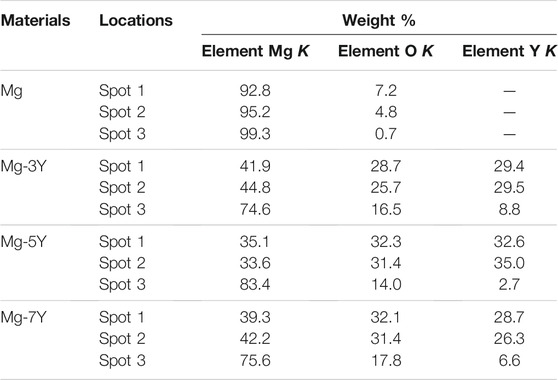
TABLE 6. The elemental composition of different cross-section locations.

FIGURE 4. The thicknesses of oxidation films on different samples measured by backscattered electrons: (A) pure Mg; (B) Mg-3Y; (C) Mg-5Y; (D) Mg-7Y.
As shown in Table 6, all the oxidation films were consisted of Y2O3 and MgO. For both pure Mg and Mg-xY (x = 3, 5, 7 wt.%) alloys, the major content of the oxidation film is MgO. However, the closer to the top surface of the oxide film, the larger amount of Y2O3-content. In general, the protection performance of oxidation products to α-Mg matrix was related the PBR of films covered on the samples, which determine the diffusion rate of metal atoms from metal/oxide interface to oxide/air interface, and the diffusion rate of oxygen atoms from oxide/air interface to metal/oxide interface (Zhao et al., 2018). The inward diffusion of oxygen atoms and the outward diffusion of Mg atoms through the oxide films was suppressed due to the compact microstructure of Y2O3-content.
Figure 5 shows the open circuit potential of pure Mg and Mg-xY alloys covered with oxidation films in 3.5% NaCl solution. As time increased, all the ocp values decreased, due to the desquamation of oxidation films covered on the surface of samples (Jiang, et al., 2021). The OCP value of Mg-7Y alloy was the most positive, indicating the most alleviated local corrosion of Mg-7Y alloy among the samples. In addition, with the extension of immersion time, the OCP of Mg-Y alloys tended to be stable, indicating a stabilized surface state. The electrochemical activity of the samples decreased in the order of Mg-7Y > Mg-5Y > Mg-3Y > pure Mg. The corrosion tendency of Mg-7Y was the lowest in the exposure of 3.5% NaCl for 1200s, due to the protection of the thick and compact oxidation film.
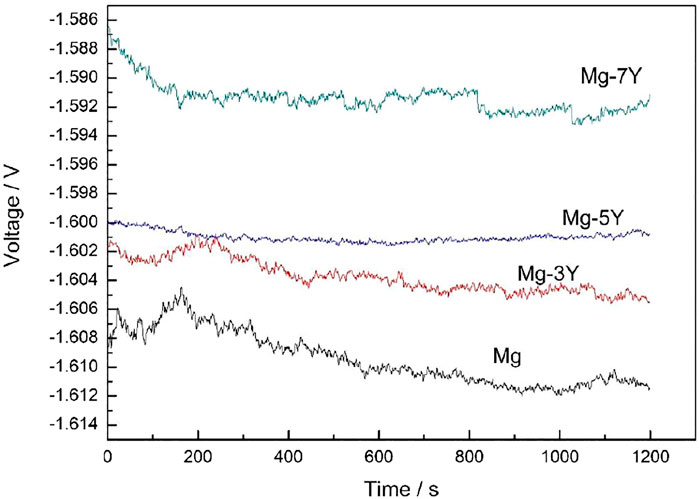
FIGURE 5. The electrochemical open circuit potential of samples covered with oxidation films in the surface measured in 3.5% NaCl solution.
The Tafel slopes of pure Mg and Mg-xY alloys covered with oxidation films measured in 3.5% NaCl solution was shown in Figure 6. The corrosion reactions were identical according to the similarity of all the Tafel curves. As shown in Figure 6, the characteristic anode branches were generally sharp formation, which represented the dissolution of α-Mg. The cathodic hydrogen evolution was the main reaction, which determined the reaction rate of the electrochemical corrosion. When the potential was more negative than the pitting potential, the cathodic branch showed up linear Tafel characteristics. Therefore, the corrosion current density of pure Mg and Mg-xY alloys was calculated by the tangent of linear cathode branch. The results of corrosion current density were shown in the table of Figure 6. Due to the different resistance of oxides films to the corrosion reaction, the pure Mg showed a largest Icorr, whereas the Mg-7Y alloy showed the smallest. The results depended on thickness and density of oxides films, which indicated that the oxides films formed in the surface of Mg-7Y alloy showed a best corrosion barrier effect.
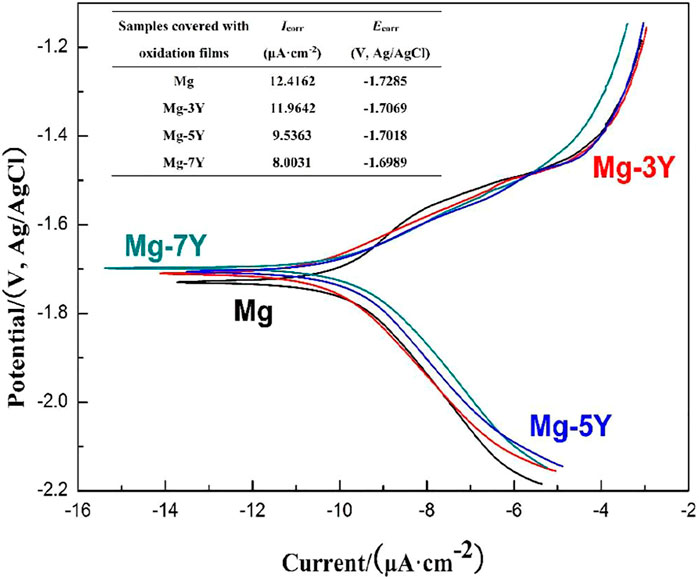
FIGURE 6. The electrochemical Tafel slopes of samples covered with oxidation films in the surface measured in 3.5% NaCl solution.
The electrochemical impedance spectra curves of pure Mg and Mg-xY alloys covered with oxidation films measured in 3.5% NaCl solution was shown in Figure 7. The largest electrochemical impedance spectra of Mg-7Y alloy samples indicated that hydrogen evolution of the α-Mg matrix reaction had the largest energy barrier. According to the results in Figure 6, the corrosion resistance can be ranked as follows: pure Mg<Mg-3Y<Mg-5Y<Mg-7Y, which demonstrated that the tendency was consistent with the preceding data in this study. The electrochemical impedance spectra curves of different samples were different, which represented distinctive dynamic corrosion process. The larger of the PBR of oxides films, the stronger of the barrier effect on the ion diffusion of corrosion reaction. Therefore, the alloy with the most Y-content showed the best corrosion resistance.
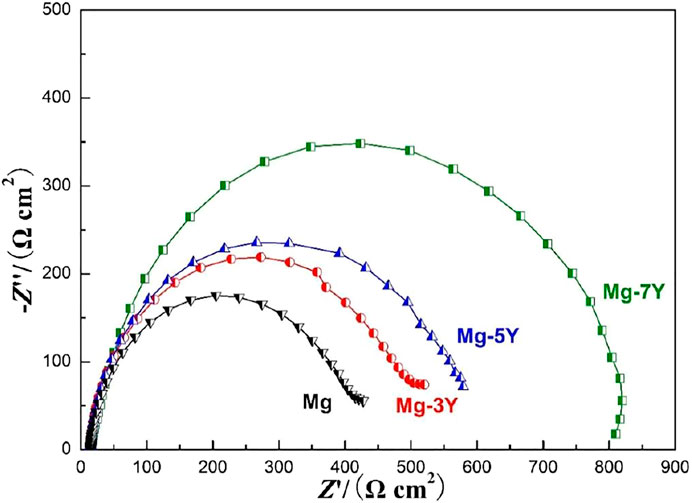
FIGURE 7. The electrochemical impedance spectra curves of samples covered with oxidation films in the surface measured in 3.5% NaCl solution.
PBR is the ratio of oxide volume generated from the combination of metal and oxygen on the metal surface to the volume of consumed metal atoms, which reflects the stress condition in the oxide film. The corrosion tendency of magnesium alloy is closely related to the conditions of oxide layer during oxidation. The PBR of Y2O3 films generated from Mg24Y5 was about 1.1923, which indicated the Y2O3 films were continuous and compact (Okamoto, 1992). Therefore, the content of Y-content increased, the corrosion tendency of Mg-Y alloys decreased. When PBR is less than 1 or more than 2, tensile stress or excessive compressive stress exists in the oxide film, and the film is prone to rupture. The PBR value of MgO/Mg was 0.81, which indicated that the MgO layer had a large internal tensile stress, and the film structure was loose (Lin, et al., 2010; Qin, et al., 2016; Lee, et al., 2017). As a result, the pure Mg had the largest corrosion tendency than Mg-Y alloys.
As shown in Figure 8, the oxidation mechanism of pure Mg and Mg-Y alloys in this study. With the increasing of Y-content, the amount and volume fraction of precipitated phases on grain boundary of Mg-Y binary alloys became larger before heat treatment. After the heat treatment, pure Mg reacted with O atom to form a loose porous oxide film in Figure 7A. For Mg-Y binary alloys, the Y atom bonded to the O atom preferentially, and then the Mg atom bonded to the O atom at the high temperatures. The Y2O3 and MgO products formed in the surface of different Mg-Y binary alloys. With the increasing of Y-content, the ratio of Y2O3 formed in the oxides became larger. Moreover, the volume and dimensions of Y2O3 also showed a large improvement. As the oxidation reaction processed, the equilibrium state of the interface between the alloy and the oxidation environment changed (You, et al., 2014). At the initial stage of oxidation, the equilibrium state of the alloy interface was alloy-oxidation environment. With the formation of oxidation films, the equilibrium state of the interface changed to alloy/oxidation products/oxidation environment. During the oxidation reaction, the PBR value of MgO products was only about 0.8, which could not protect the α-Mg matrix from the further corrosion reaction effectively. However, the PBR value of Y2O3 was larger than 1, which improved the overall density of mixed oxide in the surface to a certain extent. Therefore, the protective effect of mixed oxide on the matrix was improved. This phenomenon indicated that the more of Y-content, the stronger the protective effect of oxide film on the α-Mg matrix.

FIGURE 8. The oxidation mechanism of pure Mg and Mg-Y alloys in this study.
On the other hand, precipitated phases in the magnesium alloys often act as the cathode of microelectrochemical coupling reaction, accelerating the corrosion of α-Mg matrix. With the alloying element increased gradually, more and more Y-content reacted with α-Mg matrix, the number of precipitated phases also increased tremendously. However, In the heating process, the precipitated phases containing rare earths were easier to oxidize than the magnesium matrix. And then the Y2O3 formed have a better protection effect on the α-Mg matrix. The more precipitated phases contained rare earth were, the more Y2O3 is oxidized, which resulted a improvement to the corrosion resistance of α-Mg matrix.
In fact, different types of precipitated phases may exist in the same magnesium alloy. Moreover, one alloying element also may form different kinds of precipitated phases in the magnesium alloys with the changes of the alloying element content. In this work, the PBR values of the oxide film formed from the common precipitated phases in magnesium alloys were calculated. In the actual oxidation process of magnesium alloys, it is possible that multiple oxidation reactions occur simultaneously. This research is expected to provide guidance in the development of heat-resistant magnesium alloys by adjusting the types of alloying elements and film formation from the precipitated phases.
1) The PBR values of preferentially oxides formed from Mg12Nd and Mg24Y5 were 1.0584 and 1.1923, respectively, which indicated a good protection for the Mg matrix. The PBR values of preferentially oxides formed from Mg3Gd and MgNi2 were larger than 2, which existed a compressive stress. The PBR values of preferentially oxides formed from Mg17Al12, MgZn2, MgCu2, Mg2Ca, Mg12Ce, and MgAg were less than 1, which existed a tensile stress. Both compressive stress and tensile stress would lead the fracture of oxides. These PBR values of oxides indicated a poor protection of Mg matrix.
2) The oxide films formed on the surfaces of Mg-xY (x = 3, 5, 7 wt.%) samples were consisted of Y2O3 and MgO. The formation of Y2O3 was caused by the oxidation of Mg24Y5. The PBR values of preferentially oxides formed from Mg24Y5 was 1.1923, and then increased the PBR of MgO formed from Mg matrix to a certain extent. The electrochemical experiments proved that the corrosion resistance of Mg-Y alloys improved with the increasing of Y-content.
3) In the actual oxidation process, multiple oxidation reactions will occur simultaneously. The composition of oxide films on the surface of magnesium alloys are complex. This work is expected to give a scientific and reasonable method to improve intrinsic corrosion resistance of magnesium alloys by regulating the types of precipitates.
The original contributions presented in the study are included in the article/Supplementary Material, further inquiries can be directed to the corresponding author.
QJ and DL conceived and designed the study and experiment plan. CL performed the experiments. NL analyzed the energy dispersive spectrum datas. BH verified the experimental results. QJ wrote the paper. DL, CL, NL, and BH reviewed and edited the manuscript. All authors read and approved the manuscript.
The present work was supported by National Natural Science Foundation of China for Exploring Key Scientific Instrument (No.41827805) and the Open Funds of the State Key Laboratory of Rare Earth Resource Utilization (No. RERU2021017) for providing support.
The authors declare that the research was conducted in the absence of any commercial or financial relationships that could be construed as a potential conflict of interest.
All claims expressed in this article are solely those of the authors and do not necessarily represent those of their affiliated organizations, or those of the publisher, the editors and the reviewers. Any product that may be evaluated in this article, or claim that may be made by its manufacturer, is not guaranteed or endorsed by the publisher.
The authors gratefully acknowledge professor Kui Zhang of State Key Laboratory for Fabrication and Processing of Nonferrous Metals.
Bradford, S. A. (1993). Oxidation: Metal-Gas Reactions, Corrosion Control. Boston, MA, US: Springer, 289–312. doi:10.1007/978-1-4684-8845-6_14
Chang, C. L., Lu, S., Fu, Y. Y., and Zhang, H. P. (2015). Flammability and the Oxidation Kinetics of the Magnesium Alloys AZ31, WE43, and ZE10. Corrosion Sci. 100, 177–185. doi:10.1016/j.corsci.2015.07.020
Cheng, S. L., Yang, G. C., Fan, J. F., Li, Y. J., and Zhou, Y. H. (2009). Effect of Ca and Y Additions on Oxidation Behavior of AZ91 alloy at Elevated Temperatures. Trans. Nonferrous Met. Soc. China 19, 299–304. doi:10.1016/S1003-6326(08)60268-X
Czerwinski, F. (2002). The Oxidation Behaviour of an AZ91D Magnesium alloy at High Temperatures. Acta Mater. 50, 2639–2654. doi:10.1016/S1359-6454(02)00094-0
Czerwinski, F. (2012). Oxidation Characteristics of Magnesium Alloys. JOM 64 (12), 1477–1483. doi:10.1007/s11837-012-0477-z
Czerwinski, F. (2015). The Reactive Element Effect on High-Temperature Oxidation of Magnesium. Int. Mater. Rev. 60 (5), 264–296. doi:10.1179/1743280415Y.0000000001
Fan, J. F., Yang, C. L., Han, G., Fang, S., Yang, W. D., and Xu, B. S. (2011). Oxidation Behavior of Ignition-Proof Magnesium Alloys with Rare Earth Addition. J. Alloys Comp. 509 (5), 2137–2142. doi:10.1016/j.jallcom.2010.10.168
Jiang, Q. T., Lu, D. Z., Wang, N., Wang, X. T., Zhang, J., Duan, J. Z., et al. (2021). The Corrosion Behavior of Mg-Nd Binary Alloys in the Harsh marine Environment. J. Magnesium Alloys 9 (1), 292–304. doi:10.1016/j.jma.2019.12.010
Kaya, A. A. (2020). Review on Developments in Magnesium Alloys. Front. Mater. 7, 198. doi:10.3389/fmats.2020.00198
Lee, D. B., Abro, M. A., and You, B. S. (2017). High-temperature Oxidation of AZ91-0.3%Ca-0.1%Y alloy in Air. Met. Mater. Int. 23 (4), 720–725. doi:10.1007/s12540-017-6745-2
Lin, P. Y., Zhou, H., Sun, N., Li, W. P., Wang, C. T., Wang, M. X., et al. (2010). Influence of Cerium Addition on the Resistance to Oxidation of AM50 alloy Prepared by Rapid Solidification. Corrosion Sci. 52, 416–421. doi:10.1016/j.corsci.2009.09.029
Liu, J., Li, Y., and Wang, F. (2009). The High Temperature Oxidation Behavior of Mg-Gd-Y-Zr alloy. Oxid Met. 71, 319–334. doi:10.1007/s11085-009-9145-2
López, M. D., Múnez, C. J., Carboneras, M., Rodrigo, P., Escalera, M. D., and Otero, E. (2010). Influence of Temperature on Oxidation Behaviour of ZE41 Magnesium alloy. J. Alloys Comp. 491 (1/2), 131–136. doi:10.1016/j.jallcom.2009.10.163
Mebarki, N., Ravi Kumar, N. V., Blandin, J. J., Suery, M., Pelloux, F., and Khelifati, G. (2005). Correlation between Ignition and Oxidation Behaviours of AZ91 Magnesium alloy. Mater. Sci. Technol. 21, 1145–1151. doi:10.1179/174328405X58904
Medved, J., Mrvar, P., and Vončina, M. (2009). Oxidation Resistance of Cast Magnesium Alloys. Oxid Met. 71 (5/6), 257–270. doi:10.1007/s11085-009-9141-6
Nie, J. F. (2012). Precipitation and Hardening in Magnesium Alloys. Metall. Mater. Trans. A 43, 3891–3939. doi:10.1007/s11661-012-1217-2
Okamoto, H. (1992). Mg-Y (Magnesium-Yttrium). J. Phase Equilib. 13 (1), 105–106. doi:10.1007/BF02645395
Qin, L., Ding, J., Zhao, W. M., and Fang, Z. (2016). Oxidation Behavior and Surface Tension of Mg-1.2Ca alloy with Ce Addition. Rare Metal Mater. Eng. 45 (1), 23–27. doi:10.1016/S1875-5372(16)30039-X
Shi, Z. Z., Chen, H. T., Zhang, K., Dai, F. Z., and Liu, X. F. (2020). Crystallography of Precipitates in Mg Alloys. J. Magnesium Alloys 9 (2), 416–431. doi:10.1016/j.jma.2020.06.013
Song, X., Wang, Z. W., and Zeng, R. C. (2021). Magnesium Alloys: Composition, Microstructure and Ignition Resistance. Chin. J. Nonferrous Met. 31 (3), 598–622. doi:10.11817/j.ysxb.1004.0609.2021-40013
Sudholz, A. D., Gusieva, K., Chen, X. B., Muddle, B. C., Gibson, M. A., and Birbilis, N. (2011). Electrochemical Behaviour and Corrosion of Mg-Y Alloys. Corrosion Sci. 53 (6), 2277–2282. doi:10.1016/j.corsci.2011.03.010
Tan, Q., Atrens, A., Mo, N., and Zhang, M.-X. (2016). Oxidation of Magnesium Alloys at Elevated Temperatures in Air: A Review. Corrosion Sci. 112, 734–759. doi:10.1016/j.corsci.2016.06.018
Van Orman, J. A., and Crispin, K. L. (2010). Diffusion in Oxides. Rev. Mineralogy Geochem. 72 (1), 757–825. doi:10.2138/rmg.2010.72.17
Wang, X. M., Zeng, X. Q., Wu, G. S., Yao, S. S., and Li, L. B. (2007). Surface Oxidation Behavior of MgNd Alloys. Appl. Surf. Sci. 253 (22), 9017–9023. doi:10.1016/j.apsusc.2007.05.023
Wang, X. M., Zeng, X. Q., Zhou, Y., Wu, G. S., Yao, S. S., and Lai, Y. J. (2008). Early Oxidation Behaviors of Mg-Y Alloys at High Temperatures. J. Alloys Comp. 460 (1), 368–374. doi:10.1016/j.jallcom.2007.06.065
Wang, X. M., Wu, W. D., Tang, Y. J., Zeng, X. Q., and Yao, S. S. (2009). Early High Temperature Oxidation Behaviors of Mg-10Gd-3Y Alloys. J. Alloys Comp. 474 (1/2), 499–504. doi:10.1016/j.jallcom.2008.06.122
Xu, C., and Gao, W. (2000). Pilling-Bedworth Ratio for Oxidation of Alloys. Mater. Res. Innov. 3, 231, 235. doi:10.1007/s100190050008
You, B.-S., Park, W.-W., and Chung, I.-S. (2000). The Effect of Calcium Additions on the Oxidation Behavior in Magnesium Alloys. Scripta Mater. 42, 1089, 1094. doi:10.1016/S1359-6462(00)00344-4
You, B. S., Kim, Y. M., Yim, C. D., and Ha, S. K. (2014). “Oxidation and Corrosion Behavior of Non-flammable Magnesium Alloys Containing , Ca and Y,” in Magnesium Technology. Editors M. Alderman, M. V. Manuel, N. Hort, and N. R. Neelameggham (New York, US: John-wiley), 325–329. doi:10.1002/9781118888179.ch62
Yu, X. W., Jiang, B., Yang, H., Yang, Q. S., Xia, X. S., and Pan, F. S. (2015). High Temperature Oxidation Behavior of Mg-Y-Sn, Mg-Y, Mg-Sn Alloys and its Effect on Corrosion Property. Appl. Surf. Sci. 353, 1013–1022. doi:10.1016/j.apsusc.2015.07.011
Yu, X., Shen, S., Jiang, B., Jiang, Z. T., Yang, H., and Pan, F. S. (2016). The Effect of the Existing State of Y on High Temperature Oxidation Properties of Magnesium Alloys. Appl. Surf. Sci. 370, 357–363. doi:10.1016/j.apsusc.2016.02.156
Yu, X. W., Jiang, B., He, J. J., Liu, B., and Pan, F. S. (2018). Oxidation Resistance of Mg-Y Alloys at Elevated Temperatures and the protection Performance of the Oxide Films. J. Alloys Comp. 749, 1054–1062. doi:10.1016/j.jallcom.2018.03.342
Zhao, X. Y., Ning, Z. L., Li, Z. Q., Zou, W. B., Li, B. H., He, K., et al. (2018). In-mold Oxidation Behavior of Mg-4.32Y-2.83Nd-0.41Zr alloy. J. Mater. Sci. 53 (15), 11091–11103. doi:10.1007/s10853-018-2271-y
Zhou, N., Zhang, Z. Y., Dong, J., Jin, L., and Ding, W. J. (2013). Selective Oxidation Behavior of an Ignition-Proof Mg-Y-Ca-Ce alloy. J. Rare Earths 31 (10), 1003–1008. doi:10.1016/S1002-0721(13)60021-6
Keywords: oxide, PBR value, magnesium alloys, precipitated phases, Mg-Y
Citation: Jiang Q, Lu D, Liu C, Liu N and Hou B (2021) The Pilling-Bedworth Ratio of Oxides Formed From the Precipitated Phases in Magnesium Alloys. Front. Mater. 8:761052. doi: 10.3389/fmats.2021.761052
Received: 19 August 2021; Accepted: 08 October 2021;
Published: 16 November 2021.
Edited by:
Yingwei Song, Institute of Metals Research (CAS), ChinaCopyright © 2021 Jiang, Lu, Liu, Liu and Hou. This is an open-access article distributed under the terms of the Creative Commons Attribution License (CC BY). The use, distribution or reproduction in other forums is permitted, provided the original author(s) and the copyright owner(s) are credited and that the original publication in this journal is cited, in accordance with accepted academic practice. No use, distribution or reproduction is permitted which does not comply with these terms.
*Correspondence: Quantong Jiang, amlhbmdxdWFudG9uZ0BxZGlvLmFjLmNu; Nazhen Liu, bGl1bmF6aGVuQHFkaW8uYWMuY24=
Disclaimer: All claims expressed in this article are solely those of the authors and do not necessarily represent those of their affiliated organizations, or those of the publisher, the editors and the reviewers. Any product that may be evaluated in this article or claim that may be made by its manufacturer is not guaranteed or endorsed by the publisher.
Research integrity at Frontiers
Learn more about the work of our research integrity team to safeguard the quality of each article we publish.