Corrigendum: Performance simulation of a 5 kW hall thruster
 L. Yang
 P. Y. Wang
- School of Electrical Engineering, Northwest University for Nationalities, Lanzhou, China
Hall thruster is a kind of plasma optics device, which is used mainly in space propulsion. To simulate the discharge process of plasma and the performance of a 5 kW hall thruster, a two-dimensional PIC-MCC model in the R-Z plane is built. In the model, the anomalous diffusion of the electrons including Bohm diffusion and near-wall conduction is modeled. The Bohm diffusion is modeled by using a Brownian motion instead of the Bohm collision method and the near-wall conduction is modeled by a secondary electron emission model. In addition to the elastic, excitation, and ionization collisions between electrons and neutral atoms, the Coulomb collisions are included. The plasma discharge process including the transient oscillation and steady state oscillation is well reproduced. First, the influence of the discharge voltage and magnetic field on the steady state oscillation is simulated. The oscillation amplitude increases as the discharge voltage gets larger at first, and then decreases. While the oscillation amplitude decreases as the magnetic field gets stronger at first, and then increases. Later, the influence of the discharge voltage and mass flow rate on the performance of the thruster is simulated. When the mass flow rate is constant, the total efficiency initially increases with the discharge voltage, reaches the maximum at 600 V, and then declined. When the discharge voltage is constant, the total efficiency increases as the mass flow rate rises from 10 to 15 mg/s. Finally, a comparison between simulated and experimental performance reveals that the largest deviation is within 15%, thereby indirectly validating the accuracy of the model.
Introduction
Hall electric propulsion is one of the most mature and widely used electric propulsion technologies (Pidgeon, 2006; Mathers et al., 2009). LHT-140 (Figure 1) is a 5 kW hall thruster developed by the Lanzhou Institute of Physics. At present, the discharge characteristics of the plasma and the performance of a hall thruster are evaluated mainly by conducting high–cost and time–consuming experiments. As research on plasma discharge mechanism becomes in depth and numerical methods improve continuously, simulation plays an increasely important role in understanding the micro physical process of hall thruster (Arkhipov and Bishaev, 2007; Hofer, 2008; Zhang et al., 2011; Zhang et al., 2014). Lentz built a one-dimensional particle-in-cell (PIC) model (Lentz, 1993) and simulated the plasma characteristics and performance of a Japanese hall thruster. Noguchi, Martinez–Sanchez and Ahedo studied axial plasma discharge oscillation by using a one-dimensional PIC model (Noguchi et al., 1999). Hirakawa built a two-dimensional PIC model (Hirakawa and Arakawa, 1996) and simulated the electron diffusion. Later, Beidler (1999), Szabo (2001), Sullivan (2004) and Adam et al. (2004) improved the simulation method continuously.
FIGURE 1
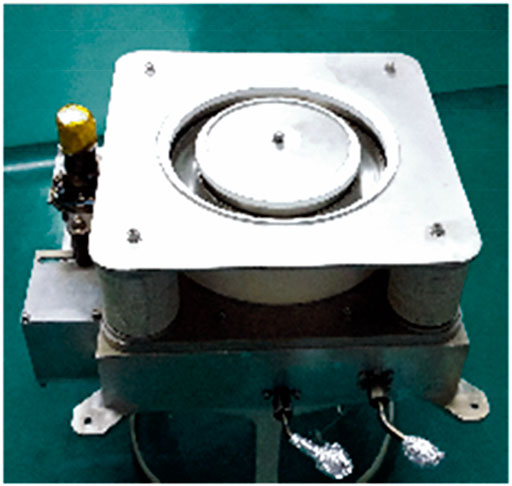
FIGURE 1. LHT-140 hall thruster.
In most PIC models, Bohm collision was applied to simulate the anomalous diffusion of electrons (Koo and Boyd, 2006; Cho et al., 2013). The limitation is that not all the probable diffusion magnitudes can be simulated. In this paper, we applied the method of Vincent (2002) to simulate Bohm diffusion, to allow the simulation of any diffusion magnitude. In addition, in most present models, the Coulomb collisions between electrons and ions, as well as electrons and electrons, are excluded, we simulated the Coulomb collisions by using the method of Szabo (2001).
This paper aims to evaluate the performance and discharge characteristics of LHT-140 by using the built PIC model. First, the numerical methods applied in the building process of the model are introduced. Second, the plasma discharge characteristics and thruster performance are simulated. Finally, the simulated and experimental performance results are compared.
Numerical Methods
Simulation Region
The simulation region (Figure 2) consists of the discharge channel and the near plume region. The length and width of the near plume region is 1.5 and 4.5 times that of the discharge channel, respectively. The boundary of the discharge channel consists of a metal anode wall, ceramics wall, symmetric axis, and free space.
FIGURE 2
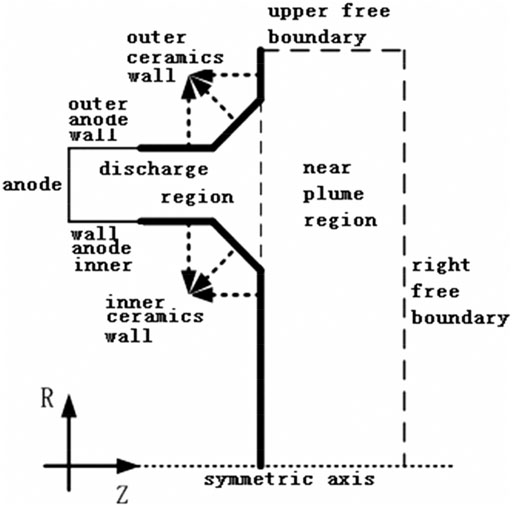
FIGURE 2. Simulation region.
Model Simplification
Lightening ions using an artificial mass ratio and increasing the vacuum permittivity using artificial permittivity are conventional methods to simplify the particle-in-cell (PIC) model (Szabo, 2001). Speeding up the ions could shorten the time of convergence. In this study, we apply an artificial mass ratio of f = Mreal/Mcomp = 1,000, which indicates that the ions are 1,000 times lighter than they should be. Increasing the vacuum permittivity enables us to use a coarser grid. In this study, we increase the vacuum permittivity by 2,500 times. Consequently, the size of rectangular grid applied in our model could be magnified by 50 times (Szabo, 2001). The LHT-140 Hall thruster is similar to the 5 kW P5 Hall thruster (Vincent, 2002), and the Debye length of 0.02 mm in reference (Vincent, 2002) is used in our model. Finally, the mesh size becomes 1 mm after increasing the vacuum permittivity.
Potential and Electric Field Solving
The potential was acquired by solving the Poisson equation. The boundary conditions of the potential are as follows:
• At the anode surface, the potential is set to discharge voltage.
• At the symmetric axis, the normal electric field
• At the free space boundary, the potential is set to 0 V.
• At the boron nitride ceramic wall surface, the boundary condition is (Vincent, 2002):
For LHT-140 hall thruster, both in and outside the discharge channel,
The electric field was solved by Eqs 4, 5 (Birdsall and Langdon, 1991):
where
Moving the Particles
Both neutrals and charged particles were modeled by PIC-MCC method. After the electric filed was determined, electrons and ions moved by the electric and magnetic fields were simulated using the leapfrog method (Birdsall and Langdon, 1991). The neutrals were not affected by the electric and magnetic fields, and there’s no need to update their velocity during each time step if there’s no collision. Because the density of neutrals is much larger than that of charged particles, a larger weight should be used for neutrals, which was 60 in our model.
Cathode Modeling
The cathode is modeled by injecting electrons from the upper free boundary with 0.1 eV of kinetic energy. The number of electrons injected in each time step is determined by current balance.
Cathode current getting into the discharge region
From Eq. 7, the number of electrons injected in each time step could be determined.
Anomalous Diffusion
The Bohm diffusion and near-wall conduction are the main factors that lead to the anomalous diffusion of electrons. Usually, a virtual collision called “Bohm collision” is introduced to simulate the Bohm diffusion. The Bohm collision frequency
Thus, not all the probable diffusion magnitudes can be simulated. Vincent (2002) applied a Brownian motion to simulate the Bohm diffusion. After the electron was moved by the leapfrog algorithm, it was then moved in the two-dimensional plane perpendicular to the local magnetic field
where
Coulomb Collision
According to J. J. Szabo’s method (Szabo, 2001), the Coulomb collision frequency can be calculated as follows:
The collision section can be calculated as follows:
where
Near-Wall Conduction
A secondary electron emission model of Richard R. Hofer (Hofer et al., 2007) was applied to simulate the near-wall conduction of electrons.
where
where
where
R1, R2, and R3 are random numbers between 0 and 1.
Performance Model
The main performance of a hall thruster includes thrust, specific impulse and efficiency. The thrust is calculated by summing the product of mass flow rate and axial speed of ions that leave from the thruster exit.
where
The utilization efficiency of propellant is defined as the ratio of the mass flow rate of ions leaving the discharge channel to that of propellant atoms entering the discharge channel
The efficiency of electrical energy converted into kinetic energy of ions is defined as:
The relationship between the total efficiency and other efficiencies is
where
Results and Discussion
Plasma Discharge
The plasma discharge process of LHT-140 when the discharge voltage is 300 V and the propellant mass flow rate is 10 mg/s is simulated. Figure 3 shows the change of currents with time. The process consists of transient oscillation and steady-state periodic oscillation. During the transient oscillation, the discharge and ion currents increase quickly, reaching a maximum, which is far larger than the steady-state value at approximately 15 μs. Figure 3 shows that the transient maximum value of the discharge current is twice that in the steady state. After the transient reached the maximum value, the currents decreased and then oscillated periodically, which indicated the beginning of the so-called “breathing oscillation” (Fife et al., 1997; Boeuf and Garrigues, 1998).
FIGURE 3
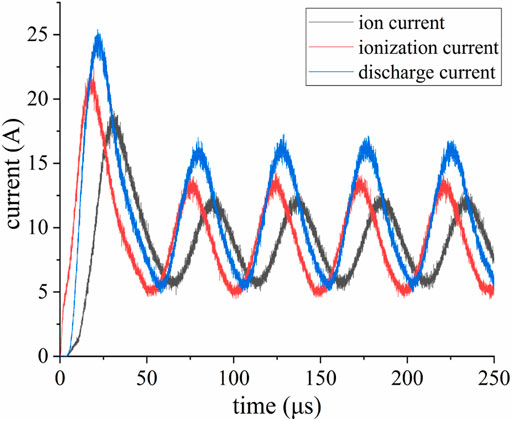
FIGURE 3. Time history of current.
Figure 4 presents the change of maximum value (Imax), minimum value (Imin), and average value (Iave) of the discharge current and the oscillation frequency (fosc) with discharge voltage. The discharge voltage significantly affected the oscillation. When the discharge voltage increased from 300 to 700 V, the oscillation amplitude (Imax−Imin) increased from 1.8 to 7.1 A. When the discharge voltage increased from 700 to 900 V, the oscillation amplitude decreases from 7.1 to 3.1 A. The oscillation frequency increased from 12 to 20 kHz.
FIGURE 4
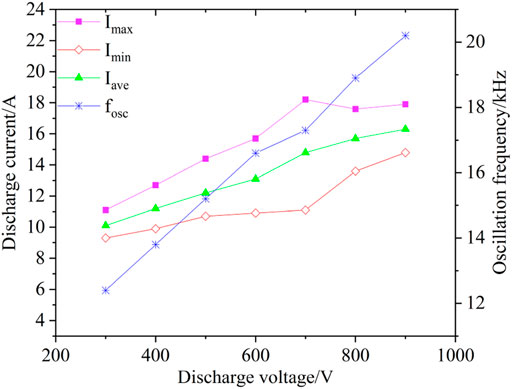
FIGURE 4. Simulated oscillation amplitude and frequency of discharge currentwith different discharge voltages.
Figure 5 displays the change of Imax, Imin, Iave, and fosc with magnetic field intensity. We can see that the magnetic field also exhibited a great influence on the oscillation. The oscillation amplitude decreased from 4.6 to 1.8 A when the magnetic field increased from 150 to 300 Gs and increased from 1.8 to 4.3 A when the magnetic field increased from 300 to 450 Gs. The oscillation frequency decreased from 17 to 10 kHz.
FIGURE 5
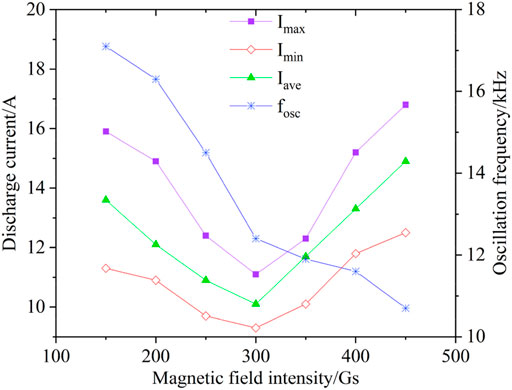
FIGURE 5. Simulated oscillation amplitude and frequency of discharge current with different magnetic field intensities.
Figures 6A–C show the time-averaged two-dimensional distributions of the plasma potential, density, and ionization rate during 1,000 steps (almost 1/5 of the oscillation period), respectively. As shown in Figure 6A, the ionization region is located at one to two normalized distances from the anode. Figure 6B indicates that the largest plasma density is 2 × 1012cm−3 and 0.6 normalized distance upstream of the thruster exit. Figure 6C illustrates that the potential drop occurs mainly in the ionization region, where the magnetic field is strong and the electron conductivity is low. The strength of the electric field must be high to compensate for the low electron conductivity, and to guarantee the continuity of the discharge current.
FIGURE 6
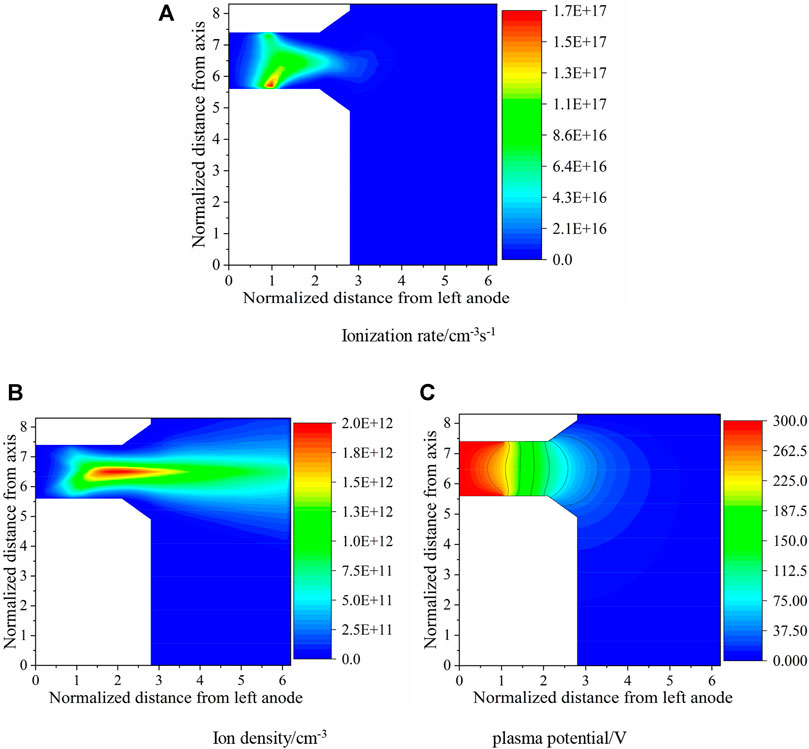
FIGURE 6. Two-dimensional distributions of the plasma characteristics. (A) Ionization rate/cm−3s−1. (B) Ion density/cm−3 (C) plasma potential/V.
Thruster Performance
Performance experiments (Figure 7) with different discharge voltages and propellant mass flow rates of LHT-140 were conducted in a large vacuum chamber TS-7 with a diameter and a length of 3.8 and 8.5 m, respectively. The pumping speed of TS-7 can reach 1.8 × 10⁵ L per second, providing a background pressure of around 2.0 × 10⁻³ Pa during testing. The discharge voltage ranged from 300 to 900 V, and the propellant mass flow rate which was regulated by a flowmeter ranged from 10 to 15 mg/s, while the magnetic field remained unchanged.
FIGURE 7

FIGURE 7. Performance test of LHT-140.
Thrust was measured by a laser interferometer (showed in Figure 7) through the relationship between thrust and displacement. Thrust measurements were conducted in intervals of about 40 min to minimize the thermal drift. Considering the thermal drift and repeatability, the average variation in thrust for a given point was estimated to be about ±2%. Given the uncertainty of the thrust, mass flow rate, current and voltage, the uncertainty for efficiency was about ±3.1%.
The simulated results of the total, acceleration, utilization, and energy conversion efficiencies are shown in Figure 8 The total efficiency initially increased with the discharge voltage, reached the maximum at 600 V, and then declined. Blateau’s simulation study (Vincent et al., 2001) showed that the magnetic field and discharge voltage require a reasonable match. After the discharge voltage increased to a certain value, the magnetic field must increase as well. However, Figure 8 shows that the magnetic field remained unchanged. After the discharge voltage increased to 600 V, the magnetic field was not large enough to constrain the electrons, which indicated that the electrons were absorbed by the anode before the ionization collisions with the propellant atoms. Thus, the total efficiency declined after the discharge voltage increased to 600 V. The acceleration efficiency is insensitive to the change in discharge voltage, and remains at 77%. A similar relationship is found in experiments (Ashkenazy et al., 1998) for a hall thruster with a diameter of 70 mm. Moreover, with the increasing discharge voltage, the ionization of propellant atoms becomes increasingly adequate, thereby increasing the utilization efficiency. Once the magnetic field is no longer large enough to constrain the electrons, the utilization efficiency starts to decline.
FIGURE 8
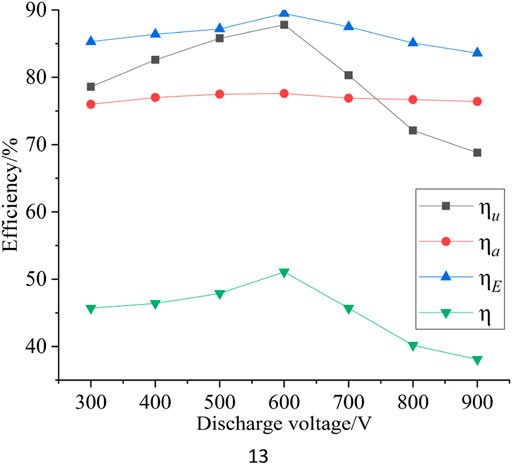
FIGURE 8. Simulated results of efficiency for different discharge voltages.
Figure 9 shows a comparison of the experimental and simulated results of total efficiency when the discharge voltage ranged from 300 to 900 V and the propellant mass flow rate was 10 mg/s. The tested maximum value is 58%, and the simulated maximum value is 51%. When the discharge voltage increased from 300 to 600 V,
FIGURE 9
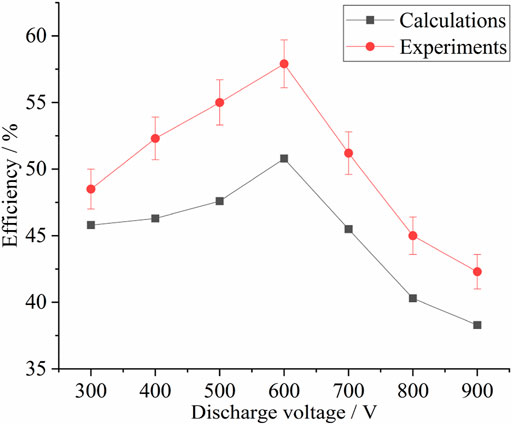
FIGURE 9. Comparison of simulated and experimental results of total efficiency for different discharge voltages.
Figure 10 shows a comparison of the experimental and simulated results of thrust when the discharge voltage ranged from 300 to 900 V and the propellant mass flow rate was 10 mg/s. As in the previous analysis, when the discharge voltage increased from 300 to 600 V, the ionization became increasingly adequate, the amount of produced ions increased, and the speed of the ejected ions became increasingly fast. Thus, the thrust increased with the discharge voltage. When the discharge voltage increased from 600 to 900 V, the ionization efficiency decreased dramatically and the number of produced ions decreased, but the speed of the ejected ions still increased. Thus, the thrust still increased with a slower speed. The simulated results are smaller than the experimental results by 8–14%. As mentioned earlier, the influence of background pressure in the vacuum chamber is not included.
FIGURE 10
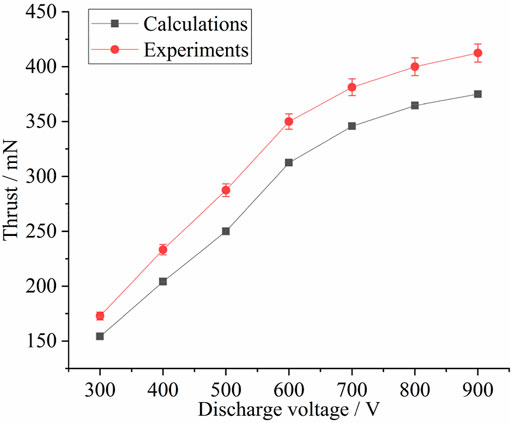
FIGURE 10. Comparison of simulated and experimental results of thrus for different discharge voltages.
Figure 11 shows the relationship between thrust and efficiency. The maximum simulated efficiency is 51.1%, and the corresponding thrust is 315 mN. The maximum experimental efficiency is 58%, and the corresponding thrust is 350 mN. The trend demonstrated that efficiency increased as thrust increased initially and then decreased as thrust increased continuously.
FIGURE 11
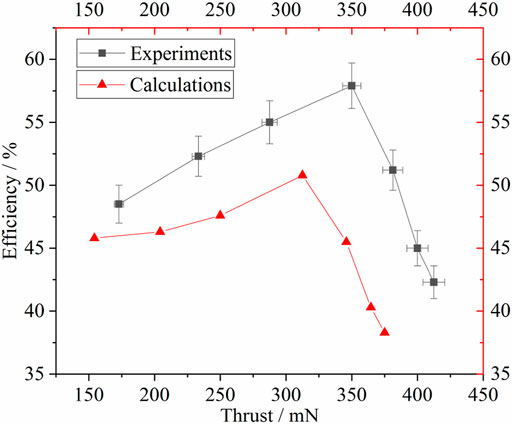
FIGURE 11. Relationship between efficiency and thrust.
Only single-charged ions Xe+ and double-charged ions Xe++ are included. Figure 12 shows the ratio of Xe+ current and Xe++ current to the total ion current when the discharge voltage ranged from 300 to 900 V and the mass flow rate is 10 mg/s. The ratio of Xe+ current decreased from 96 to 82%, while the ratio of Xe++ current increased from 4 to 18%. In accordance with the variance of propellant utilization efficiency or ionization efficiency, the ion current increased when the discharge voltage increased from 300 to 600 V and then decreased when the discharge voltage increased from 600 to 900 V. The trend of beam current, Xe+ and Xe++ fractions were similar to that in reference (Vincent et al., 2001; Vincent, 2002), in which, the Xe++ fraction increased from 20.2 to 30.3% when the discharge voltage ranged from 300 to 1200 V, and the beam current increased at first, then started to decrease.
FIGURE 12
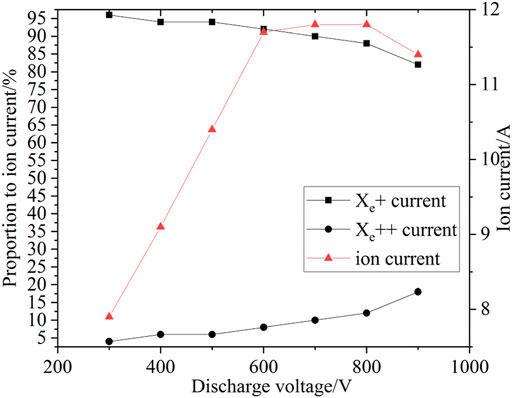
FIGURE 12. Proportion of xe+ and xe++ current to the total ion current for various discharge voltages.
The frequency of ionization collisions increased with the increase in the propellant mass flow rate. Consequently, the utilization or ionization efficiency increased as well, as shown in Figure 13.
FIGURE 13
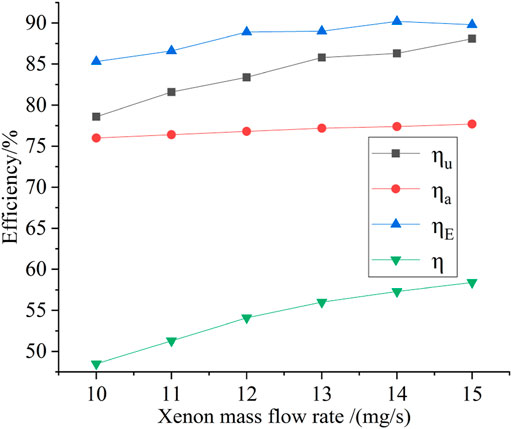
FIGURE 13. Simulated results of efficiency for different mass flow rate.
Conclusion
The discharge process of the plasma, including transient and steady-state oscillations, is well reproduced. During transient oscillation, the discharge current increases rapidly to a value that is far larger than the steady-state value. These characteristics must be considered when designing the power processing unit. During steady-state oscillation, the discharge amplitude increased first and then decreased as the discharge voltage increased, while it decreased first and then increased as the magnetic field became stronger. The performance of LHT-140 was well predicted by the built model with a deviation of less than 15% compared with the experimental results, while the deviation was mainly caused by the background pressure of the vacuum chamber. Both discharge voltage and propellant mass flow rate have a great influence on the performance of the thruster. The trend of the total efficiency was consistent with either the propellant utilization efficiency or the ionization efficiency. As the discharge voltage increased, the thrust became larger and the specific impulse became higher, but the efficiency of the thruster decreased. The research results of this paper is helpful to determine a reasonable range of discharge voltage. This paper is helpful for the optimization of the performance and selection of ideal operating points for the LHT-140 hall thruster.
Data Availability Statement
The original contributions presented in the study are included in the article/Supplementary Material, further inquiries can be directed to the corresponding author.
Funding
This work was supported by the Central Universities Basic Service Fee (1001450232).
Author Contributions
PW and TW help to design and do the experiment.
Conflict of Interest
The authors declare that the research was conducted in the absence of any commercial or financial relationships that could be construed as a potential conflict of interest.
Publisher’s Note
All claims expressed in this article are solely those of the authors and do not necessarily represent those of their affiliated organizations, or those of the publisher, the editors and the reviewers. Any product that may be evaluated in this article, or claim that may be made by its manufacturer, is not guaranteed or endorsed by the publisher.
References
Adam, J. C., Héron, A., and Laval, G. (2004). Study of Stationary Plasma Thrusters Using Two-Dimensional Fully Kinetic Simulations. Phys. Plasmas 11, 295–305. doi:10.1063/1.1632904
Arkhipov, A. S., and Bishaev, A. M. (2007). Three-dimensional Numerical Simulation of the Plasma Plume from a Stationary Plasma Thruster. Comput. Math. Math. Phys. 47, 472–486. doi:10.1134/s0965542507030116
Ashkenazy, J., Raitses, Y., and Appelbaum, G. (1998). Parametric Studies of the Hall Current Plasma Thruster. Phys. Plasmas 5, 2055–2063. doi:10.1063/1.872877
Birdsall, C. K., and Langdon, A. B. (1991). Plasma Physics via Computer Simulation. Philadelphia: Institute of Physics Publishing.
Boeuf, J. P., and Garrigues, L. (1998). Low Frequency Oscillations in a Stationary Plasma Thruster. J. Appl. Phys. 84, 3541–3554. doi:10.1063/1.368529
Cho, S., Komurasaki, K., and Arakawa, Y. (2013). Kinetic Particle Simulation of Discharge and wall Erosion of a Hall Thruster. Phys. Plasmas 20, 063501. doi:10.1063/1.4810798
Hirakawa, M., and Arakawa, Y. (1996), “Numerical Simulation of Plasma Particle Behavior in a Hall Thruster,” AIAA Paper No. 1996-3195. doi:10.2514/6.1996-3195
Fife, J., Martinez-Sanchez, M., and Szabo, J. (1997), “A Numerical Study of Low-Frequency Discharge Oscillation in Hall Thrusters,” AIAA Paper No. 1997-3051, In 33rd Joint Propulsion Conference and Exhibit. doi:10.2514/6.1997-3052
Koo, J. W., and Boyd, I. D. (2006). Modeling of Anomalous Electron Mobility in Hall Thrusters. Phys. Plasmas 13, 033501. doi:10.1063/1.2172191
Mathers, Alex., de Grys, Kristi., and Paisley, Jonathan. (2009). Performance Variation in BPT-4000 Hall Thrusters. IEPC 09-144.
Noguchi, R., Martinez-Sanchez, M., and Ahedo, E. (1999). Linear 1-D Analysis of Oscillations in Hall Thrusters. IEPC 99-105.
Pidgeon, D. J. (2006), “Two Years On-Orbit Performance of the SPT-100 Electric Propulsion,” AIAA Paper No. 2006-5353. doi:10.2514/6.2006-5353
Hofer, R. R., “Efficacy of Electron Mobility Models in Hybrid-PIC Hall Thruster Simulations,” AIAA Paper No. 2008-4924, 2008. doi:10.2514/6.2008-4924
Hofer, R. R., Mikellides, I. G., Katz, Ira., and Goebel, D., “Wall Sheath and Electron Mobility Modeling in Hybrid-PIC Hall Thruster Simulations,” AIAA Paper No. 2007-5267, 2007. doi:10.2514/6.2007-5267
Vincent, Blateau., Martinez-Sanchez, Manuel., Batishchev, Oleg., and Szabo, James. (2001). PIC Simulation of High Specific Impulse Hall Thruster. IEPC 01-037.
Zhang, F., Ding, Y., Li, H., Wu, X., and Yu, D. (2011). Effect of Anisotropy of Electron Velocity Distribution Function on Dynamic Characteristics of Sheath in Hall Thrusters. Phys. Plasmas 18, 103512. doi:10.1063/1.3654052
Zhang, F., Kong, L., Li, C., Yang, H., and Li, W. (2014). Sheath Oscillation Characteristics and Effect on Near-wall Conduction in a Krypton Hall Thruster. Phys. Plasmas 21, 113501. doi:10.1063/1.4900764
Nomenclature
Mreal real mass of Xe
Mcomp computational mass of Xe
Keywords: hall thruster, plasma optics device, particle-in-cell, performance simulation, plasma oscillation
Citation: Yang L, Wang PY and Wang T (2021) Performance Simulation of a 5 kW hall Thruster. Front. Mater. 8:754479. doi: 10.3389/fmats.2021.754479
Received: 06 August 2021; Accepted: 22 September 2021;
Published: 16 November 2021.
Edited by:
Shifa Wang, Chongqing Three Gorges University, ChinaReviewed by:
Yanan Wang, Xi’an Jiaotong University, ChinaJianfei Long, University of South China, China
Xianggeng Wei, Northwestern Polytechnical University, China
Xinfeng Sun, Lanzhou institute of physics (LIP), China
Copyright © 2021 Yang, Wang and Wang. This is an open-access article distributed under the terms of the Creative Commons Attribution License (CC BY). The use, distribution or reproduction in other forums is permitted, provided the original author(s) and the copyright owner(s) are credited and that the original publication in this journal is cited, in accordance with accepted academic practice. No use, distribution or reproduction is permitted which does not comply with these terms.
*Correspondence: L. Yang, yangle_23737@sina.com