 Evangelos Koliolios
 Daniel G. Mills
 James J. C. Busfield
 Wei Tan
94% of researchers rate our articles as excellent or good
Learn more about the work of our research integrity team to safeguard the quality of each article we publish.
Find out more
ORIGINAL RESEARCH article
Front. Mater. , 21 October 2021
Sec. Polymeric and Composite Materials
Volume 8 - 2021 | https://doi.org/10.3389/fmats.2021.741541
This article is part of the Research Topic Carbon Nanomaterial Filled Polymer Composites for Functional Applications: Processing, Structure, and Property Relationship View all 13 articles
The high surface area, electrical and mechanical properties of carbon nanotube (CNT) composites has rendered them promising candidates for structural power composites. Nevertheless, it is important to understand their mechanical behaviour before they are applied in energy storage devices amid the safety concerns. This work explores the nail penetration behaviours of supercapacitor specimens consisting of CNT electrodes and pseudocapacitor specimens with carbon nanotube-polyaniline (CNT/PANI) electrodes. Specimens with and without electrolyte were tested. The dry cells without electrolyte follow a power law behaviour, while the wet cells with the electrolyte exhibit a piece-wise nonlinear relationship. The force, voltage and temperature of the supercapacitor were recorded during the nail penetration test. No temperature change or overheating was observed after short-circuit. Moreover, electrochemical testing is performed before and after the specimen penetration. The cyclic voltammetry shows the dramatic loss of capacitance, changing the cell behaviour from capacitor to resistor-like manner. Johnson-Cook model was used to predict the nail penetration behaviour. The coefficients of Johnson-Cook model are calibrated from the experimental load-displacement curves. The finite element model predictions are in a good agreement with the experimental results.
Battery perforation and internal short circuiting is likely to occur in the event of a collision involving electric vehicles or hybrid vehicles. Nail penetration testing is one of the widely-used methods to evaluate the damage tolerance, internal short circuit behaviour and fire safety of lithium ion batteries. As the energy density of supercapacitors increases and their use becomes more widespread, understanding their failure behavior is also critical to aid the proliferation of their use in efficient, low emission vehicles.
Regarding the safety standards of commercial supercapacitors, a review was conducted by Walden et al. (2011) where nail penetration and overcharging for devices with supercapacitors were suggested as potential safety tests, which are similar to the tests conducted for commercial lithium-ion batteries. Currently there are specific IEC (International Electrochemical Commission) standards that commercial supercapacitors need to follow depending on their application such as IEC 62576 IEC (2018), which relates to the application of supercapacitors on hybrid electric vehicles. Nevertheless, the current IEC standards for supercapacitors do not include any mechanical testing standards. In this study nail penetration testing was selected to be conducted as extreme failure of the specimen can be observed and the risk created by such an experiment can be evaluated accordingly.
This investigation draws inspiration from Tan et al. (2021), where the electrochemical properties of a CNT/PANI specimen are discussed. However, the CNT/PANI supercapacitor mechanical properties must also be assessed to ensure that there are no hazards if such a specimen is used in industrial applications, such as regenerative braking. Nevertheless, there is a gap of scientific investigations, regarding the mechanical abuse testing of supercapacitors. Qiu et al. (2019) and Qiu et al. (2020) have performed bending tests on alkaline supercapacitors and on a supercapacitor whose electrolyte is based on biomass respectively, to observe how bending affects the charging and discharging on the device. However mechanical abuse tests that lead to failure of the specimen have not been addressed. Therefore the methodology followed is similar to that of pouch battery mechanical abuse testing, where an extensive literature is available. The study of Sahraei et al. (2012) and Greve and Fehrenbach (2012) provide a basis on the approach of both experimental testing and modelling of mechanical abuse in batteries. The modelling procedure involves assuming a homogenized specimen, and using either power law or piece-wise functions to approximate the experimental behaviour of the battery jellyroll, which is similar to the methodology carried out during the modelling of the supercapacitor.
Additionally, a more in depth analysis on general indentation has also been performed by Sahraei et al. (2014), where the effect of different indentor shapes is highlighted. Different indentor shapes can be further used to not only evaluate the durability of the specimen but to also validate the mechanical model of the supercapacitor. In this investigation however, only a nail indentor was used to penetrate the cell, while observing not only mechanical but also electrochemical and thermal behaviour of the specimen. This is similar to the approach of Zhang et al. (2015b), where quasi-static indentation is performed and multiphysical parameters are observed. However multiphysical modelling will involve future work for this investigation as it involves further experimentation and understanding of the short-circuit mechanisms.
The scope of this study is to therefore investigate the behaviour of both a CNT and a CNT/PANI supercapacitor under nail penetration, which involves the mechanical, electrical and thermal behaviour during puncture and the mechanical modelling of the nail penetration process. It aims to fill in the gap on mechanical abuse testing of supercapacitor and pave the road for further experimental and numerical investigations on similar specimens. Additionally, this investigation aims to highlight the durability of CNT electrodes, compared to traditional active carbon electrodes. This study also evaluates the safety of the specimen after puncture and to observe whether the specimen can still store electrical energy after failure.
The CNT mats used in this study were supplied by Tortech Nano Fibers Ltd. These CNT mats were manufactured by a floating-catalyst chemical vapour deposition (FCCVD) process. Then CNT mat samples of width 50 mm, length 60 mm and 50 μm thickness were used as the electrode materials. Three-electrode electrodeposition system was used to coat the PANI materials on the CNT mats. The detail of electrodeposition procedure can be found in Tan et al. (2021). In brief, the CNT mat and a platinum mesh were used as the working electrode and the counter electrode respectively, while a saturated calomel electrode was employed as a reference electrode. The electrodeposition solution is made of 1 M sulphuirc acid and 0.05 M aniline. A constant current of 1 mA/1 cm2 was applied on the CNT mat samples to deposit PANI. Detailed microstructures can be found in the SEM images presented in Tan et al. (2021).
The samples presented in Figure 1, were tested using an INSTRON 5967 with a 1 kN load cell held with the sample stage presented in Figures 2, 3 under displacement control and atmospheric conditions. The indentation tip shown in Figure 4 was lowered onto the sample prior to testing until the load cell read a positive load, all the testing took place at a displacement rate of 0.8 mm/min. In order to perform the penetration testing on the supercapacitor samples and its constituent parts a sample stage was designed and fabricated. Commercial products are available for puncture testing, however this investigation specifically required for the cells to lie horizontally flat during testing to evenly distribute the electrolyte throughout. To allow for the nail to pass completely through the samples unobstructed and to collect any harmful H2SO4 electrolyte that may spill out during testing, the sample stage was elevated with the use of a cup. The samples needed to be secured with enough pressure that they would not be drawn out during penetration testing and so a top pressure plate with four 5 mm bolts, (one in each corner) was used to fix the samples in place. There is also a need to ensure that the nail would repeatedly make contact at exactly the centre of the exposed part of the sample during each test repeat, this required an aligner to centre the sample stage in the INSTRON machine. This was not a structural part and so could be manufactured via additive manufacturing out of PLA while the cup, base plate and pressure plate were machined from aluminum, the CAD model of the sample testing apparatus can be seen in Figure 2. Three penetration tests were performed on a pseudocapacitor cell for which the CNT electrode had been electrodeposited with PANI, a test was performed on an identical cell without the PANI for comparison. Images of the failed specimen and the experimental setup can be observed in Figure 5. The direct spun CNT mat consists of multi-walled carbon nanotubes. The mat has a nominal thickness of 60 μm and an areal mat density of 0.0234 kg/m2, and the volumetric mat density is 390 kg/m3. The direct-spun mat has a 6 wt% of Fe content, using a thermo-gravimetric analyser. A bundle density of 1560 kg/m3 was determined by helium pycnometry (Tan et al., 2019; Stallard et al., 2018). The diameters of individual carbon nanotube bundles range from 30 to 100 nm, confirmed by SEM and TEM images (Tan et al., 2021). The measurements of the individual CNTs within the CNT mats have shown a length up to 1 mm (Koziol et al., 2007). Penetration tests were also performed on dry cells that had no electrolyte to assess if prolonged exposure to 1 M H2SO4 electrolyte had an effect on the mechanical properties of the cells.
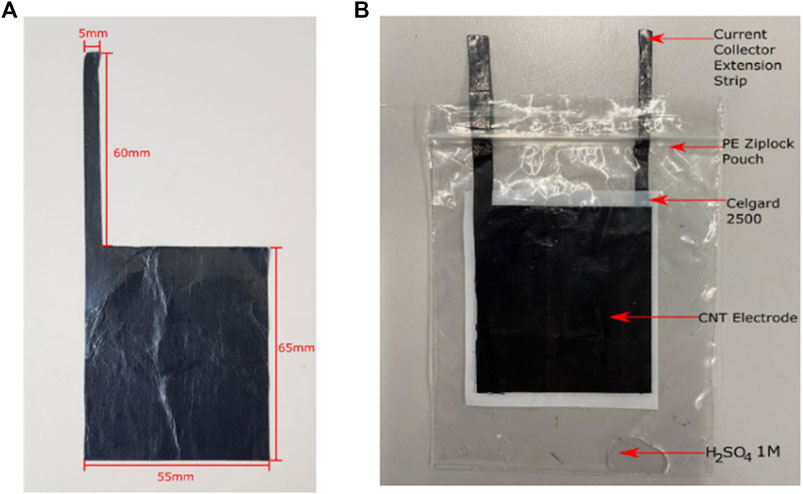
FIGURE 1. (A) Electrode Dimensions and (B) Supercapacitor Specimen Configuration.
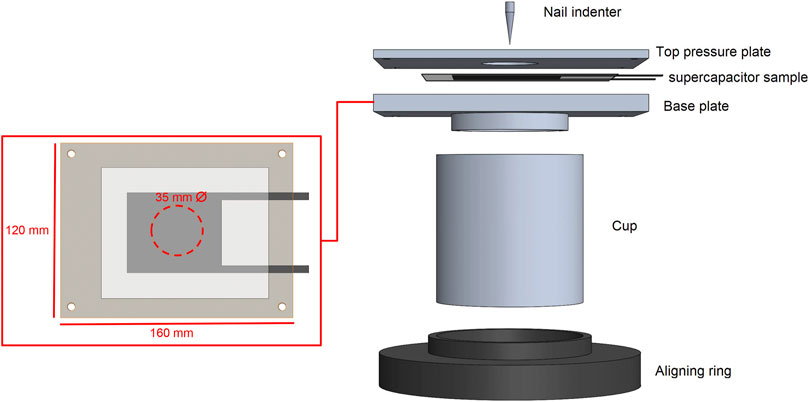
FIGURE 2. Base plate dimensions and the effective area of unsupported specimen and CAD model of the bespoke nail penetration test rig.
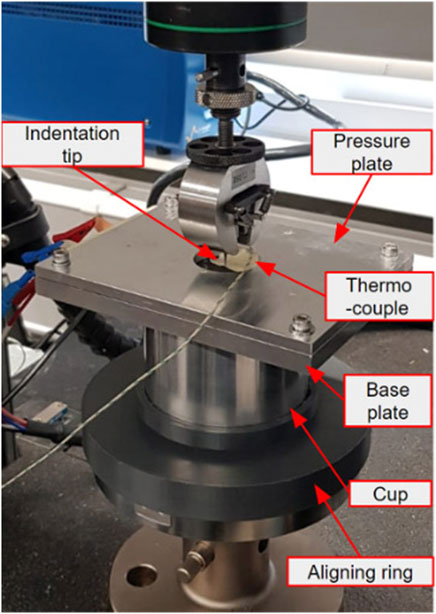
FIGURE 3. Annotated picture of the nail penetration testing set up.
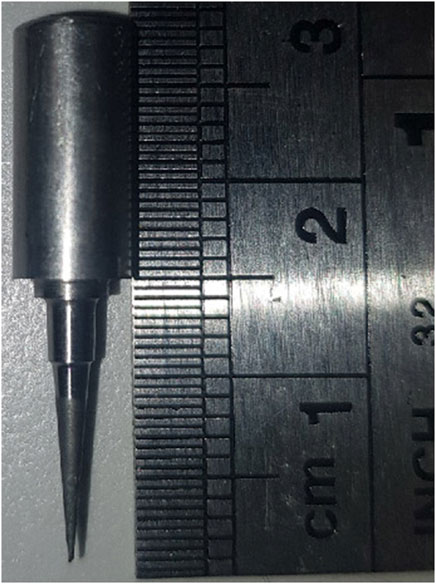
FIGURE 4. Conical indentation tip with an internal angle of 9.5o and a tip radius of 250 μm.
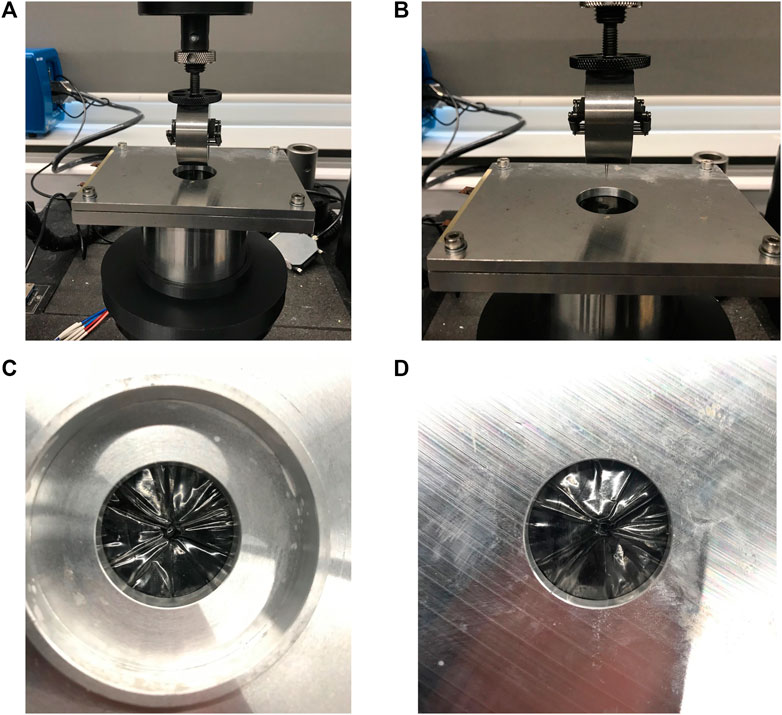
FIGURE 5. Test setup (A) before and (B) after nail penetration. (C) The penetrated specimen from the top view (D) from the bottom view.
Cyclic voltammetry can be used to analyse qualitative details of electrochemical processes under different conditions such as the presence of intermediates in oxidation reduction reactions and the reversibility of reactions. CV can also be used to evaluate the stoichiometry of the device, the diffusion coefficient of the chemical constituents, the capacitance and the cycle life of the capacitor (Gamry, 2012). Capacitors can only work inside the voltage window of both the upper and lower voltage limits where the voltages outside the window can cause the system to be damaged by electrolyte decomposition. Although aqueous electrolytes such as the diluted sulphuric acid solution are usually safer and simpler to use, non-aqueous electrolyte capacitors may have a much larger voltage window (Gamry, 2012). To test the upper and lower voltage limits, we use the cyclic voltammetry. This is a procedure that plots the current flowing through the electrochemical cell and voltage is varied between a set voltage range, this is also called a linear voltage ramp. A CV test often sweeps the voltage between the two limit potentials repetitively in opposite directions resulting in a complete cycle.
Mathematical models are of utmost importance when trying to approximate the behaviour of a specimen. As mentioned in the previous section, the EDLC and PANI pesudocapacitor exhibit a hardening behaviour under nail penetration/indentation. This hardening behaviour is similar to the one observed in the battery jellyroll and that it follows the power law as discussed by Greve and Fehrenbach (2012) and the power law is of the form:
where σ is stress, ϵ is strain and A, B and n are constants. The physical meaning of A is yield strength, B and n are constants that predict the hardening behaviour of the specimen according to the Johnson-Cook plastic behaviour (Johnson and Cook, 1983). A is the initial yield strength of the material at a quasi-static strain rate, B and n represents the flow stress on strain hardening behavior at quasi-static strain rate (Johnson and Cook, 1983; Nam et al., 2014). The approach of investigations studying the hardening behaviour of energy storage devices, like batteries in the case of Xu et al. (2016), is to obtain the power curve constants through experiments, as the equation is purely empirical. Therefore for the region before fracture for the Dry Cell 1 experiment and the PANI-1 experiment (Figure 6), a best-fit power law curve code was generated with Python. In order to obtain the Nominal Stress vs Nominal Strain data however, the force was divided by the tip surface area approximated equal to Atip=7.069 × 10⁻⁴mm2, assuming that the area at the tip area is a flat punch with a diameter of 0.03 mm. The nominal strain was obtained by dividing the displacement with the thickness of the specimen which was 0.25 mm before indentation [similar to the approach of Xu et al. (2016)] the best fit curve, the equation of the best fit curves as well as the coefficient of determination are presented in Figure A1.
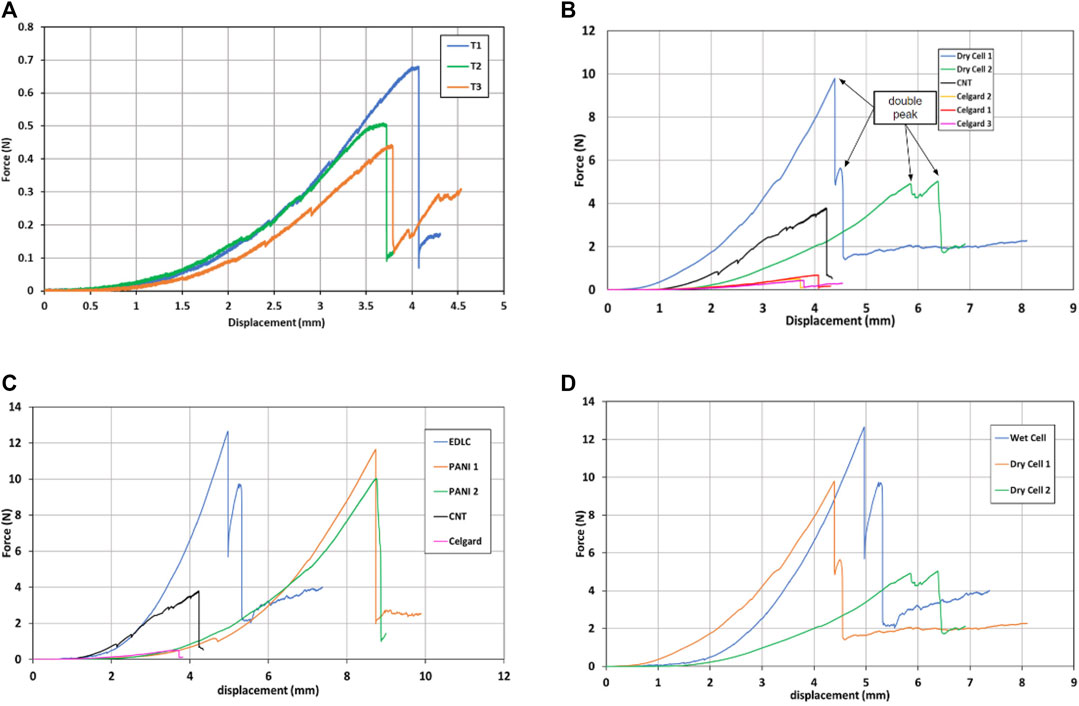
FIGURE 6. (A) Force-displacement plot for nail penetration of Celgard 2500 separator, (B) Force-displacement plot comparing behavior of Celgard 2500 separator, a dry EDLC cell and a single CNT electrode, (C) Force-displacement plot comparing behavior of the Carbon Nanotube Mat (CNT), Celgard 2500 separator (Celgard), an electrolyte soaked EDLC cell (EDLC) and PANI-coated CNT pseudocapacitor electrode cells (PANI 1 and PANI 2), (D) Force-displacement plot comparing behavior of dry and wet electrolyte soaked cells.
A sample of experimental data were plotted, as this improved the clarity of the best fit curve, however all the data were used for the optimisation process of the best fit line performed by Python. The EDLC hardening behaviour follows the hardening law perfectly, with a nearly ideal coefficient of determination value of r2 = 0.9998. The PANI hardening behaviour however, does not abide exactly by the power law, as the constant A is negative and this is not a physically possible value for yield strength. Other similar investigations such as Sahraei et al. (2012), Lai et al. (2014) and Zhang et al. (2015a), observed that the behaviour of the components and thus of a homogenized wet bare cell attains piece-wise behaviour, therefore this approach should be followed for the PANI-1 experiment. The behaviour of a wet bare cell was assumed non-linear before plasticity and linear after plasticity was reached. The piece-wise relationship between stress and strain are presented below (Sahraei et al., 2012; Lai et al., 2014; Zhang et al., 2015a):
Where Emax is the maximum Young’s Modulus Value, ϵp is the plastic strain and c is a fitting parameter. By applying the above function and fitting it to the experimental data of PANI 1 and wet EDLC 1, which also does not abide the power law curve, are presented in Figure A2 and the coefficients in Table 1 respectively. By using the piece-wise equation, the coefficient of determination becomes more idealised, which will result in a better simulated value. The wet cells therefore, follow a different behaviour under indentation, due to an electrolyte being contained inside the PE pouch which fills the pores of the electrodes and the separator. In order to provide a better approximation of the difference between the behaviour CNT and PANI approximations, the values of constants for the dry CNT specimen that will be used during modelling are given as follows A = 5.737 MPa, B = 25.245 MPa and n = 2.20.
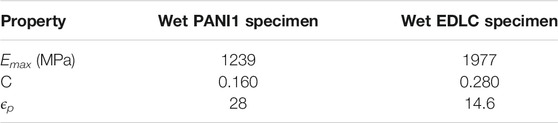
TABLE 1. Optimised Piece-wise model constants.
During indentation, the maximum Modulus achieved by the wet CNT EDLC is significantly larger than that achieved by PANI, and therefore the coating CNT with PANI results in a less stiff specimen, which also fails at larger nominal strain values. The value of the constant c, is a measure of how fast the modulus increases with strain, a smaller value of c indicates a larger increase in modulus over strain Zhang et al. (2015a), and in this case even though the wet PANI specimen has a smaller modulus, it increases at a greater rate over strain. It is also important to comment that the coefficient of variation value is closer to r2 = 1 for PANI and therefore the approximation can be more accurate. Finally, the parameters of the piece-wise formula can be integrated into ABAQUS and construct a subroutine to create a model which gives appropriate results, even for wet cells which is extremely important as these cells will experience indentation in service. At this point it must also be noted that several experiments were conducted and using the values of constants generated from one experiment will not provide a complete image of the nail indentation. The simulation procedure is greatly affected by the results being non-repeatable, as different critical values are observed for similar specimen. Nevertheless, by conducting a greater number of experiments, the statistical significance of the modelling constants and material properties used in this article can be determined.
Regarding the puncture force of each material, the Celgard separator (Figure 6B) provided the lowest resistance to puncture with an average puncture force of 0.54 N, however unlike during tensile testing there is a relatively low scatter in displacement or strain to failure. This is likely caused by the fact that a much smaller volume of the separator is under stress during puncture testing and due to the fact that the failure of the separator is initiated by the inherent slit-like pores in the material there is less variability in the flaw sizes in the volume of material experiencing maximum stress. Moghim et al. (2020) performed puncture strength testing on Celgard 2400 a very similar separator to 2500 and found that the two different failure modes, occurred simultaneously during puncture testing as axisymmetric stress is being applied to an anisotropic material. Prior to the puncture point, the stick-slip behaviour can be clearly seen in T3 of Figure 6A where there is force relaxation and then subsequent increase, indicating the separator has yielded in the transverse direction (TD). The “saw-tooth” uneven rise in force again seen in all samples after sample failure and complete nail penetration is caused by the widening of the hole the nail has made due to its conical shape.
The same saw-tooth behaviour can be seen from the force-displacement plot for the single CNT electrode in Figure 6B, this can likely be attributed to the puncture and subsequent delamination of the various sub-layers of nonwoven CNT that make up the bulk of the CNT mat as is described by Tan et al. (2019) when discussing the hierarchical microstructure of direct-spun CNT mats. The puncture force from the CNT electrode was measured to be 3.31 N, almost an order of magnitude higher than the Celgard and so displaying much more dominant behaviour as can be seen in Figures 6B,C. The dominant CNT behaviour coupled with fluctuations in force produced by the CNT mats make it difficult to interpret the points of failure for specific cell components. However a feature noted in Figure 6B and which can also be seen in Figures 6C,D, is the “double peak” phenomenon. Each peak may be caused by the sequential failure of the top and then the bottom CNT electrode. Curiously this behaviour is only seen in samples in which pure CNT electrodes were used (labeled EDLC in the figures below), the cells that used electrodes deposited with PANI do not have a double peak when failing, possibly due to the fact that both CNT layers fail simultaneously. The reason for this behaviour in PANI deposited electrodes is unclear, possibly due to the reduction of fracture toughness in CNT/PANI electrodes in contrast to bare CNT mats.
It can also be seen in Figure 6C the cells that use pure CNT electrodes (EDLC) have a lower displacement to failure and show a higher stiffness than both the PANI coated electrode samples. Tan et al. (2021) reported the in-plane tensile mechanical properties of CNT-PANI composites electrodes. The composite has a PANI volume fraction of 8.7% Tan et al. (2021), similar to that of the CNT/PANI electrodes used in this study at 6.65%. The modulus of the CNT mat rose from 3.5 to 6 GPa. Penetration testing however applies stress in the out of plane direction that either cause some delamination or fracture of the CNT mat. Although, it is worth mentioning that another study by the same authors Tan et al. (2019) found the delamination toughness of the direct-spun CNT mats to be 5.4 J/m2 as compared to an in plane toughness of 22 kJ/m2, a difference of four orders of magnitude. Another possible explanation for the anomalous loss in stiffness may be caused by the PANI on the CNT bundles absorbing water through prolonged exposure to the aqueous H2SO4 electrolyte, weakening the entire electrode. The effects of water absorption by polymers such as nylon is well documented Reimschuessel (1978) with stiffness decreasing as water is absorbed. PANI transitions between its three oxidation states during charging and discharging, emeraldine being one of these three oxidation states and work by Casanovas et al. (2012) shows that this type of PANI is hydrophilic and irreversibly absorbs water which organise into nanodrops within the polymer network. Polymers absorbing solvents also leads to a phenomenon known as swelling in which they will expand in volume (Buckley and Berger, 1962b; Buckley and Berger, 1962a). In the case of the PANI coated CNT mat this swelling may force apart the coated nanotube bundles and weaken the entire structure of the electrode. It is feasible that the modulus of PANI being reduced by the absorption of water, in combination with the polymer swelling, can explain the reduction in stiffness, the higher displacement to failure and the lack of “double peaks” seen in the PANI coated electrode samples. However there is no literature to date investigating the effects of water absorption on the mechanical properties of PANI nor its volumetric effects.
Figure 6B highlights the different phases that the sample cells go through during indentation tests, where the force displacement curve can be split into two distinct stages. Tan et al. (2019) found the volume fraction of the CNT mat used in this study to be only 0.187 equaling a void fraction of 0.813, therefore the initial stiffening stage can be attributed to the porosity of the CNT mat decreasing with compressive loading as shown in Figure 7, similar results are described by Zhang et al. (2015a) during nail penetration testing of single lithium ion cells, attributing the stiffening to void volume reduction in the electrode material.
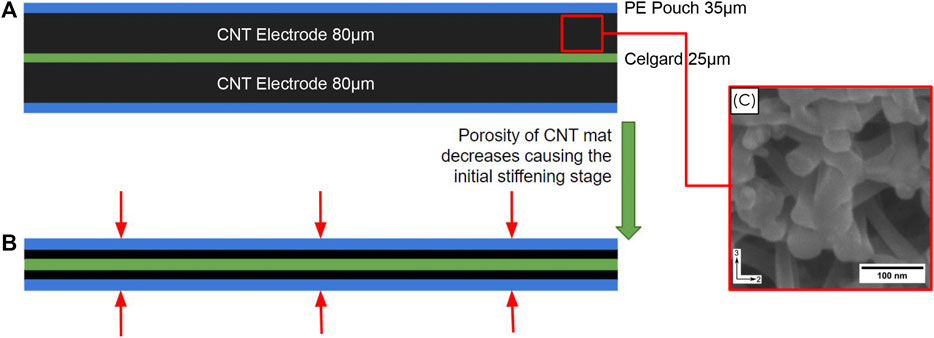
FIGURE 7. Schematic showing (A) the layer thickness of a pure CNT EDLC cell used in nail penetration testing, (B) the compression and densification of the CNT mat reducing the pore volume fraction resulting in the initial stiffening stage of the force-displacement curve and (C) an SEM image taken side on to the CNT mat showing its porosity [Tan et al. (2019)].
At first glance the stiffening behaviour of the entire force-displacement curve may look to follow a power law, however in reality the second linear stage is actually constituted of regions of different hookean behavior each with successively increasing stiffness. In the linear stage stiffening events can be seen taking place in which distinct gradient changes occur as explained in the mechanical modelling part.
To assess the effects of poroelastic interactions between the CNT mat, the separator and the electrolyte dry cells were constructed that used pure uncoated CNT mats as electrodes, the results of which can be seen in Figure 6D The most noticeable result of this test is the fact that all the samples produced a double peak upon failure, highlighting the fact that only the PANI samples lacked them. Apart from this there seems no discernible difference between the behaviour of a wet and a dry cell at the strain rates used in this test Gor et al. (2014) and Cannarella et al. (2014) tested the mechanical properties of a PP Celgard separator both dry and immersed in both water and DMC to investigate the poroelastic behaviour. They found that under compressive testing, for both dry and wet separators, stiffness increases linearly with strain rate, at lower strain rates, then the stiffening of the wet separator sharply rose becoming far more pronounced at higher strain rates, above 10−3 s−1. Under tensile loading the authors again saw stiffness increase with strain rate however saw a reduction in stiffness for separator immersed in DMC, indicating that the softening effects due to polymer solvent interactions are far more pronounced in tension than in compression.
From the results shown it is clear that CNT is far more dominant in the behavior of the supercapacitor cells compared to the Celgard separator. In Figures 6B,C the force-displacement curve for the EDLCs and CNT are closely aligned, showing similar initial stiffening and then liner stiffening.
In the force displacement curve of the PANI 2 sample in Figure 6C a small drop in force is seen after 4 mm displacement before it continues to rise again, this is likely due to the outer PE pouch being pierced by the indentation tip and then being subsequently met by the first CNT electrode. The reason for the small, but present, distance between the two is due to the fact that as force was applied by the pressure plate to affix the samples in place, the pressure inside the cell would cause the part of the cell exposed through the hole to inflate with excess electrolyte, separating the two layers.
Figure 8 depicts temperature, voltage and penetration force with respect to time, up until the point of mechanical failure. It can be seen that neither electrical nor mechanical failure has an effect on cell temperature with the observed periodic temperature fluctuations observed probably arising from the oscillation of an adjacent air conditioning unit. The lack of any rise in temperature of the cell upon failure is to be expected due to the small amount of energy stored in the cell, insufficient to cause any joule heating when the cell internally short circuits. It is well reported in the literature that when performing penetration and indentation testing of batteries, the drop in current or voltage output of the battery coincides with the sudden drop in penetration/indentation force (Zhang et al., 2015b; Sahraei et al., 2012). This is due to the fact that in the construction of a modern lithium ion cell, the electrode material has the worst mechanical properties compared to the other major components, namely the current collector, the separator and the pouch. The electrodes in batteries are not symmetrical and are either made of graphite for the anode or inorganic lithium compounds as cathode material. In both cases they are sponge, foam like materials that contribute very little to the structural properties of the batteries themselves with yield and tensile strengths of < 10 MPa Wang et al. (2018), Pan et al. (2020). Due to this the cell will fail when either the nail or indentation head has passed through or crushed the first electrode it encounters and punctures the separator allowing current to flow through one electrode to the other. In complete contrast to this, the CNT mats in the capacitor cells tested in this study have the most dominant effect over the mechanical strength of the whole cell, possessing the highest modulus, yield, tensile strength and strain to failure, and as a result during penetration testing the separator fails before the electrodes which is the reason for a drop in cell voltage is seen in Figure 8 before total mechanical failure. Upon failure of the first electrode, the nail then draws CNT fiber bundles from one electrode, through the punctured separator into the second electrode. Figure 9 shows optical microscope image of two separator samples from a failed cell, indicating CNT fiber residue left around the puncture hole. The current is drawn around the separator after structural failure of the separator as the two electrodes come in contact, a slight contact will draw the current away for the separator and towards the easiest path of current. Due to the fact that these fibers are extremely thin ( < 1 μm), in the event of a short circuit in an industrial sized cell, even with a low charge level, the current density would exceed many thousands of A/m2, causing sufficient Joule heating to cause thermal degradation and in cell that uses ionic liquids suspended in an organic volatile solvent, a combustion and thermal runaway.
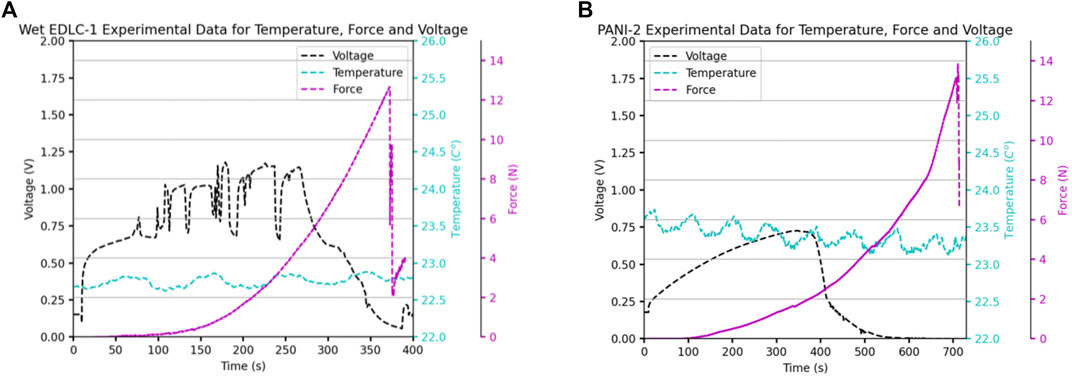
FIGURE 8. Four axis graph depicting the measured voltage, temperature and force with respect to time for the penetration test of a pure CNT EDLC and CNT/PANI sample.
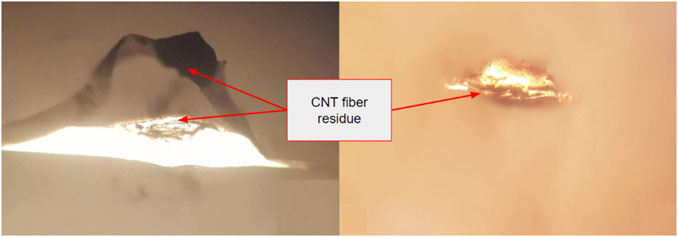
FIGURE 9. Optical microscope images of the separator from failed test cells showing CNT fiber residue on the puncture hole.
The electrochemical tests were conducted for the samples before and after the nail penetration. A two-electrode system was used for the electrochemical characterisation. Cyclic voltammetry were conducted by applying a triangular voltage waveform between −0.2 and 0.8 V. The indentation clamping grip is cleaned from any loose electrolytes as well as the nail to not transport any electrolytes to the next sample. After the nail penetration test, the sample is left in the bespoke rig to allow for excess electrolytes to leave the punctured pouch and to collect in the basin of the cup. Figure 10 shows the resulting CV curves of both EDLC and CNT/PANI pseudocapacitors before and after the nail penetration tests. The area under the CV curves indicates the capacitance of these supercapacitors. From the results shown it is clear the penetration largely affects the performance of both capacitors as the capacitor is unable to store the electrochemical energy after testing. The linear lines in Figure 10 indicate that penetrated supercapacitor essentially forms a resistor due to short circuit, as the area under curves becomes almost zero. The gradient of these linear lines gives the resistance of these resistor-like cells. The spike in the current may be due to the influence of the movement of electrolytes as it leaves the pouch and in contact with the plates. The resistance is 0.2Ω for the CNT/PANI pseudocapacitor and 0.15Ω for the EDLC supercapacitor. The CNT/PANI capacitor shows there is still some energy storage capability left due to the larger area shown in the voltammogram. The capacitor is close to complete failure like the CNT/PANI capacitor as the current is very high, any further fracture would have the same result for both supercapacitors.
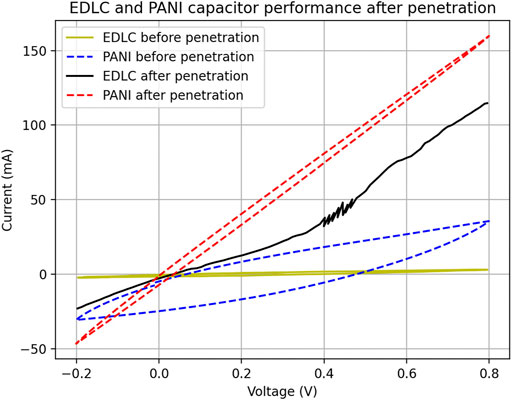
FIGURE 10. Current vs. Voltage for supercapacitors before penetration and after penetration.
For this mechanical model, the Johnson-Cook hardening model was implemented in ABAQUS explicit. The supercapacitor was treated as homogeneous, in order to reduce computation time and complexity. Far-field encastre boundary conditions on the specimen are assumed to sufficiently to simulate the effect of the holders. Additionally, biased mesh was used where mesh becomes finer towards the center of the specimen to smooth the contact with the indentor. It was also ensured that at least 4 elements were in initial contact with the indentor since indentation contact is highly mesh dependent. The friction also assumes the value of a minimal coefficient of 0.1 as a study of friction between the indentor and the supercapacitor specimens are beyond the scope of this article.
Since the specimen is treated as homogeneous, different material properties are also assumed, a process which involved a large amount of trial and error calibration, as testing was not possible at this time. Initially, the Johnson-Cook parameters of the supercapacitor were obtained by performing power law curve fitting. All the values of constants that were not included in the discussion were assumed to be equal to zero, as this is not a temperature and strain-rate dependent model. The indentor velocity used was the same as the experiment and equal to 0.8 mm/min and this is equivalent to a strain rate of 3.2min−1 experienced by the specimen. The homogenised specimen will initially be modelled as isotropic as it will require further testing to obtain material parameters for each loading direction. The Young’s Modulus and Poisson’s ratio values that are used in this model are E = 500 MPa and ν = 0.3. Several values of the Poisson’s ratio were tested for this specimen to determine its sensitivity on the load-displacement behaviours, as shown in Figure 11.
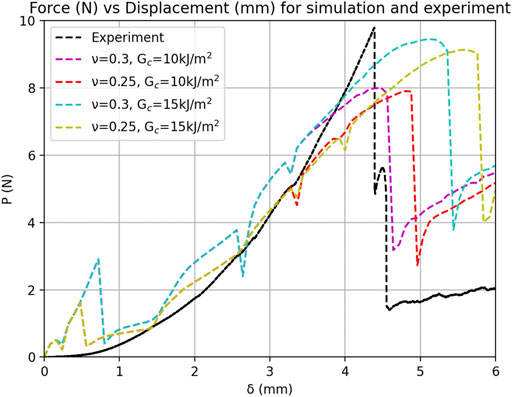
FIGURE 11. Experimental vs. Calibrated Simulated results for Dry EDLC for different Poisson’s Ratio and Fracture Energy values, with incorporated fracture effect.
Results shows the Johnson-Cook model captures the hardening behaviour, however exhibiting certain fluctuations due to the nature of a contact problem. The effect of Poisson’s ratio on the predicted load-displacement response is minor. The prediction with Poisson’s ratio of ν = 0.3, has a larger peak at the start of indentation and overestimates the force, but it is more accurate at higher displacements. The peak that is initially observed during the start of the indentation can be accounted to numerical error. This is due to the computations that occur at the start of the contact, creating a large force when the indentor first comes into contact with the specimen, however this can be potentially resolved by reducing the time step of calculation or by increasing the mesh density. Overall, the hardening curve is approximated with a good accuracy, and the simulations can further increase in accuracy by refining the mesh. Also, the model includes the fracture behaviour observed by the specimen during the experiment. The fracture is modelled as ductile damage and the damage evolution is defined as fracture energy with linear softening and multiplicative degradation criterion. Linear softening is not accurate in this case as fracture is similar to brittle fracture, but it could be effectively used to simulate the model in this case. The predicted load-displacement curves with different fracture toughness Gc values are presented in Figure 11. It is distinguishable that the sharp peak attained before fracture is not replicated by the model. The ν = 0.3 simulations appear to be more accurate in the approximation of the displacement at which failure occurs. The ν = 0.25 simulation appears to attain a steeper peak at failure, however it does not accurately predict the displacement at failure nor the double peak that is observed in the experiment. Incorporating a higher fracture energy increases the area under the curve of the force-displacement graph, resulting in higher force at failure, but smaller displacements at failure and less steep peaks. This implies that further calibration of both fracture energy and strain at fracture could potentially provide a higher accuracy in both force at failure and displacement at failure. Another approach would be introducing a different damage model which could both capture the steep peak and capture exactly the displacement.
In order to observe the differences between experimental and simulated fracture, Figure 12 are presented. The experimental fracture in Figure 12D, is similar to Figure 12C, as both show the deformation around the fracture hole. This behaviour is modelled by Johnson-Cook Plasticity in the case of the simulation, which creates similar deformation as the experiment, where the resultant punctured specimen exhibits a well-like geometry as the deformed elements do not recover. Observing the bottom view image, the plastic deformation of the elements is also evident around the puncture hole. The above observation indicates that the simulation is effective at replicating similar puncture behaviour and deformation behaviour as in the experiment, even though the specimen is homogenized.
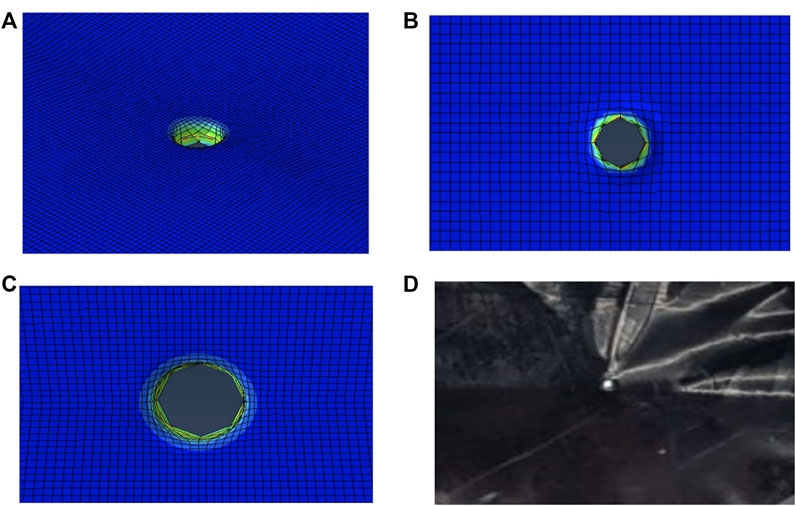
FIGURE 12. Simulated fracture from (A) Perspective view (B) Bottom View (C) Top view compared to (D) sample after nail penetration.
At this point it is important to comment that, the behaviour of the dry EDLC, provided the challenges in modelling it, is accurately approximated. A larger number of elements and more experimental measurements could further help to refine the simulation and increase confidence in the model under compression and indentation loading.
To summarise the main findings of this investigation, this study discusses the different penetration behaviours observed between CNT/PANI supercapacitors and pure CNT supercapacitors. Additionally it also investigates the difference in the behaviour of dry and wet supercapacitors and how models can be effectively employed to simulate the nail penetration of a specimen. A Johnson-Cook model captures the behaviour of pure CNT supercapacitors under nail penetration with an excellent accuracy. Finally, the electrochemical testing of both CNT/PANI and pure CNT specimens after nail penetration indicates that there is a short-circuit and as a result the punctured specimen cannot store energy and act as resistors. Nevertheless, the penetration testing of the supercapacitor cells in this study were much safer with no noticeable temperature change, due to the low energy storage and the absence of flammable materials.
This study opens up a clear avenue for future investigation, such as investigating the solvent induced swell behaviour of PANI both in terms of mechanical and volumetric effects. Our study suggests that stronger and tougher separators should be used to improve the crashworthiness of supercapacitors. Additionally, the supercapacitor could also be model as heterogeneous, which could potentially allow the model to capture more failure behaviours in the experiment. Electrical modelling could be coupled with the mechanical and thermal modelling to provide a complete simulation on the supercapacitor Zhang et al. (2015a). Further investigation would also involve including a larger amount of supercacitors stacked together, which will be similar to a real world application.
The original contributions presented in the study are included in the article/Supplementary Material, further inquiries can be directed to the corresponding author.
EK: Conceptualisation, methodology, software, verification, investigation, writing–original draft, writing–review and editing, visualization, software. DM: Conceptualisation, writing-review and editing, software, formal analysis, investigation, visualization. JB: Conceptualisation, Investigation, methodology, writing–review and editing. WT: Conceptualisation, writing–review and editing, supervision, project administration, funding acquisition, resources, methodology, validation.
WT acknowledges financial support from the EPSRC (grant EP/V049259/1) and European Commission Graphene Flagship Core Project 3 (GrapheneCore3) under grant No. 881603.
The authors declare that the research was conducted in the absence of any commercial or financial relationships that could be construed as a potential conflict of interest.
All claims expressed in this article are solely those of the authors and do not necessarily represent those of their affiliated organizations, or those of the publisher, the editors and the reviewers. Any product that may be evaluated in this article, or claim that may be made by its manufacturer, is not guaranteed or endorsed by the publisher.
The authors would like to acknowledge Erica Di Federico, for her valuable help during mechanical testing. The authors would also like to thank Dennis Ife, for his help in the design and manufacturing of the sample stage used during nail penetration testing. We also thank Tortech Nano Fibers Ltd for providing the CNT mats used in experiment.
ν, Poisson’s Ratio; σ, Stress; E, Young’s Modulus; Gc, Fracture Toughness; r, Coefficient of determination; ϵ, Strain; ϵp, Plastic Strain.
Buckley, D. J., Berger, M., and Poller, D. (1962a). The Swelling of Polymer Systems in Solvents. I. Method for Obtaining Complete Swelling-Time Curves. J. Polym. Sci. 56, 163–174. doi:10.1002/pol.1962.1205616314
Buckley, D. J., and Berger, M. (1962b). The Swelling of Polymer Systems in Solvents. Ii. Mathematics of Diffusion. J. Polym. Sci. 56, 175–188. doi:10.1002/pol.1962.1205616315
Cannarella, J., Liu, X., Leng, C. Z., Sinko, P. D., Gor, G. Y., and Arnold, C. B. (2014). Mechanical Properties of a Battery Separator under Compression and Tension. J. Electrochem. Soc. 161, F3117–F3122. doi:10.1149/2.0191411jes
Casanovas, J., Canales, M., Fabregat, G., Meneguzzi, A., and Alemán, C. (2012). Water Absorbed by Polyaniline Emeraldine Tends to Organize, Forming Nanodrops. J. Phys. Chem. B 116, 7342–7350. doi:10.1021/jp300426b
Gamry (2012). Testing Electrochemical Capacitors Part 1- Cyclic Voltammetry and Leakage Current. Part 1. Warminster, PA: Gamry Instruments inc.
Gor, G. Y., Cannarella, J., Prévost, J. H., and Arnold, C. B. (2014). A Model for the Behavior of Battery Separators in Compression at Different Strain/charge Rates. J. Electrochem. Soc. 161, F3065–F3071. doi:10.1149/2.0111411jes
Greve, L., and Fehrenbach, C. (2012). Mechanical Testing and Macro-Mechanical Finite Element Simulation of the Deformation, Fracture, and Short Circuit Initiation of Cylindrical Lithium Ion Battery Cells. J. Power Sourc. 214, 377–385. doi:10.1016/j.jpowsour.2012.04.055
IEC (2018). IEC 62576, Electric Double-Layer Capacitors for Use in Hybrid Electric Vehicles - Test Methods for Electrical Characteristics. Geneva, Switzerland: International Standard.
Johnson, G., and Cook, W. (1983). “A Constitutive Model and Data for Metals Subjected to Large Strains, High Strain Rates, and High Temperatures,” in Proceedings 7th International Symposium on Ballistics, the Hague, April 19-21, 1983 541–547.
Koziol, K., Vilatela, J., Moisala, A., Motta, M., Cunniff, P., Sennett, M., et al. (2007). High-performance Carbon Nanotube Fiber. Science 318, 1892–1895. doi:10.1126/science.1147635
Lai, W.-J., Ali, M. Y., and Pan, J. (2014). Mechanical Behavior of Representative Volume Elements of Lithium-Ion Battery Cells under Compressive Loading Conditions. J. Power Sourc. 245, 609–623. doi:10.1016/j.jpowsour.2013.06.134
Moghim, M. H., Nahvi Bayani, A., and Eqra, R. (2020). Strain‐rate‐dependent Mechanical Properties of Polypropylene Separator for Lithium‐ion Batteries. Polym. Int. 69, 545–551. doi:10.1002/pi.5986
Nam, H. S., Han, J. J., Kim, J. W., and Kim, J. S. (2014). Ductile Fracture Simulation for A106 gr.B Carbon Steel under High Strain Rate Loading Condition. Recent Adv. Struct. Integrity Anal. Proc. Int. Congress APCF/SIF-2014, 37–41. doi:10.1533/9780081002254.37
Pan, Z., Sedlatschek, T., and Xia, Y. (2020). Effect of State-Of-Charge and Air Exposure on Tensile Mechanical Properties of Lithium-Ion Battery Electrodes. J. Electrochem. Soc. 167, 090517. doi:10.1149/1945-7111/ab8804
Qiu, F., Huang, Y., Hu, X., Li, B., Zhang, X., Luo, C., et al. (2019). An Ecofriendly Gel Polymer Electrolyte Based on Natural Lignocellulose with Ultrahigh Electrolyte Uptake and Excellent Ionic Conductivity for Alkaline Supercapacitors. ACS Appl. Energ. Mater. 2, 6031–6042. doi:10.1021/acsaem.9b01150
Qiu, F., Huang, Y., Luo, C., Li, X., Wang, M., and Cao, H. (2020). An Acid‐Resistant Gel Polymer Electrolyte Based on Lignocellulose of Natural Biomass for Supercapacitors. Energy Technol. 8, 2000009. doi:10.1002/ente.202000009
Reimschuessel, H. K. (1978). Relationships on the Effect of Water on Glass Transition Temperature and Young's Modulus of Nylon 6. J. Polym. Sci. Polym. Chem. Ed. 16, 1229–1236. doi:10.1002/pol.1978.170160606
Sahraei, E., Hill, R., and Wierzbicki, T. (2012). Calibration and Finite Element Simulation of Pouch Lithium-Ion Batteries for Mechanical Integrity. J. Power Sourc. 201, 307–321. doi:10.1016/j.jpowsour.2011.10.094
Sahraei, E., Meier, J., and Wierzbicki, T. (2014). Characterizing and Modeling Mechanical Properties and Onset of Short Circuit for Three Types of Lithium-Ion Pouch Cells. J. Power Sourc. 247, 503–516. doi:10.1016/j.jpowsour.2013.08.056
Stallard, J. C., Tan, W., Smail, F. R., Gspann, T. S., Boies, A. M., and Fleck, N. A. (2018). The Mechanical and Electrical Properties of Direct-Spun Carbon Nanotube Mats. Extreme Mech. Lett. 21, 65–75. doi:10.1016/j.eml.2018.03.003
Tan, W., Stallard, J. C., Smail, F. R., Boies, A. M., and Fleck, N. A. (2019). The Mechanical and Electrical Properties of Direct-Spun Carbon Nanotube Mat-Epoxy Composites. Carbon 150, 489–504. doi:10.1016/j.carbon.2019.04.118
Tan, W., Stallard, J. C., Jo, C., De Volder, M. F. L., and Fleck, N. A. (2021). The Mechanical and Electrochemical Properties of Polyaniline-Coated Carbon Nanotube Mat. J. Energ. Storage 41, 102757. doi:10.1016/j.est.2021.102757
Walden, G., Stepan, J., and Mikolajczak, C. (2011). “Safety Considerations when Designing Portable Electronics with Electric Double-Layer Capacitors (Supercapacitors),” in 2011 IEEE Symposium on Product Compliance Engineering Proceedings, San Diego, CA, October 10-12, 2011 1–5. doi:10.1109/PSES.2011.6088259
Wang, L., Yin, S., Zhang, C., Huan, Y., and Xu, J. (2018). Mechanical Characterization and Modeling for Anodes and Cathodes in Lithium-Ion Batteries. J. Power Sourc. 392, 265–273. doi:10.1016/j.jpowsour.2018.05.007
Xu, J., Liu, B., Wang, X., and Hu, D. (2016). Computational Model of 18650 Lithium-Ion Battery with Coupled Strain Rate and Soc Dependencies. Appl. Energ. 172, 180–189. doi:10.1016/j.apenergy.2016.03.108
Zhang, C., Santhanagopalan, S., Sprague, M. A., and Pesaran, A. A. (2015a). Coupled Mechanical-Electrical-thermal Modeling for Short-Circuit Prediction in a Lithium-Ion Cell under Mechanical Abuse. J. Power Sourc. 290, 102–113. doi:10.1016/j.jpowsour.2015.04.162
Zhang, C., Santhanagopalan, S., Sprague, M. A., and Pesaran, A. A. (2015b). A Representative-sandwich Model for Simultaneously Coupled Mechanical-Electrical-thermal Simulation of a Lithium-Ion Cell under Quasi-Static Indentation Tests. J. Power Sourc. 298, 309–321. doi:10.1016/j.jpowsour.2015.08.049
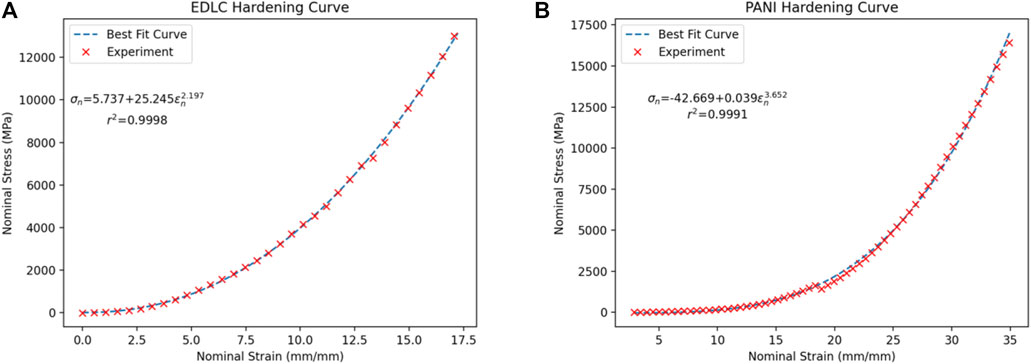
FIGURE A1. (A) Best fit curve for the hardening region of the Dry Cell 1 EDLC nail penetration (B) Best fit curve for the hardening region of the PANI-1, CNT/PANI-coated pseudocapacitor nail penetration.
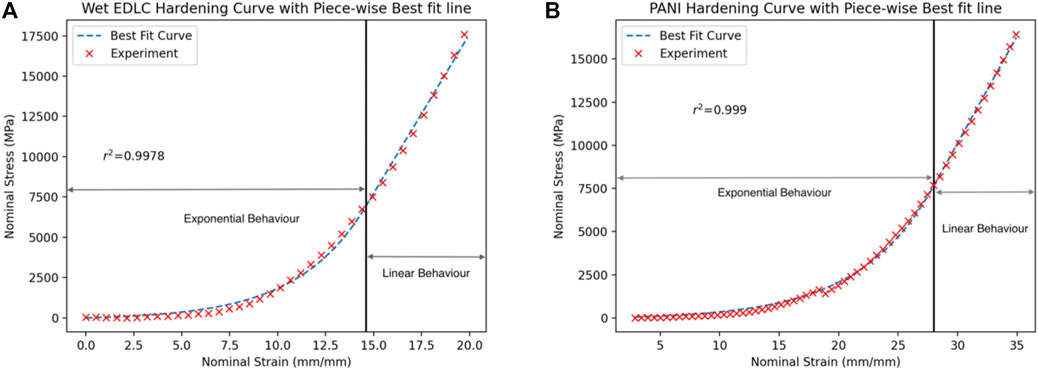
FIGURE A2. (A) Piece-wise best fitting curve for PANI-1, wet PANI pseudocapacitor (B) Piece-wise best fitting curve for wet EDLC-1.
Keywords: nail penetration, carbon nanotube, composites, energy storage, supercapacitors, electrochemical performance
Citation: Koliolios E, Mills DG, Busfield JJC and Tan W (2021) The Nail Penetration Behaviour of Carbon Nanotube Composite Electrodes for Energy Storage. Front. Mater. 8:741541. doi: 10.3389/fmats.2021.741541
Received: 14 July 2021; Accepted: 27 September 2021;
Published: 21 October 2021.
Edited by:
Dong Xiang, Southwest Petroleum University, ChinaReviewed by:
Yun Huang, Southwest Petroleum University, ChinaCopyright © 2021 Koliolios, Mills, Busfield and Tan. This is an open-access article distributed under the terms of the Creative Commons Attribution License (CC BY). The use, distribution or reproduction in other forums is permitted, provided the original author(s) and the copyright owner(s) are credited and that the original publication in this journal is cited, in accordance with accepted academic practice. No use, distribution or reproduction is permitted which does not comply with these terms.
*Correspondence: Wei Tan, d2VpLnRhbkBxbXVsLmFjLnVr
Disclaimer: All claims expressed in this article are solely those of the authors and do not necessarily represent those of their affiliated organizations, or those of the publisher, the editors and the reviewers. Any product that may be evaluated in this article or claim that may be made by its manufacturer is not guaranteed or endorsed by the publisher.
Research integrity at Frontiers
Learn more about the work of our research integrity team to safeguard the quality of each article we publish.