 Jing Ji
 Wei Kang
 Liangqin Jiang1
- 1Heilongjiang Key Laboratory of Disaster Prevention, Mitigation and Protection Engineering, Northeast Petroleum University, Daqing, China
- 2Key Laboratory of Structural Disaster and Control of the Ministry of Education, Harbin Institute of Technology, Harbin, China
- 3Handan Key Laboratory of Building Physical Environment and Regional Building Protection Technology, School of Architecture and Art, Hebei University of Engineering, Handan, China
In order to investigate the influence of various parameters on the compressive strength and fluidity of reactive powder concrete (RPC) made from local materials, 22 groups of RPC cubic specimens and 3 groups of RPC prism specimens were designed, and the main parameters included water to binder ratio, the ratio of silica fume to cement, the ratio of slag powder to cement, the ratio of quartz sand to cement, volume fraction of steel fiber, and steam curing time. The stress-strain curves and failure mode of RPC cubic specimens were obtained by the axial compression test. The influence of various parameters on the compressive mechanical properties and the mixture fluidity of RPC cubic specimens was analyzed. The results showed that the ultimate compressive strength (fcu) of RPC gradually decreases with the increase in the water to binder ratio; however, fcu increases with the increase in the volume fraction of steel fiber. fcu increases firstly and then decreases with the increase in the ratio of silica fume to cement, the ratio of slag powder to cement, and the ratio of quartz sand to cement, so there exists a peak point. The fluidity of RPC mixture increases with the increase in the water to binder ratio and the ratio of slag powder to cement; on the contrary, it decreases with the increase in the ratio of silica fume to cement, the ratio of quartz sand to cement, and volume fraction of steel fiber. Based on the analysis of the parameters, the optimal mix proportion of the RPC made from local materials is proposed. The constitutive model of RPC is established according to the stress-strain curves of RPC prism specimens. Finally, the relationship between compressive strength and elastic modulus of RPC made of local materials is regressed statistically.
Introduction
Reactive powder concrete (RPC), as a new type of high performance concrete material, has excellent mechanical properties, durability, and volume stability, which has been applied in practical projects (Abid et al., 2017; Salahuddin et al., 2020). As we know, there are great differences between RPC and ordinary concrete in composition and microstructure; therefore, it is necessary to study the mechanical properties of RPC made from local material (Xia et al., 2015). Many research studies on the mix proportion, mechanical properties, and durability of RPC materials have been carried out around the world, and it is certain that the mix proportion is the key factor affecting the performance of the RPC material.
The principles of mix proportion design, mechanical properties, durability, and high-temperature resistance of RPC were summarized by W. Zheng, and it could be known that RPC possessed excellent performance of chloride ion permeability resistance, carbonation resistance, frost thawing resistance, and sulfate resistance (Zheng et al., 2015). Based on the orthogonal experiment, the influence of different parameters on the mechanical properties and mixing flow of RPC was studied, and the mix proportion design of RPC was optimized by He et al. (2016). The mix proportion design and curing technology of RPC were obtained by Ola et al. (2021), and the results showed that the compressive strength could be improved obviously by adding the content of the quartz powder in RPC, and RPC cured by autoclave could achieve higher compressive strength than that cured by steam. Fiber reinforced polymers (steel fiber, glass fiber, carbon fiber, and basalt fiber) were added to RPC by some researchers, and the mechanical behavior of RPC mixed with FRP was obtained, and the results showed that the toughness of RPC was greatly improved with the increase in FRP (Deng et al., 2016; Syed et al., 2021). RPC had been used in steel-concrete composite structures, and the shear bearing capacity formula of RPC beams under bending and shear was proposed by Maha et al. (2018). The flexural behavior of reinforced concrete beams strengthened by RPC would be greatly improved, and the test results showed that, due to the existence of RPC, the high ductility of reinforcement was fully utilized in the process of plastic hinge formation (Zbigniew et al., 2020). The failure experiments of RPC materials under complex stress states were carried out successively. Based on the triaxial compression test of RPC under different peripheral pressure, the failure mode and failure criterion of RPC were obtained by X. Qin, and the results showed that the RPC specimens under different peripheral pressures mainly showed oblique shear failure (Qin, 2011). The biaxial compression test of RPC was carried out by Z. Li, and the failure criterion of RPC under biaxial compression was obtained. Based on the Ottosen constitutive model, the constitutive model of RPC under biaxial compression was proposed (Li, 2013). Subsequently, the biaxial tension-compression test of RPC was conducted by Y. Jiang, and the constitutive model in the tensile direction was established according to Weibull distribution (Jiang, 2014). Although the mix proportion of RPC has been widely studied around the world, there exist great differences in selecting materials in different area, and the performance of RPC obtained by different studies is discrete and lacks unified reference significance. Therefore, the mix proportion of RPC made from local materials should be optimized to accurately grasp its mechanical properties, which is crucial for the application of RPC materials in the local area.
The mix proportion design, material selection, and mixing process of RPC are introduced in this paper, and the influence of various parameters on the mechanical properties and fluidity of RPC is analyzed. Based on the test results, the constitutive model of RPC and the relationship between elastic modulus and compressive strength are established.
Experimental Program
Specimens Design
In order to study the compressive mechanical properties and the fluidity of reactive powder concrete made from local materials, water to binder ratio (w/b), the ratio of silica fume to cement (s/c), the ratio of slag powder to cement (p/c), the ratio of quartz sand to cement (q/c), volume fraction of steel fiber (f), and steam curing time (t) were taken as main parameters, and 22 groups of RPC cubic specimens and 3 groups of RPC prism specimens were designed. The specific parameters were shown in Table 1. The dimensions of Fi, Gi, and Hi groups were 70.7 × 70.7 × 230 mm (prism specimens), and the other groups were 70.7 × 70.7 × 70.7 mm (cubic specimens). The parameters of three groups of prism specimens were selected from cube specimens. The volume fraction of steel fiber in Table 1 was the volume ratio of steel fiber to mixture, and other components were their mass ratio to cement. The number after F, G, and H indicated the days of steam curing.
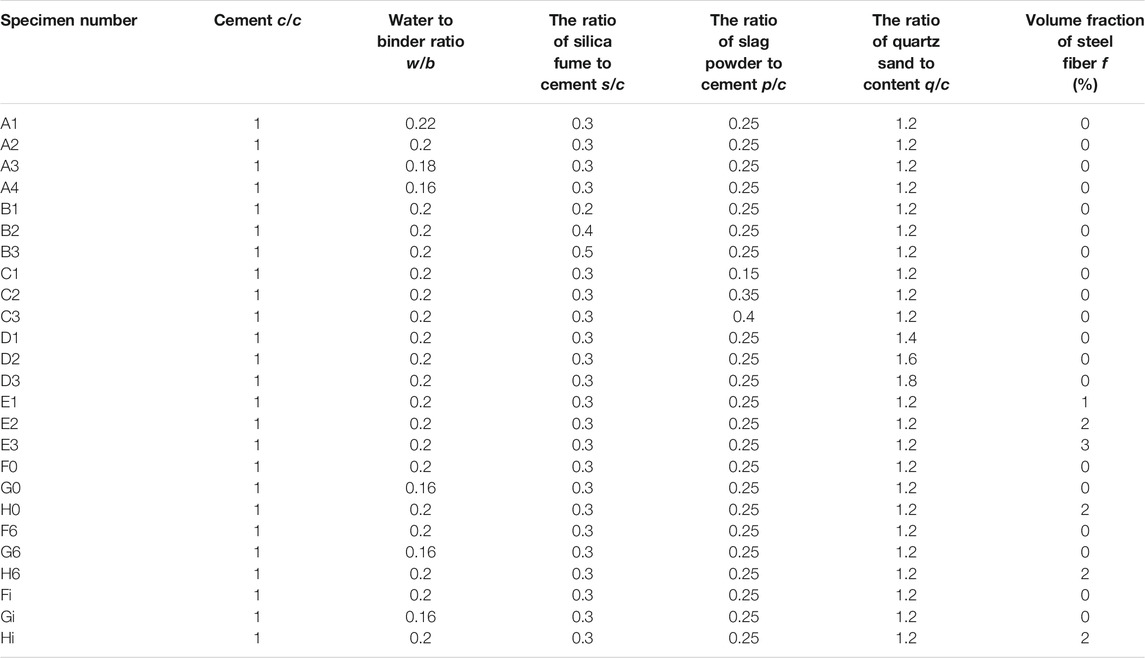
TABLE 1. The main parameters of RPC specimens.
The water to binder ratio referred to the mass ratio of water to gel material, and the expression was as follows:
where
Materials
Cement and Silica Fume
The cement was P.O 42.5 ordinary Portland cement produced by Jilin Yatai company. The bulk density of silica fume was 200–250 kg/m3, and the fineness less than 1 μm accounted for more than 80%, and the average particle size was 0.1–0.3 μm, and the specific surface area was 20–80 m2/kg. The SiO2 content in silica fume was 75–96%.
Quartz Sand and Slag Powder
The graded quartz fine sand with two particle sizes of 40–70 mesh and 70–140 mesh (produced by Harbin Jinghua water treatment material company) was selected as quartz sand, and its physical indexes and chemical composition were shown in Table 2. S95 blast furnace slag was selected as slag powder.
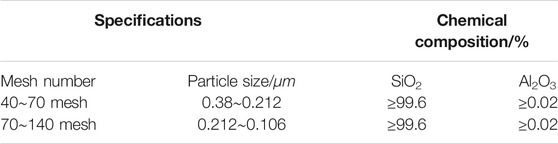
TABLE 2. Physical indexes and chemical composition of quartz sand.
Steel Fiber and Superplasticizer
The steel fiber was selected from Anshan Changhong steel fiber factory with a diameter of 0.22 mm and a length of 13 mm. FDN concentrated superplasticizer which can be purchased locally was selected as superplasticizer, and the product was yellowish brown powder.
Mixing Process and Fluidity Measurement
Due to the great difference between RPC and ordinary concrete, the mixing method of traditional concrete could not be used. According to the mixing experience obtained from existing research, the mixing process was adopted as shown in Figure 1.
1) The cementitious materials such as quartz sand, cement, silica fume, and slag powder were weighed according to the mix proportion.
2) The materials were poured into JJ-5 cement blender and were mixed for 2 min to make them even.
3) Water and superplasticizer were added to blender, and the mixture was stirred slowly for 4 min and then stirred quickly for 4 min.
4) For the experimental groups with steel fiber, steel fiber was added after stirring quickly; then the mixture was stirred for 5 min again.
5) Once the mixing was completed, the mixture was put into the fluidity test mold, and the fluidity of RPC mixture was measured according to the principle of jump table method proposed by test method for fluidity of cement mortar.
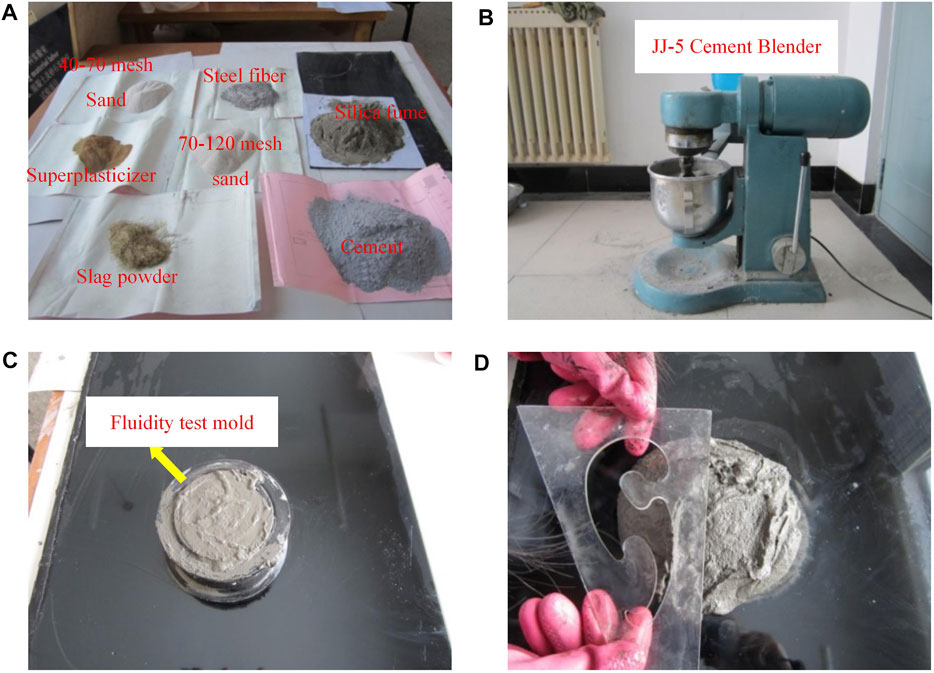
FIGURE 1. Mixing process: (A) Weighing of components; (B) mixing of materials; (C) fluidity test mold; (D) fluidity measurement.
Preparation and Curing of Specimens
After the fluidity was measured, we poured the mixture into the triple rubber sand mold and vibrated it with ZHDG-80 concrete shaking table and then levelled it with a spatula. After the specimens were formed, some specimens were cured by steam at 80°C for 3 days or 6 days, and the other specimens were not cured by steam. At last, all the specimens were cured by spraying water at room temperature until being tested after 28 days, as shown in Figure 2.
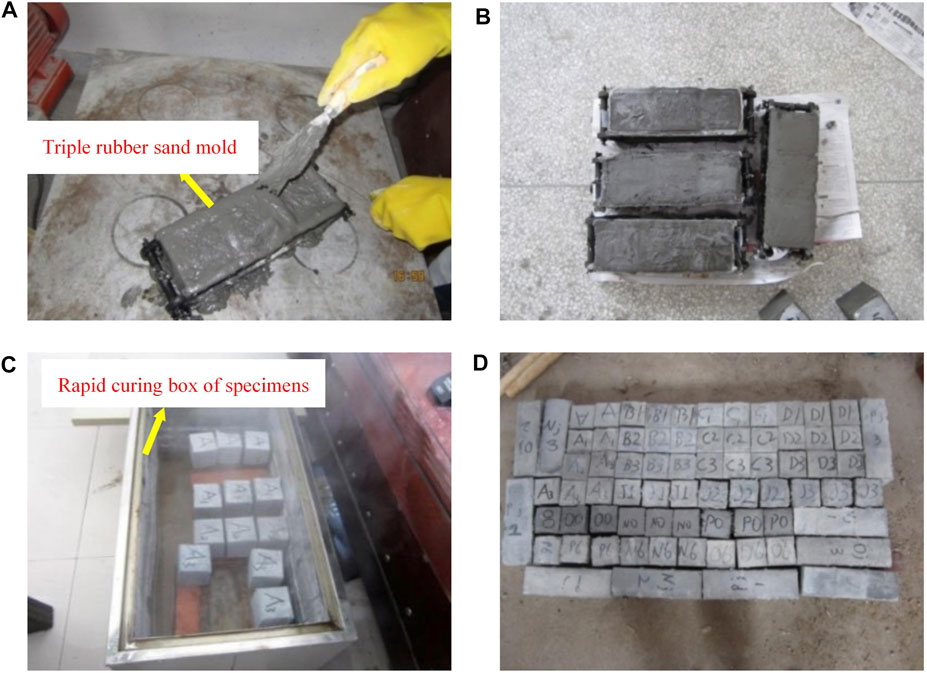
FIGURE 2. Specimens production process; (A) concrete mold forming; (B) room temperature curing. (C) Rapid curing box of specimens. (D) Specimens.
Specimen Test
In order to obtain the compressive stress-strain curve, elastic modulus, and Poisson’s ratio of RPC specimens, the compressive strength test was conducted on the axial compression testing machine in Heilongjiang Key Laboratory of Disaster Prevention, Mitigation, and Protection Engineering. To measure the transverse and longitudinal strain of the specimens, the strain gauges were pasted on two sides of the specimens along longitudinal and transverse directions, as shown in Figure 3.
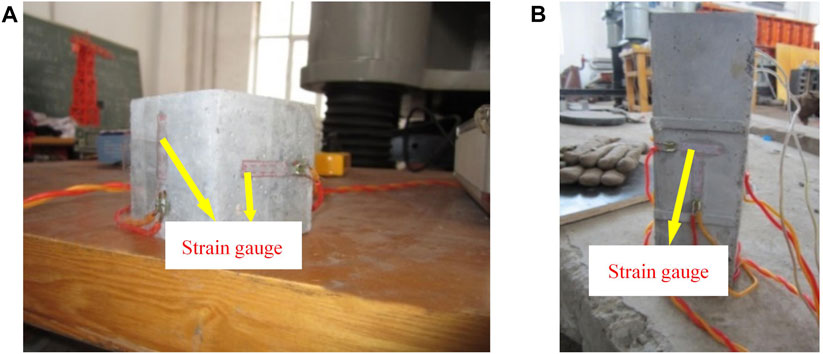
FIGURE 3. Strain gauge layout of specimens. (A) Strain gauge layout of cube specimen; (B) strain gauge layout of prism specimen.
The double control automatic loading of load and displacement was adopted in this experiment. The formal loading of the specimens was carried out after preloading. At the initial period of formal loading, the load control at a rate of 0.5 kN/s was adopted as loading mode. When the load reached 50% of the predicted peak load, it turned into displacement control at a rate of 0.02 mm/s until the specimens failed.
Test Phenomena
The RPC specimens without steel fiber had no obvious change at the initial formal loading. With the increase in the load, the phenomenon of the concrete spalling could be seen at the surface of the specimens. Later on, the failure of specimens happened accompanied by loud sound and violent reaction as the peak loads were reached. For the RPC specimens with steel fiber, the stress-strain relationship was linear at the initial loading period, and there was no obvious phenomenon on the surface of specimens. When the load approximately reached 0.5 times of the peak load, the splitting sound began to appear. With the increase in the load, the width and number of cracks increased gradually, and the debris began to peel off from the surface of the specimens accompanied by louder splitting sound. Then, the specimens entered unstable state, and the cracks showed a trend of penetration. The compressive stress-strain curves of the specimens entered the plastic stage. After reaching peak stress, obvious vertical cracks appeared on the surface of the specimens, and the stress-strain curves began to decline. It could be seen that, compared with the RPC specimens without steel fiber, the RPC specimens with steel fiber had a certain buffer for the development of cracks due to the anticracking of steel fiber. As a result, brittle failure did not occur. The failure modes of the two kinds of specimens were shown in Figure 4.
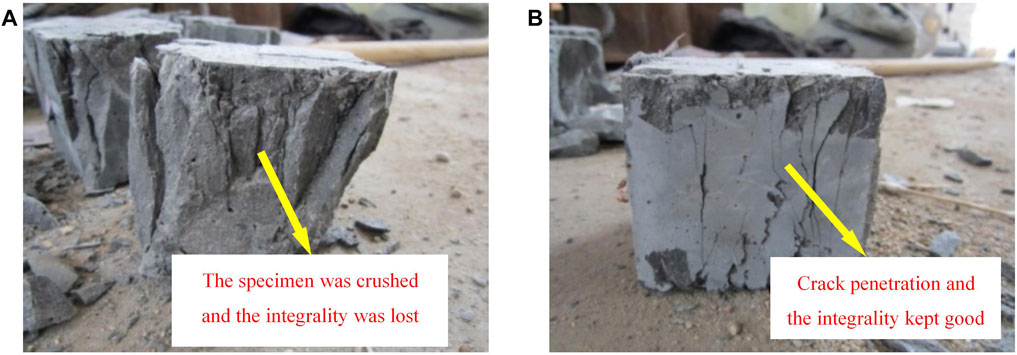
FIGURE 4. Failure mode of specimen. (A) Failure mode of specimens without steel fiber; (B) failure mode of specimens with steel fiber.
Results and Discussion
Test Results
The test result of fluidity (h) and ultimate compressive strength (fcu) of 22 groups of cube specimens are shown in Table 3, and the test values of compression mechanical indexes of 3 groups of prism specimens are shown in Table 4. The data value of elastic modulus in Table 4 is obtained according to the slope of the elastic stage of the stress-strain curves.
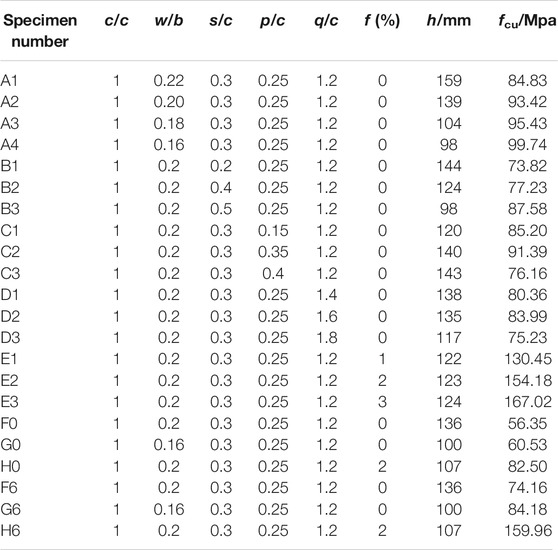
TABLE 3. Compression test results of 22 groups of cube specimens.
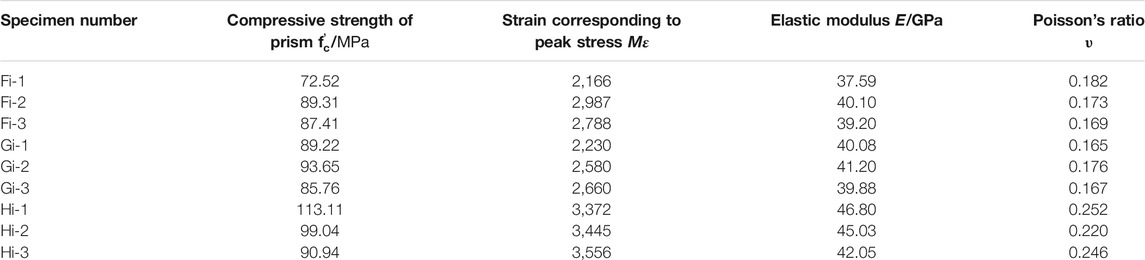
TABLE 4. Test values of compressive mechanical indexes of 3 groups of prism specimens.
Parameter Analysis
Water to Binder Ratio
The comparison of the stress-strain curves of the specimens with different water to binder ratios is shown in Figure 5A, and the influence of different water to binder ratios on the ultimate compressive strength and mixture fluidity of RPC specimens is shown in Figure 5B. It can be seen from Figure 5 and Table 3 that when the water to binder ratio of the specimens decreases from 0.22 to 0.20, 0.18, and 0.16 in turn, the ultimate compressive strength of the specimens increases from 84.83 to 93.42, 95.43, and 99.74 Mpa in order, which increases by 10.13, 12.50, and 17.58%, respectively. When the water to binder ratio of the mixture decreased from 0.22 to 0.20, 0.18, and 0.16 in turn, the fluidity of RPC mixture decreased from 159 to 139, 104, and 98 mm in order, which decreases by 12.58, 34.59, and 38.36%, respectively. It can be seen that, with the increase in the water to binder ratio, the fluidity of RPC mixture increases, while the ultimate compressive strength of the cube specimen decreases.
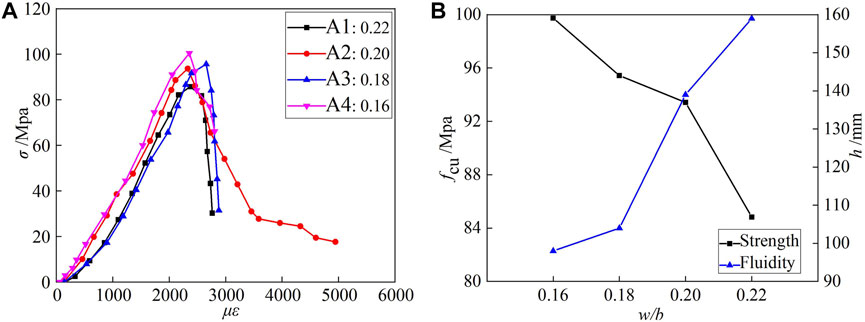
FIGURE 5. The influence of different water to binder ratios on RPC mechanical properties. (A) Stress-strain curves of RPC specimens with different water to binder ratios. (B) Ultimate compressive strength and mixture fluidity of RPC with different water to binder ratios.
The Ratio of Silica Fume to Cement
The comparison of stress-strain curves of specimens with different ratios of silica fume to cement is shown in Figure 6A, and the influence of different ratios of silica fume to cement on the ultimate compressive strength and mixture fluidity of RPC specimens is shown in Figure 6B. It can be seen from Figure 6 and Table 3 that when the ratio of silica fume to cement of the specimen increases from 0.2 to 0.3, 0.4, and 0.5 in turn, the ultimate compressive strength of the specimen increases from 73.82 to 93.42, 77.23, and 87.58 Mpa in order, which increases by 26.55, 4.61, and 18.65%, respectively. When the ratio of silica fume to cement of the mixture increases from 0.2 to 0.3, 0.4, and 0.5 in turn, the fluidity of RPC mixture decreases from 144 to 139, 124, and 98 mm in order, which decreases by 3.47, 13.89, and 31.94%, respectively. It can be seen that, with the increase in the ratio of silica fume to cement, the fluidity of the mixture decreases gradually, and the ratio of silica fume to cement corresponding to the peak of ultimate compressive strength of the cube specimens is taken as 0.3.
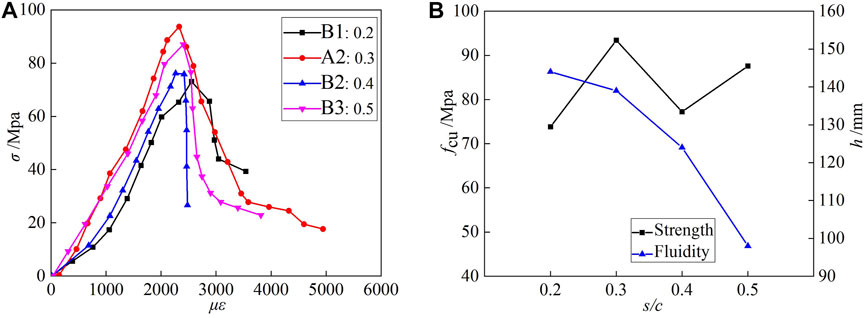
FIGURE 6. The influence of different ratios of silica fume to cement on RPC mechanical properties. (A) Stress-strain curves of RPC specimens with different ratios of silica fume to cement; (B) ultimate compressive strength and mixture fluidity of RPC with different ratios of silica fume to cement.
The Ratio of Slag Powder to Cement
The comparison of stress-strain curves of RPC specimens with different ratios of slag powder to cement is shown in Figure 7A, and the influence of different ratios of slag powder to cement on the ultimate compressive strength and mixture fluidity of RPC specimens is shown in Figure 7B. It can be seen from Figure 7 and Table 3 that when the ratio of slag powder to cement of the specimens increases from 0.15 to 0.25, 0.35, and 0.4 in turn, the ultimate compressive strength of the specimens increases from 85.20 to 93.42, 91.39, and 76.16 Mpa in order, which increases by 9.65%, 7.27%, and −10.61%, respectively. When the ratio of slag powder to cement of the mixture increases from 0.15 to 0.25, 0.35, and 0.4 in turn, the fluidity of RPC mixture increases from 120 to 139, 140, and 143 mm in order, which increases by 15.83, 16.67, and 19.17%, respectively. It can be seen that, with the increase in the ratio of slag powder to cement, the fluidity of mixture increases. The ratio of slag powder to cement corresponding to the peak of ultimate compressive strength of the cube specimens is taken as 0.25.
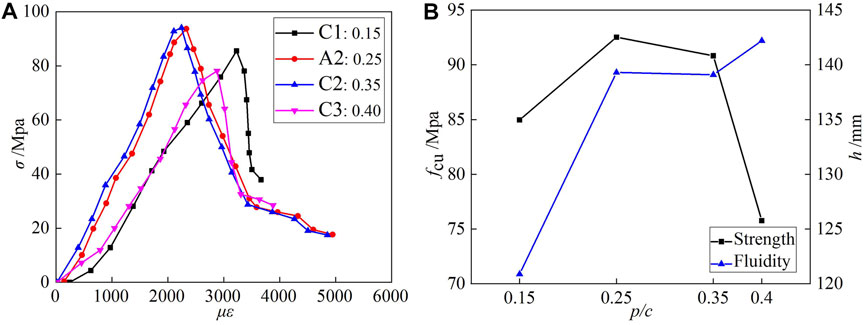
FIGURE 7. The influence of different ratios of slag powder to cement on RPC mechanical properties. (A) Stress-strain curves of RPC specimens with different ratios of slag powder to cement; (B) ultimate compressive strength and mixture fluidity of RPC with different ratios of slag powder to cement.
The Ratio of Quartz Sand to Cement
The comparison of stress-strain curves of specimens with different ratios of quartz sand to cement is shown in Figure 8A, and the influence of different ratios of quartz sand to cement on the ultimate compressive strength and mixture fluidity of RPC specimens is shown in Figure 8B. It can be seen from Figure 8 and Table 3 that when the ratio of quartz sand to cement of the specimen increases from 1.2 to 1.4, 1.6, and 1.8 in turn, the ultimate compressive strength of the specimen decreases from 80.36 to 93.42, 83.99, and 75.23 Mpa in order, which increases by 16.25, 4.52, and −6.36%, respectively. When the ratio of quartz sand to cement of the mixture increases from 1.2 to 1.4, 1.6, and 1.8 in turn, the fluidity of RPC mixture decreases from 139 to 138, 135, and 117 mm in order, which decreases by 0.72, 2.88, and 15.83%, respectively. It can be seen that, with the increase in the ratio of quartz sand to cement, the fluidity of the mixture increases, and the ratio of quartz sand to cement corresponding to the peak of ultimate compressive strength of the cube specimens is taken as 1.4.
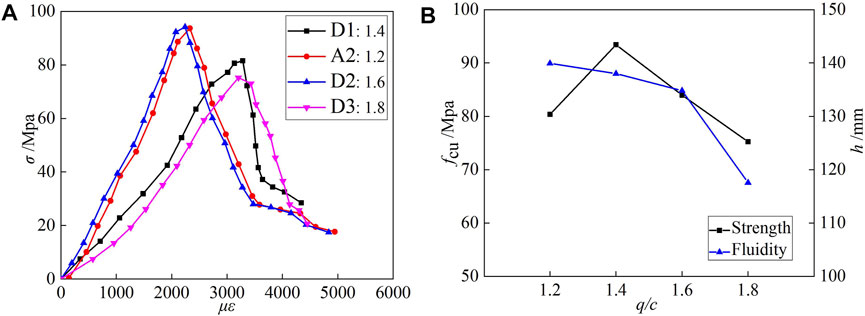
FIGURE 8. The influence of different ratios of quartz sand to cement on RPC mechanical properties. (A) Stress-strain curves of RPC specimens with different ratios of quartz sand to cement. (B) Ultimate compressive strength and mixture fluidity of RPC with different ratios of quartz sand to cement.
The Volume Fraction of Steel Fiber
The comparison of stress-strain curves of specimens with different volume fractions of steel fiber is shown in Figure 9A, and the influence of different volume fractions of steel fiber on the ultimate compressive strength and mixture fluidity of RPC specimens is shown in Figure 9B. It can be seen from Figure 9 and Table 3 that when the volume fraction of steel fiber of the specimens increases from 0 to 1, 2, and 3% in turn, the ultimate compressive strength of the specimen increases from 93.42 to 130.45, 154.18, and 167.02 Mpa in order, which increases by 28.39, 65.04, and 80.92%, respectively. When the volume fraction of steel fiber of the mixture increases from 0 to 1, 2, and 3% in turn, the fluidity of RPC mixture decreases from 139 to 122, 123, and 124 mm in turn, which decreases by 12.23, 11.51, and 10.79%, respectively. It can be seen that, with the increase in the volume fraction of steel fiber, the fluidity of mixture decreases, while the ultimate compressive strength of the cube specimens increases gradually.
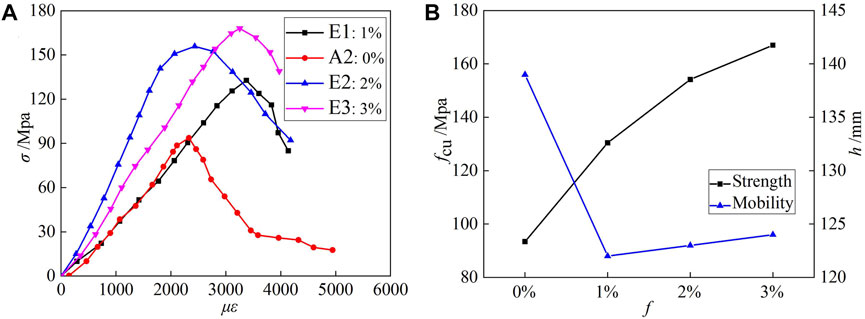
FIGURE 9. The influence of different volume fractions of steel fiber on RPC mechanical properties. (A) Stress-strain curves of RPC specimens with different volume fractions of steel fiber. (B) Ultimate compressive strength and mixture fluidity of RPC with different volume fractions of steel fiber.
Normal Pressure Steam Curing Time
Under 80°C normal pressure steam environment, specimens A2, A4, and E2 are cured for 3 days, and specimens F6, G6, and H6 are cured for 6 days; however specimens F0, G0, and H0 are not cured under 80°C normal pressure steam environment. The influence of steam curing time on RPC is investigated according to the ultimate compressive strength of specimens, as shown in Figure 10. The comparison results show that the ultimate compressive strength of all specimens without steam curing is relatively low. For the group of G0, A4, and G6 and the group of F0, A2, and F6, the specimens can reach the highest ultimate compressive strength when cured by steam for 3 days; nevertheless the ultimate compressive strength of the specimens cured by steam for 6 days is lower than that of the specimens cured by steam for 3 days. For the group of H0, E2, and H6, the ultimate compressive strength of specimen H6 cured by steam for 6 days is higher slightly than that of specimen E2 cured by steam for 3 days, and both are basically the same; therefore, there is little difference for ultimate compressive strength between the specimens cured by steam for 3 and 6 days. It could be drawn that the best steam curing time for RPC specimens is 3 days.
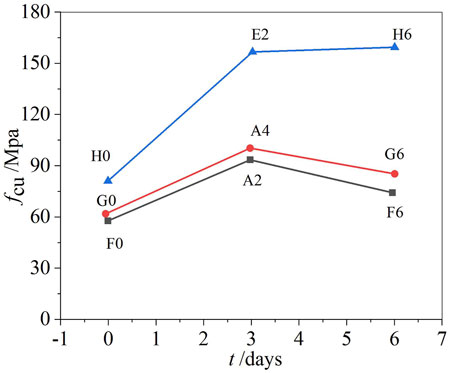
FIGURE 10. The influence of different atmospheric steam curing time on ultimate compressive strength of RPC.
Optimal Mix Proportion of RPC
Based on the results of cube specimen tests in Table 3, the optimal mix proportion of RPC is proposed through the comprehensive consideration of the fluidity behavior, compressive strength, and economic index, meanwhile taking the materials that can be purchased locally into consideration. With the addition of steel fiber, the cost of RPC will increase greatly and its failure mode will change, so two groups of optimal mix proportion are obtained in this paper. One group is not mixed with steel fiber, and the other group contains steel fiber, as seen Tables 5, 6.

TABLE 5. Optimal RPC mix proportion without steel fiber.

TABLE 6. Optimum RPC mix proportion with steel fiber.
Constitutive Model of RPC
According to the above research conclusion, when 2% steel fiber was added to RPC, the compressive strength of the material could be greatly improved. Therefore, the results of H group prism specimens are selected for regression of constitutive model. Based on the stress-strain curves of prism specimens, a fitting stress-strain curve is obtained by using lstOpt software regression. The comparison between the fitting curve and the three test curves of group H is shown in Figure 11.
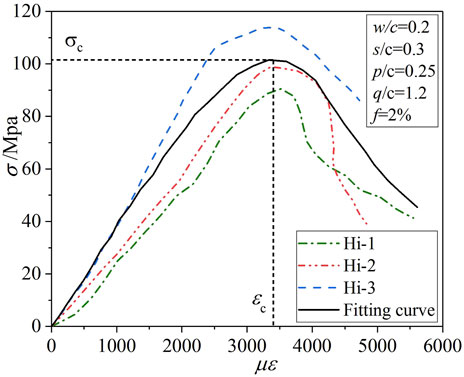
FIGURE 11. Comparison of fitting stress-strain curve and test curves.
In order to obtain the constitutive model of RPC, firstly, the stress and strain are transformed into dimensionless quantities. Let
In view of the limitations of laboratory conditions, the compressive stress-strain curves of some RPC specimens in the stress drop segment are very discrete, so it is inadequate to regress the constitutive model of the stress drop segment. Therefore, the corresponding formula given in Wang (2008) is adopted as the constitutive model of RPC stress drop segment in this paper. The constitutive model is shown in Figure 12, and the expression is as follows:
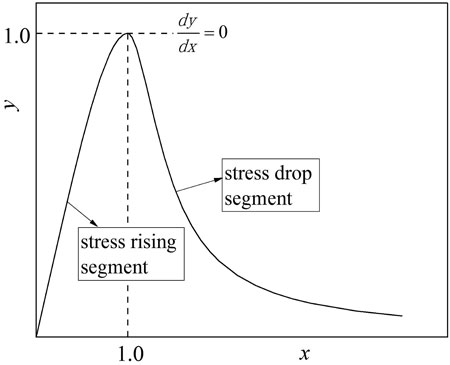
FIGURE 12. Constitutive model of RPC.
Relationship Between Compressive Strength and Elastic Modulus
According to the relationship between elastic modulus and compressive strength of RPC in Ahmad et al. (2015), the expression is as follows:
The relationship between elastic modulus and compressive strength of RPC prism specimens is established; the expression is as follows:
Based on the experimental data in Table 4, the global optimization algorithm (Leveberg Marquardt) in lstOpt software is used to calculate the coefficient a in Eq. 6. After 23 iterations, the convergence standard is reached, and the coefficient a is 4.34. The relationship between the elastic modulus and compressive strength of RPC made from local materials is obtained as follows:
where E is the modulus of elasticity of RPC (Gpa), and
The coefficient of regression formula in Ahmad et al. (2015) is 4.36, and the coefficient of regression in this test is 4.34, which indicates that there is a universal relationship between the elastic modulus and compressive strength of RPC. The square sum of the correlation coefficients of the regression formula in Ahmad et al. (2015) is
According to Eq. 7, the modulus of elasticity (Ew) of 9 specimens is calculated by using RPC compressive strength, as shown in Table 7. The dispersion comparison of E and Ew of 9 specimens is shown in Figure 13. Through the comparison, it can be seen that the maximum error is 4.19%, which shows that the two are in good agreement and meet the engineering requirements.
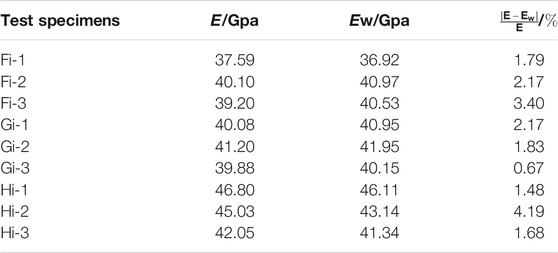
TABLE 7. The comparison between E and Ew.
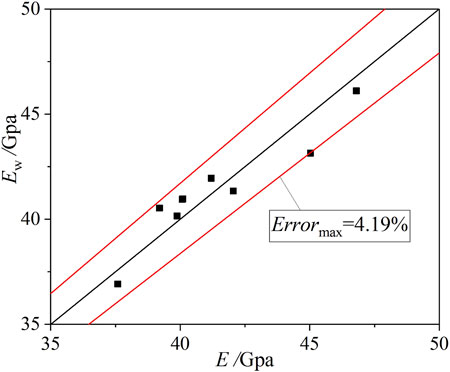
FIGURE 13. The comparison between E and Ew for 9 specimens.
Conclusion
In this paper, 22 groups of RPC cubic specimens and 3 groups of RPC prism specimens were carried out, and two groups of optimal mix proportion were obtained. From the results of comparisons and analysis presented in this paper, the following conclusions are obtained.
1) When the load approximately reached 0.5 times of the peak load, the cracks of RPC specimens with steel fiber began to develop. After reaching peak stress, obvious vertical cracks appeared on the surface of the specimens. It can be concluded that the crack resistance of steel fiber has a certain buffer for the development of cracks, and the RPC specimens with steel fiber do not show brittle failure.
2) The ratio of silica fume to cement, the ratio of slag powder to cement, the ratio of quartz sand to cement, the volume fraction of steel fiber, and water to binder ratio have greater influence on the compressive strength of RPC specimens. The compressive strength of RPC specimens reaches the maximum when the ratio of silica fume to cement is 0.3, the ratio of slag powder to cement is 0.25, and the ratio of quartz sand to cement is 1.4, respectively. When the volume fraction of steel fiber is 1∼ 3%, the compressive strength of the specimens increases with the increasing of the volume fraction of steel fiber. With the increase in the water to binder ratio in a certain range, the compressive strength gradually decreases; however the fluidity gradually increases. The recommended value of water to binder ratio is 0.2, which could ensure the mechanic behavior of RPC specimens.
3) Steam curing time has some influence on the compressive strength of RPC. The strength of specimens without steam curing is very low, and RPC can reach the highest strength after steam curing for 3 days; however the compressive strength of the specimens of steam curing for 6 days is lower than the compressive strength of the specimens of steam curing for 3 days.
4) Based on the stress-strain curves of RPC prism specimens, the constitutive model of RPC made from local materials is established. The relationship between compressive strength and elastic modulus for RPC is regressed statistically, which is in good agreement with the existing expression.
Data Availability Statement
The original contributions presented in the study are included in the article/supplementary material, and further inquiries can be directed to the corresponding author.
Author Contributions
JJ contributed to testing and writing; WK contributed to writing and translation; LJ contributed to testing; YL contributed to translation; HR contributed to writing; SH, LH, YL, and CY contributed to translation. All authors contributed to the article and approved the submitted version.
Funding
The authors are grateful to the financial support received from the National Natural Science Foundation of China (Grant no. 51808173); the Natural Science Foundation of Heilongjiang Province (Grant no. LH 2020E018); the Opening Fund for Key Laboratory of the Ministry of Education for Structural Disaster and Control of Harbin Institute of Technology (Grant no. HITCE201908); the Social Science Foundation of Hebei Province (grant no. HB20GL055); the Northeast Petroleum University Guided Innovation Fund (grant no. 2020YDL-02); and the Research on Risk Identification and Emergency Management of Residential Buildings from the Perspective of COVID-19 (grant no. SQ2021115).
Conflict of Interest
The authors declare that the research was conducted in the absence of any commercial or financial relationships that could be construed as a potential conflict of interest.
Publisher’s Note
All claims expressed in this article are solely those of the authors and do not necessarily represent those of their affiliated organizations, or those of the publisher, the editors and the reviewers. Any product that may be evaluated in this article, or claim that may be made by its manufacturer, is not guaranteed or endorsed by the publisher.
References
Abid, M., Hou, X., Zheng, W., and Hussain, R. R. (2017). High Temperature and Residual Properties of Reactive Powder concrete - A Review. Construction Building Mater. 147, 339–351. doi:10.1016/j.conbuildmat.2017.04.083
Ahmad, S., Zubair, A., and Maslehuddin, M. (2015). Effect of Key Mixture Parameters on Flow and Mechanical Properties of Reactive Powder concrete. Construction Building Mater. 99, 73–81. doi:10.1016/j.conbuildmat.2015.09.010
Deng, Z. C., and Feng, Q. (2016). Fracture Properties of Hybrid Fibers Reinforced Reactive Powder Concrete. J. Building Mater. 19, 14–21. doi:10.3969/j.issn.1007-9629.2016.01.003
He, X. Y., Qin, L., Zhang, H. Y., Zhang, S. Y., Li, H., and Zhao, Y. R. (2016). Mixture Ratio Design of Basalt Fiber Reactive Powder Concrete Based on Orthogonal Theory. Building Chin. Ceram. Soc. 35, 1402–1406+1412. doi:10.16552/j.cnki.issn1001-1625.2016.05.013
Jiang, Y. R. (2014). Experimental Investigation on Mechanical Behavior of Reactive Powder Concrete under Tension-Compression Stress State. Beijing: Beijing Jiaotong University.
Li, Z. G. (2013). Experimental Study of Practical Failure Criterion of Reactive Powder Concrete under Biaxial Compression. Beijing: Beijing Jiaotong University.
Mayhoub, O. A., Nasr, E.-S. A. R., Ali, Y. A., and Kohail, M. (2021). The Influence of Ingredients on the Properties of Reactive Powder Concrete: A Review. Ain Shams Eng. J. 12, 145–158. doi:10.1016/j.asej.2020.07.016
Perkowski, Z., Czabak, M., Grzeszczyk, S., Frączek, D., Tatara, K., Matuszek-Chmurowska, A., et al. (2020). Experimental Research on Concrete Beams Reinforced with High Ductility Steel Bars and Strengthened with A Reactive Powder Concrete Layer in the Compression Zone. Materials 13, 4173. doi:10.3390/ma13184173
Qin, X. (2011). Under Various Stress the Constitutive Relation and Failure Criterion of Reactive Powder Concrete. Beijing: Beijing Jiaotong University.
Raza, S. S., Qureshi, L. A., Ali, B., Raza, A., and Khan, M. M. (2021). Effect of Different Fibers (Steel Fibers, Glass Fibers, and Carbon Fibers) on Mechanical Properties of Reactive Powder Concrete. Struct. Concrete 22, 334–346. doi:10.1002/suco.201900439
Ridha, M. M. S., Al-Shaarbaf, I. A. S., and Sarsam, K. F. (2018). Experimental Study on Shear Resistance of Reactive Powder Concrete Beams without Stirrups. Mech. Adv. Mater. Structures 27, 1006–1018. doi:10.1080/15376494.2018.1504258
Salahuddin, H., Qureshi, L. A., Nawaz, A., and Raza, S. S. (2020). Effect of Recycled Fine Aggregates on Performance of Reactive Powder Concrete. Construction Building Mater. 243, 118223. doi:10.1016/j.conbuildmat.2020.118223
Wang, Z. N. (2008). Research on Flexural Behavior of Reactive Powder Concrete Rectangular Beam with Steel Bar. Beijing: Beijing Jiaotong University.
Xia, H., Wang, W., and Shi, Z. (2015). Mechanical Properties of Reactive Powder Concrete with Ultra-short Brass-Coated Steel Fibres. Mag. Concrete Res. 67, 308–316. doi:10.1680/macr.14.00184
Keywords: reactive powder concrete, fluidity, compressive strength, optimal mix proportion, constitutive model
Citation: Ji J, Kang W, Jiang L, Li Y, Ren H, Hao S, He L, Lin Y and Yu C (2021) Mechanical Behavior of Reactive Powder Concrete Made From Local Material Subjected to Axial Pressure. Front. Mater. 8:737646. doi: 10.3389/fmats.2021.737646
Received: 07 July 2021; Accepted: 04 August 2021;
Published: 06 September 2021.
Edited by:
Kequan Yu, Tongji University, ChinaReviewed by:
Wenyang Liu, IFET College of Engineering, IndiaYan Kai, Shandong Jianzhu University, China
Copyright © 2021 Ji, Kang, Jiang, Li, Ren, Hao, He, Lin and Yu. This is an open-access article distributed under the terms of the Creative Commons Attribution License (CC BY). The use, distribution or reproduction in other forums is permitted, provided the original author(s) and the copyright owner(s) are credited and that the original publication in this journal is cited, in accordance with accepted academic practice. No use, distribution or reproduction is permitted which does not comply with these terms.
*Correspondence: Hongguo Ren, cmVuaG9uZ2d1bzc3MTEyNkAxNjMuY29t