 Nghiem NguyenVan
 Kengo Kato
 Hideki Ono
94% of researchers rate our articles as excellent or good
Learn more about the work of our research integrity team to safeguard the quality of each article we publish.
Find out more
ORIGINAL RESEARCH article
Front. Mater., 03 September 2021
Sec. Structural Materials
Volume 8 - 2021 | https://doi.org/10.3389/fmats.2021.736284
This article is part of the Research TopicInclusion/Precipitate Engineering and Thermo-Physical Properties in Liquid Steels and AlloysView all 8 articles
Medium Manganese Transformation Induced Plastic (Mn-TRIP) steels are expected to be a new generation of advanced high strength sheet steels due to their excellent balance between material cost and mechanical properties. During the solidification process, AlN precipitates at the grain boundary, which leads to the serious deterioration of hot ductility. However, the precipitation of AlN in Mn-TRIP steel has not been clear. In this study, the chemical compositions, morphology, size distribution, and the precipitation behavior of AlN inclusion in an Fe-0.5Al-2.0Mn alloy were studied under the continuous unidirectional solidification process. The results show that there are two types of nitride inclusions in the Fe-0.5Al-2.0Mn alloy: AlN inclusion and complex inclusion of Al2O3-AlN. The planar sections of most AlN particles are hexagonal. Based on the thermodynamic calculation, it was found that the content of Al has a large effect on the stability of Al2O3 and AlN. When the content of Al increases, the molten iron can be changed from saturated by Al2O3 to saturated by AlN. During the solidification process, the precipitation of Al2O3 inclusions occurred at the beginning of the solidification process. The precipitation of AlN inclusions occurred when the contents of Al and N exceeded the equilibrium value and grew until the end of the solidification. The precipitation conditions of AlN inclusion in the Fe-0.5Al-2.0Mn alloy during the solidification process were discussed. The precipitation and the amount of precipitate of AlN inclusions depend on the initial contents of Al, N, and O. It was found that the precipitation of AlN inclusions can be controlled by reducing the initial content of N to less than 0.0072 mass%.
Nowadays, the global automotive industry has been attempting to address the challenge of weight reduction in automobiles to decrease greenhouse gas emissions and improve fuel efficiency. In the automotive industry, sheet steels are used as the major structural material, and thus the development of stronger and cheaper steels is the primary approach adopted by material scientists to meet the demands of the automotive industry. Throughout the world there is increasing interest in the development of new Advanced High Strength Steels (AHSS) with enhanced combinations of strength and ductility to provide sheet materials for demanding applications in future vehicles (Matlock et al., 2012). Transformation Induced Plastic (TRIP), Dual Phase (DP), and Complex Phase steels are AHSS grades that are referred to as the first generation of AHSS. The product of the ultimate tensile strength (UTS) and the total elongation (TE) of the first generation (UTS × TE) is usually less than 25 GPa%. The austenitic stainless steels, Twinning Induced Plasticity (TWIP) steels, and lightweight steels are referred to as the second generation of AHSS. The second of AHSS steel exhibits outstanding mechanical properties (UTS × TE ≥ 50 GPa %), but these austenitic grades are highly alloyed resulting in a significant cost increase (Matlock et al., 2012). In addition, the industrial processing of these alloys, specifically the TWIP steels with high manganese contents, has shown to be extremely challenging and pronely delayed cracking (Kim et al., 2008). Recent researches indicated that the embrittlement susceptibility can be reduced by aluminum alloying, although the exact mechanism involved is still under investigation (Kim et al., 2008). Because of restrictions of the first and second generation as mentioned above, in recent years, metallurgists have actively been developing a new generation of AHSS. Medium Mn TRIP steels have been actively investigated and expected to the third generation of AHSS due to their excellent balance between material cost and mechanical properties.
Continuous casting (CC) is one of the key technologies and an indispensable manufacturing process for the production process of Mn-TRIP steel. However, the fundamental research on the industrial CC technology of Mn-TRIP steel has been quite limited, thus the fundamental research on CC technology of Mn-TRIP steel should be carried out. In the CC process, the surface crack is one of the main problems affecting the quality of the slab. The research on the control of the slab cracks has attracted more and more attention. The hot ductility is an important parameter that reflects the crack sensitivity of the slab. During the solidification process, AlN precipitates at the grain boundary, which leads to the serious deterioration of hot ductility (Yang et al., 2018). Tuling et al. (2011) reported that when the content of Al in TRIP steel was 0.05% (in this paper, the alloy composition unit is mass%), no AlN was found; when the content of Al was increased to 1%, dendritic AlN was precipitated on the austenite grain boundary; and when the content of Al was up to 1.5%, the AlN in TRIP steel was lath-like, without obvious dendritic AlN. Due to the peritectic reaction during the solidification of 1% Al TRIP steel, the precipitation of dendritic AlN on the austenite grain boundary and coarse (∼800 μm) austenite grain leads to the deterioration of hot ductility. However, the precipitation of AlN inclusions in Mn-TRIP steel during the solidification process has not been clear. Therefore, the research on precipitation of AlN inclusions in Mn-TRIP steel is urgently needed.
In this study, the precipitation behavior of AlN inclusions in an Fe-0.5Al-2.0Mn alloy under the continuous unidirectional solidification process was investigated. The chemical compositions, morphology, and size distribution of AlN inclusions at different positions were observed and analyzed by a Scanning Electron Microscope with Energy Dispersive Spectroscopy (SEM-EDS) and an image processing ImageJ program. In addition, under the thermodynamic calculation, the precipitation conditions of AlN inclusion in the Fe-0.5Al-2.0Mn alloy during the solidification process were discussed, which provides theoretical support for controlling the precipitation of AlN inclusions.
The Fe-0.5Al-2.0Mn alloy was produced in an induction furnace under an atmosphere of nitrogen (99.999% purity) with high purity materials, and the initial chemical composition of the alloy is shown in Table 1. The produced alloy was cut into small pieces and placed in an Al2O3 crucible [outer diameter (O.D.): 15 mm, inner diameter (I.D.): 12 mm, and height (H.): 100 mm]. Another Al2O3 crucible was used as an outer crucible. The unidirectional solidification experiment was carried out in an electric resistance furnace under an atmosphere of nitrogen (99.999% purity) and a temperature gradient of 13.73 K/cm. The temperature gradient was measured in advanced without the samples by a thermocouple at a set temperature of 1900 K. A schematic diagram of the experimental apparatus is shown in Figure 1. Firstly, the air in the furnace was evacuated by a vacuum pump and nitrogen gas was introduced into the furnace. Subsequently, the alloy was heated to 1873 K with a heating rate of 10 K/min. The temperature of the furnace during the unidirectional solidification experiment was measured directly by an attached thermocouple as shown in Figure 1. After the surface temperature of the sample reached 1873 K, the alloy was held for 2 h, then cooled down to 1773 K with a cooling rate of 4 K/min. The cooling rate was determined as the multiplication of the temperature gradient and solidification rate which was chosen to be 0.3 cm/min. Finally, when the temperature cooled down to 1773 K, the sample was withdrawn from the furnace and quenched intermediately into the cool water.
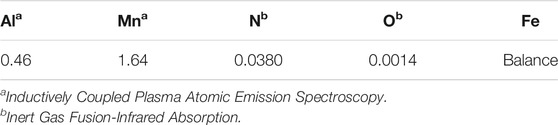
TABLE 1. Initial chemical composition of FeAlMn alloy (mass%).
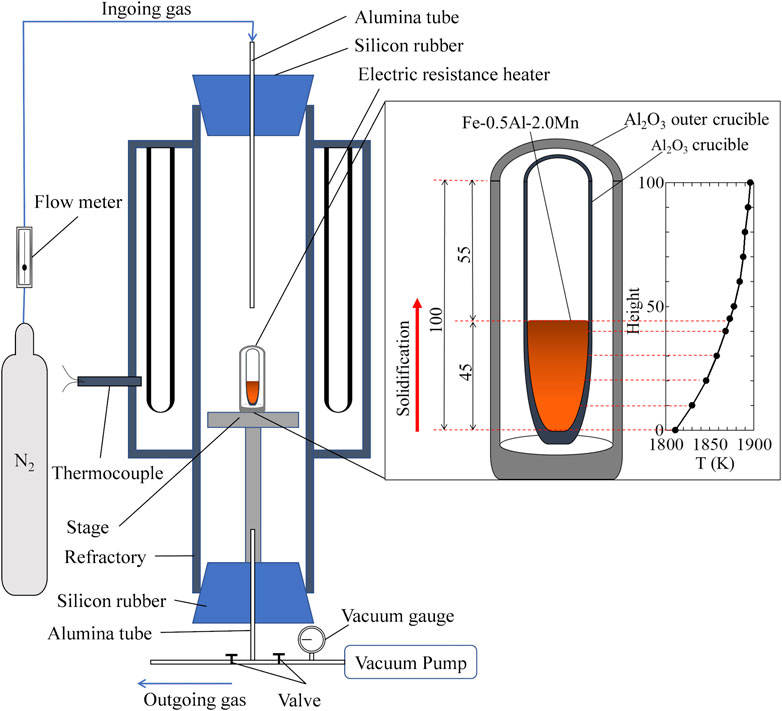
FIGURE 1. A schematic diagram of the experimental apparatus.
The sample was longitudinally cut at the middle, on which the morphology and chemical compositions of AlN inclusions were observed and analyzed by a Scanning Electron Microscope with Energy Dispersive Spectroscopy (SEM-EDS) after grinding and polishing. The sample was observed from the bottom (low temperature) to the top (high temperature) at 4 mm intervals and the same surface area. The number and size of AlN inclusions were measured by the image processing ImageJ program (Igathinathane et al., 2008; Mazzoli and Favoni, 2012). The contents of nitrogen and oxygen at different positions of the sample were measured by the Inert Gas Fusion-Infrared Absorption method. The initial contents of Al and Mn were analyzed by Inductively Coupled Plasma Atomic Emission Spectroscopy.
According to SEM-EDS observations, AlN was the dominant inclusion in the experimental alloy. The planar sections of most of the AlN particles were hexagonal. The results of SEM-EDS show that there were two types of nitride inclusions in the experimental Fe-0.5Al-2.0 alloy: AlN inclusion and complex inclusion of Al2O3-AlN. Other inclusions such as MnS or the complex inclusions of AlN-MnS were not observed because the content of Sulphur consisting in the alloy was as extremely low as 10 ppm. Figure 2 shows the morphology and the elemental mappings of AlN inclusions. The compositions of AlN inclusion determined by EDS were Al 56.1 at %, N 42.3 at % at spot 1, and Al 51.7 at %, N 47.4 at % at spot 2 as shown in Figures 2A,E. According to the results of EDS analysis, the precipitation of AlN inclusions was homogeneous nucleation without distribution of other elements. The diameter of the AlN particle was determined as 8.9 μm. The morphology and elemental mappings of complex inclusion of Al2O3-AlN are shown in Figure 3. As can be seen from Figure 3, there are two phases of the complex inclusion of Al2O3-AlN with the spherical shape of inner Al2O3 and the hexagonal shape of outer AlN inclusion. The diameter of the inner Al2O3 particle was about 2.5 μm and the diameter of the outer AlN particle was 7.4 μm. The compositions of the complex inclusion of Al2O3-AlN determined by EDS were Al 52.7 at %, N 42.4 at % at spot 1, and Al 41.9 at %, O 53.7 at % at spot 2 as shown in Figures 3A,E. According to the results of EDS analysis, the compositions of the inclusion were heterogeneous, Al2O3 can be considered as the nucleation core of the AlN inclusion.
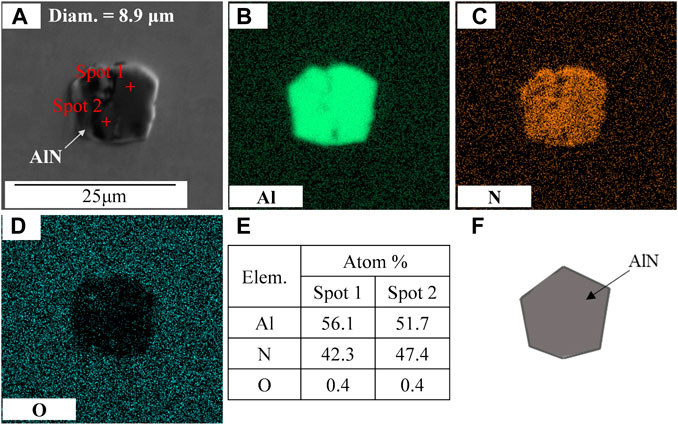
FIGURE 2. Morphology and elemental mappings of AlN inclusion.
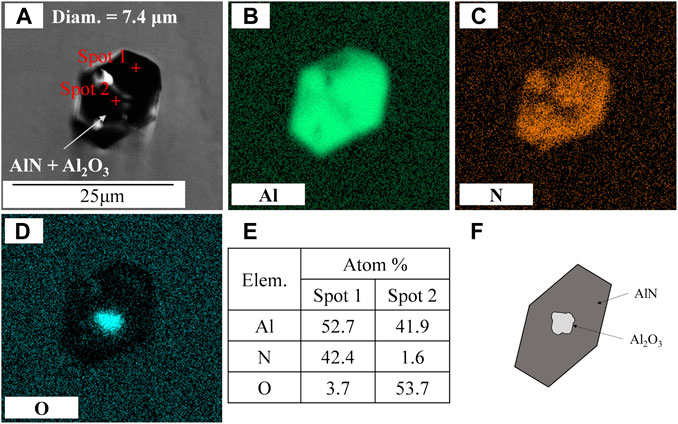
FIGURE 3. Morphology and elemental mappings of complex inclusion of AlN-Al2O3.
Figure 4 shows the contents of O and N at different positions from the bottom of the experimental alloy. The average content of O was increased after the solidification experiment compared with the initial content. In contrast to the average content of O, the average content of N was decreased after the solidification experiment compared with the initial content. A small amount of O2 in N2 gas used for the solidification experiment was considered as the reason for the increased amount of O in the experimental alloy. During the solidification process, the content of N in the liquid phase was enriched due to the segregation phenomenon that is, discussed in Precipitation Behavior of AlN Inclusions. When the content of N exceeded the nitrogen solubility in the liquid phase, N2 gas was formed which leads to a decrease in the content of N after the solidification experiment. As can be seen from Figure 4, the distribution of O in the experimental alloy was irregular. Meanwhile, the contents of N showed a gradient distribution along the direction of the solidification process.
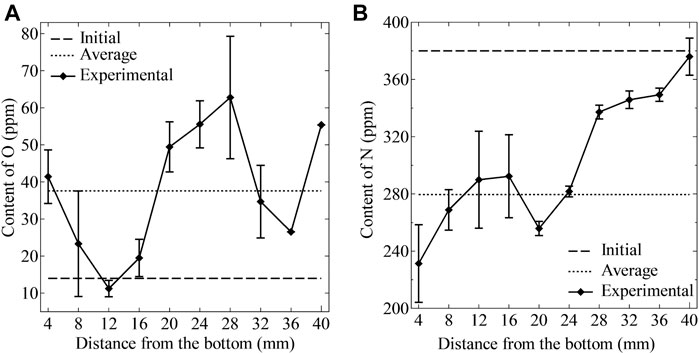
FIGURE 4. Contents of oxygen and nitrogen at different positions.
Figure 5A,B show the size and number density of AlN inclusions at different positions from the bottom of the experimental alloy. Due to the limitation of the measurement by image processing ImageJ program, the complex inclusions of Al2O3-AlN were considered as AlN inclusions. AlN inclusions were observed from the bottom to the position of 30 mm. Above 30 mm, the existence of AlN inclusions could not be confirmed by SEM-EDS and instead of the AlN inclusions, Al2O3 inclusions were observed. As can be seen from Figure 5A, the average sizes of AlN inclusions at different positions were largest at 2 mm (10.8 μm), gradually decreased, and smallest at 30 mm (2.17 μm). The largest AlN particle was observed at the position of 10 mm with a diameter of 26.65 μm. In contrast to the average size, the number density of AlN inclusions at 2 mm was the smallest, 6.76 mm−2. The differences in the average size from 6 to 22 mm were around 1 μm and this was the region where AlN inclusions were mostly distributed as can be seen from Figure 5B. The AlN inclusions were divided by sizes: 0–5, 5–10, 10–15, 15–20, 20–25, and larger than 25 μm. It can be seen that the large AlN inclusions (larger than 5 μm) were mostly distributed from 6 to 22 mm where AlN inclusions were also mostly distributed. At the position of 30 mm, the diameters of all AlN particles were less than 5 μm. There were gradient distributions of the average size and number density of AlN inclusions along the direction of the solidification in the experimental alloy. Shibata et al. (1998) reported that smaller and larger inclusions are likely to be pushed and engulfed by a solidified shell, respectively. Accordingly, smaller inclusions might transfer along the direction of solidification. This might be the cause of the decrease in the size of inclusions. Moreover, only small inclusions would form at the initial stage of solidification, such inclusions might be pushed to the upper region. Therefore, only a small amount of inclusions remained at the bottom of the sample. On the surface, the liquid phase was exposed directly to a nitrogen atmosphere, and thus the top region of the sample can be saturated by nitrogen during the unidirectional solidification experiment. As the content of nitrogen increases and exceeds the solubility in the liquid phase due to the segregation phenomenon, nitrogen gas was formed and became bubbles. The non-metallic inclusions can be entrapped by the bubbles and moved to the surface. As can be seen from Figure 4B, the content of nitrogen in the solidified sample significantly increases at higher than 24 mm from the bottom where the amount of AlN inclusions larger than 10 μm also significantly decreases. Therefore, the nitrogen bubbles can be considered as a reason for the decrease in the number density of AlN inclusions at the top of the solidified sample. It was also found that the size and amount of inclusions are almost constant in the range from 6 to 22 mm where AlN inclusions and complex inclusions of Al2O3-AlN were observed. In the region, the effect of pushing and nitrogen bubbles may be negligible. Therefore, the formation of the AlN inclusions and complex inclusions of Al2O3-AlN were discussed from the viewpoints of thermodynamics and microsegregation in Thermodynamic Analyses of Formation of Al2O3and AlN through Precipitation Conditions of AlN Inclusions in Fe-0.5Al-2.0Mn.
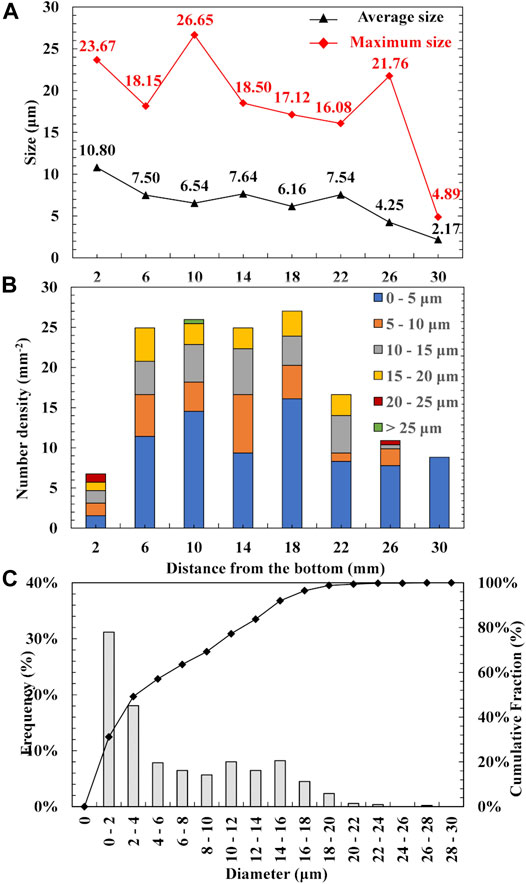
FIGURE 5. Size (A), number density (B) of AlN inclusions at different positions, diameter distribution of AlN inclusions in experimental sample (C).
The diameter distribution of AlN inclusions is shown in Figure 5C. The diameter of AlN inclusions was divided at 2 μm intervals. As can be seen from Figure 5C, there were many fine inclusions less than 4 μm, the cumulative frequency of which was 49.2%. The frequencies of AlN inclusions size in the range of 4–16 μm at 2 μm intervals were not significantly different, the cumulative frequency of which was 42.8%, whereas the cumulative frequency of AlN inclusions greater than 16 μm was 8.0%.
To describe the precipitation behavior of AlN inclusions during the solidification process, the formations of Al2O3, AlN, and N2 in liquid iron were calculated thermodynamically. The formation reactions of Al2O3, AlN, and N2 can be written as follows:
where
where
The activity coefficients in the above equations can be calculated by using Wagner’s formalism (Wagner, 1952) as follows:
where
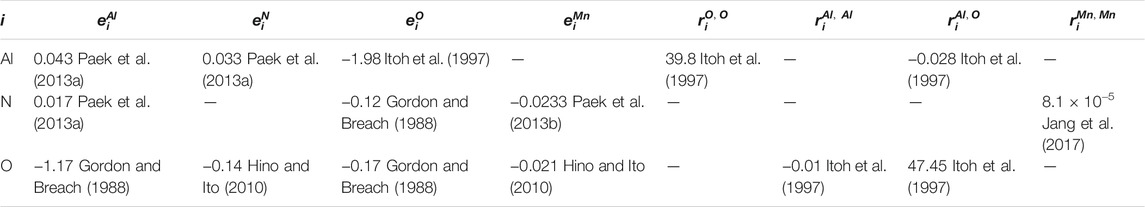
TABLE 2. First and second interaction parameters for the calculations of Al-N-O equilibrium in FeAlMn alloy at 1873K.
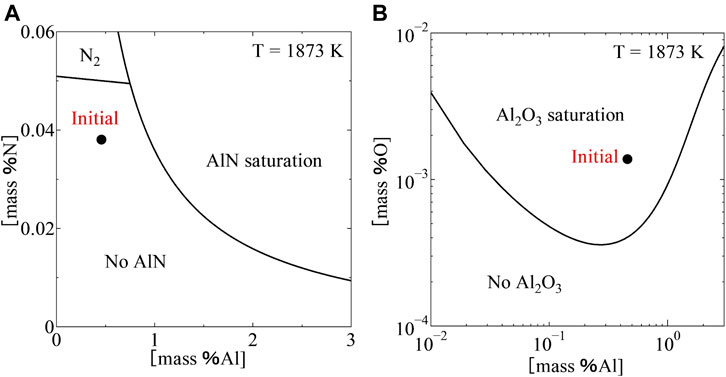
FIGURE 6. Equilibrium relation between (mass %Al) and (mass %N) (A), Equilibrium relation between (mass %Al), and (mass %O) (B), in Fe-Al-2.0Mn system at 1873 K.
As shown in Morphology of AlN Inclusions, the complex inclusions of Al2O3-AlN were also observed in the alloy. To describe the formation of the complex inclusions of Al2O3-AlN, the equilibrium relations between Al2O3 and AlN were calculated. Combining reactions Eqs. 1, 3, the following equations were obtained:
The equilibrium constant of reaction Eq. 14 can be rewritten similarly as the following equation:
Using Eqs. 10–13, 15, 17, the equilibrium relations between Al2O3 and AlN in the Fe-Al-2.0Mn system at different contents of Al were calculated and shown in Figure 7. The calculations showed that the content of Al has a large effect on the equilibrium between Al2O3 and AlN. At (
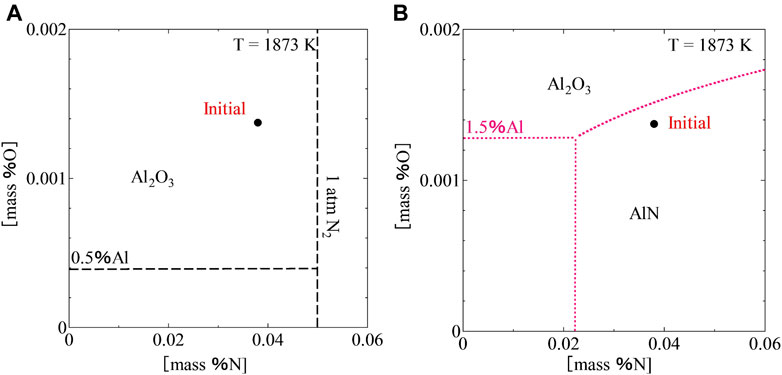
FIGURE 7. Equilibrium relation between Al2O3 and AlN at (mass %Al) = 0.5% (A), and 1.5% (B) in Fe-Al-2.0Mn system at 1873 K.
As mentioned in Thermodynamic Analyses of Formation of Al2O3and AlN, during the solidification process, the contents of solutes in the liquid phase are enriched due to the segregation phenomenon. The enriched contents of solutes can lead to the precipitation of new inclusions. In the present study, Clyne-Kurz’s equation (Clyne and Kurz, 1981) was used to calculate the contents of Al, O, and N in the liquid iron during the solidification process.
where
where
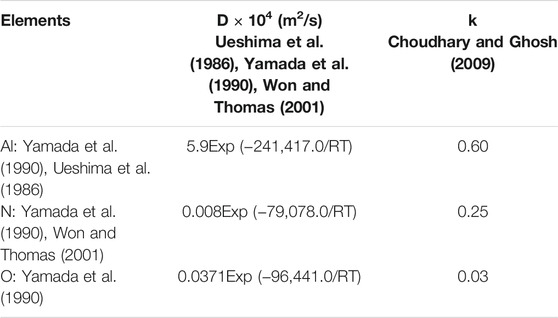
TABLE 3. Partition coefficients (k) and diffusion coefficients (D) in delta phase of solute elements.
The local solidification time can be calculated by the following equations:
The secondary arm spacing
where
During the solidification process, when the contents of Al, O, and N are enriched in the liquid phase, the precipitation of Al2O3 and AlN may occur simultaneously. Therefore, the order of precipitation of Al2O3 and AlN needs to be considered. The order of precipitation of Al2O3 and AlN was considered by calculating the Gibbs free energy change of reaction Eq. (14).
Based on the conditions of thermodynamic equilibrium, the order of precipitation of Al2O3 and AlN was considered as 3 cases as follows:
•
•
•
During the solidification process, as the dendrite grows into the melt, and as secondary arms spread from the main dendrite stem, the solute is rejected (Campbell, 2015). The solute is concentrated in tiny regions between secondary dendrite arms due to the microsegregation phenomenon. In the tiny regions, the microsegregation of solute can be calculated without considering the effect of the drop in temperature. Therefore, in the present study, the microsegregation of solutes was calculated at a constant temperature T = 1873 K. The content of solute in the liquid phase during the solidification process was calculated in a differential solid fraction,

FIGURE 8. A schematic illustration of the microsegregation model.
Figure 9 shows the variations of the concentrations of Al, O, and N in the liquid phase and solid phase during the solidification process. A path of variations of the concentrations of Al, N, and O in the liquid phase is shown in Figure 10A. It can be seen that the content of O in the liquid phase was strongly decreased to the equilibrium value due to the precipitation of Al2O3 at the beginning and increased gradually until the end of the solidification process. In contrast to the content of O, the content of N was increased gradually at the beginning. When the content of N exceeded the nitrogen solubility, N2 gas was formed in the liquid phase and the content of N in the liquid phase was decreased slightly due to the effect of the segregation of Al on the nitrogen solubility. When the content of Al was enriched high enough at
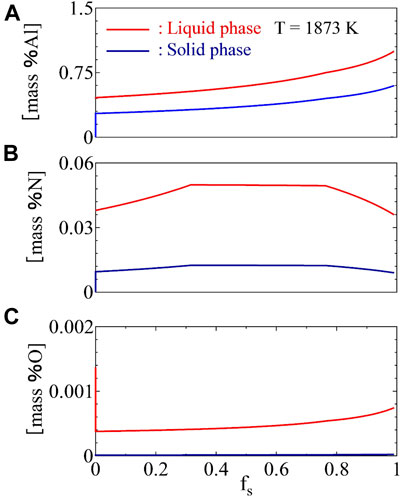
FIGURE 9. Variations of concentrations of Al (A), N (B), and O (C) in liquid phase during the solidification process.
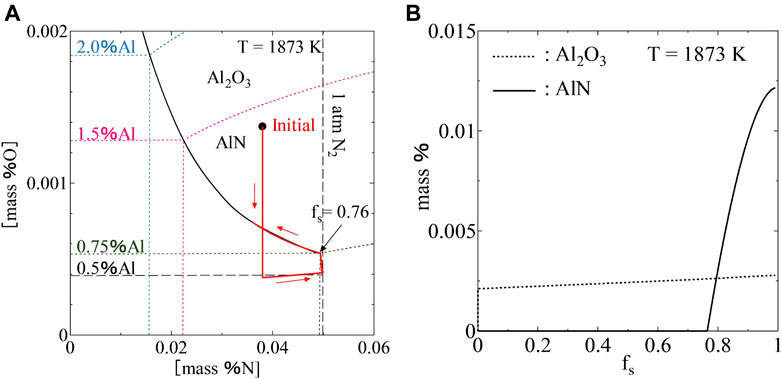
FIGURE 10. A path of variations of the concentrations of Al, N, and O in the liquid phase (A), precipitated amounts of AlN and Al2O3(B) during the solidification process.
The precipitated amounts of Al2O3 and AlN were calculated by considering the mass conservation of solutes in the liquid phase. The precipitated amounts of inclusions are proportional to the decreased amounts of solutes in the liquid phase. Figure 10B shows the precipitated amounts of Al2O3 and AlN during the solidification process. It was found that Al2O3 precipitated at the beginning of the solidification process. However, the precipitated amount of AlN was more than Al2O3 at the end of the solidification process.
According to the SEM-EDS observations, the complex inclusions of Al2O3-AlN were observed in the experimental alloy. The nucleation of AlN on Al2O3 can be understood by considering the lattice disregistry concept. Bramfiit (Bramfitt, 1970) suggested that inclusion can act as an effective nucleation site for a solid phase when the disregistry between the substrate and nucleated solid is less than 12%. Dovidenko et al. (1996) reported that the disregistry between (0001) AlN plane and (0001) Al2O3 is about 12%, which means that AlN can nucleate on Al2O3. Through the calculation of microsegregation shown above, the formation of the complex inclusions of Al2O3-AlN was described. A schematic illustration of the formation of the complex inclusions of Al2O3-AlN during the solidification process is shown in Figure 11. At the beginning of the solidification, Al2O3 inclusions precipitated because the initial contents of Al and O exceeded the equilibrium value. During the solidification process, the contents of Al, O, and N are enriched in the liquid phase due to the microsegregation phenomenon which leads to the precipitations and growths of Al2O3 and AlN inclusions. AlN inclusions precipitated when the contents of Al and N exceeded the equilibrium value and grew until the end of the solidification. Al2O3 inclusions can be considered as the nucleation core of the AlN inclusions during the solidification process.
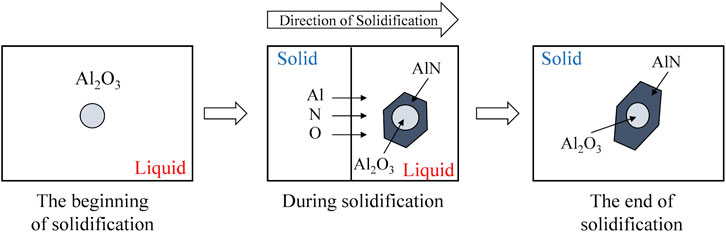
FIGURE 11. A schematic illustration of formation of complex inclusion of AlN-Al2O3 during the solidification process.
To control precipitation of AlN inclusions in the Fe-0.5Al-2.0Mn alloy, the thermodynamic analyses of the precipitations of AlN and Al2O3 inclusions were carried out by the method as shown in Precipitation Behavior of AlN Inclusions at the contents of Al = 0.5% and Mn = 2.0%. The content of O was varied in a range of 0–0.0015% at intervals of 0.00001% and the content of N was varied in a range of 0–0.06% at intervals of 0.0002%. Figure 12 shows the precipitation conditions of AlN inclusions in the Fe-0.5Al-2.0Mn alloy under the experimental conditions used in the present study. It was found that the precipitation of AlN inclusions can be controlled by reducing the initial content of N to less than 0.0072 mass%. The region without precipitation of AlN is represented by the dashed boundary in Figure 12. In this region, the only precipitation of Al2O3 inclusions may occur during the solidification process. When the contents of N are greater than 0.0072% and the contents of O are less than 0.00003%, the only precipitation of AlN may occur without the precipitation of Al2O3 represented by the dotted boundary in Figure 12. The precipitations of Al2O3 and AlN may occur simultaneously when the contents of O and N are greater than 0.00003 and 0.0072%, respectively.
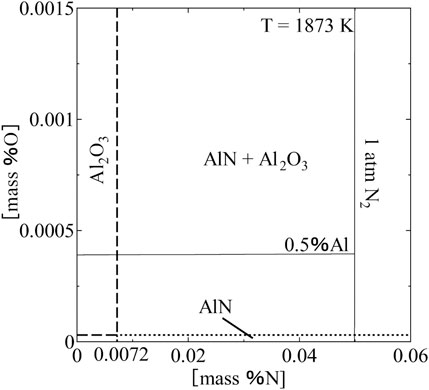
FIGURE 12. Precipitation conditions of AlN inclusions in Fe-Al-2.0Mn system.
The precipitation behavior of AlN inclusions during the solidification process in the Fe-0.5Al-2.0Mn alloy under an atmosphere of nitrogen was investigated. The conclusions are summarized as follows:
1) There are two types of nitride inclusion in the Fe-0.5Al-2.0Mn: AlN inclusion and complex inclusion of Al2O3-AlN. The planar sections of most AlN particles are hexagonal.
2) Based on the thermodynamic calculation, it was found that the content of Al has a large effect on the stability of Al2O3 and AlN. When the content of Al increases, the molten iron can be changed from saturated by Al2O3 to saturated by AlN. During the solidification process, Al2O3 inclusions precipitated at the beginning of the solidification process. The precipitation of AlN inclusions occurred when the contents of Al and N exceeded the equilibrium value and grew until the end of the solidification. Al2O3 inclusions can be considered as the nucleation core of the AlN inclusions during the solidification process.
3) The precipitation conditions of AlN inclusions in an Fe-0.5Al-2.0Mn alloy under the experimental conditions used in the present study were discussed. The precipitation and the amount of precipitate of AlN inclusions depend on the initial contents of Al, N, and O. It was found that the precipitation of AlN inclusions can be controlled by reducing the initial content of N to less than 0.0072 mass%.
The raw data supporting the conclusion of this article will be made available by the authors, without undue reservation.
HO contributed to the concept, design of the study. NN wrote the manuscript and carried out the experiments. NN and KK contributed to the thermodynamic calculation of the study. All authors contributed to manuscript revision, read and approved the submitted version.
This work was supported by the Grant-in-Aid for Scientific Research (B), Number 18H03405, from Japan Society for the Promotion of Science (JSPS).
The authors declare that the research was conducted in the absence of any commercial or financial relationships that could be construed as a potential conflict of interest.
All claims expressed in this article are solely those of the authors and do not necessarily represent those of their affiliated organizations, or those of the publisher, the editors and the reviewers. Any product that may be evaluated in this article, or claim that may be made by its manufacturer, is not guaranteed or endorsed by the publisher.
The authors would like to thank Hiroki Ito, graduate school of Science and Engineering, University of Toyama for his technical support in the experiments.
Bramfitt, B. L. (1970). The Effect of Carbide and Nitride Additions on the Heterogeneous Nucleation Behavior of Liquid Iron. Mt 1, 1987–1995. doi:10.1007/BF02642799
Campbell, J. (2015). “Complete Casting Handbook,” in Metal Casting Processes, Metallurgy, Techniques and Design. Second Edition, 163–222. doi:10.1016/B978-0-444-63509-9.00005-4
Choudhary, S. K., and Ghosh, A. (2009). Mathematical Model for Prediction of Composition of Inclusions Formed during Solidification of Liquid Steel. ISIJ Int. 49 (No.12), 1819–1827. doi:10.2355/isijinternational.49.1819
Clyne, T. W., and Kurz, W. (1981). Solute Redistribution during Solidification with Rapid Solid State Diffusion. Mta 12, 965–971. doi:10.1007/bf02643477
Diederichs, R., and Bleck, W. (2006). Modelling of Manganese Sulphide Formation during Solidification, Part I: Description of MnS Formation Parameters. steel Res. Int. 77, 202–209. doi:10.1002/srin.200606375
Dovidenko, K., Oktyabrsky, S., Narayan, J., and Razeghi, M. (1996). Aluminum Nitride Films on Different Orientations of Sapphire and Silicon. J. Appl. Phys. 79, 2439–2445. doi:10.1063/1.361172
El-Bealy, M., and Thomas, B. G. (1996). Prediction of Dendrite Arm Spacing for Low alloy Steel Casting Processes. Metall. Materi Trans. B 27, 689–693. doi:10.1007/bf02915668
Gordon, , and Breach, (1988). The 19th Committee on Steelmaking - Steelmaking Data Sourcebook. New York: J.S.P.S., 288.
Hino, M., and Ito, K. (2010). The 19th Committee On Steelmaking - Thermodynamic Data For Steelmaking. Japan: J.S.P.S., 261.
Igathinathane, C., Pordesimo, L. O., Columbus, E. P., Batchelor, W. D., and Methuku, S. R. (2008). Shape Identification and Particles Size Distribution from Basic Shape Parameters Using ImageJ. Comput. Electron. Agric. 63, 168–182. doi:10.1016/j.compag.2008.02.007
Ishii, F., Ban-ya, S., and Fuwa, T. (1982). Solubility of Nitrogen in Liquid Iron and Iron Alloys Containing the Group VIa Elements. Tetsu-to-Hagane 68, 946–955. doi:10.2355/tetsutohagane1955.68.8_946
Itoh, H., Hino, M., and Ban-ya, S. (1997). Assessment of Al Deoxidation Equilibrium in Liquid Iron. Tetsu-to-Hagane 83, 773–778. doi:10.2355/tetsutohagane1955.83.12_773
Jang, J.-M., Paek, M.-K., and Pak, J.-J. (2017). Thermodynamics of Nitrogen Solubility and AlN Formation in Multi-Component High Mn Steel Melts. ISIJ Int. 57, 1821–1830. doi:10.2355/isijinternational.isijint-2017-223
Kim, S., Kim, G., and Chin, K. (2008). Proceeding of the International Conference on New Developments in Advanced High-Strength Sheet Steels. Orlando, Fla: AIST, 249–256.
Matlock, D., Speer, J., Moor, E., and Gibbs, P. (2012). Recent Developments in Advanced High Strength Sheet Steels for Automotive: An Overview. JESTECH 15 (1), 1–12.
Mazzoli, A., and Favoni, O. (2012). Particle Size, Size Distribution and Morphological Evaluation of Airborne Dust Particles of Diverse Woods by Scanning Electron Microscopy and Image Processing Program. Powder 225, 65–71. doi:10.1016/j.powtec.2012.03.033
Paek, M.-K., Jang, J.-M., Do, K.-H., Pak, J.-J., and Pak, J. (2013). Nitrogen Solubility in High Manganese-Aluminum Alloyed Liquid Steels. Met. Mater. Int. 19, 1077–1081. doi:10.1007/s12540-013-5024-0
Paek, M.-K., Jang, J.-M., Kang, H.-J., and Pak, J.-J. (2013). Reassessment of AlN(s)=Al+N Equilibration in Liquid Iron. ISIJ Int. 53, 535–537. doi:10.2355/isijinternational.53.535
Shibata, H., Yin, H., Yoshinaga, S., Emi, T., and Suzuki, M. (1998). In-situ Observation of Engulfment and Pushing of Nonmetallic Inclusions in Steel Melt by Advancing Melt/Solid Interface. ISIJ Int. 38, 149–156. doi:10.2355/isijinternational.38.149
Tuling, A., Banerjee, J. R., and Mintz, B. (2011). Influence of Peritectic Phase Transformation on Hot Ductility of High Aluminium TRIP Steels Containing Nb. Mater. Sci. Techn. 27 (11), 1724–1731. doi:10.1179/1743284711Y.0000000013
Ueshima, Y., Mizoguchi, S., Matsumiya, T., and Kajioka, H. (1986). Analysis of Solute Distribution in Dendrites of Carbon Steel with δ/γ Transformation during Solidification. Mtb 17, 845–859. doi:10.1007/bf02657148
Won, Y.-M., and Thomas, B. G. (2001). Simple Model of Microsegregation during Solidification of Steels. Metall. Mat Trans. A. 32, 1755–1767. doi:10.1007/s11661-001-0152-4
Yamada, W., Matsumiya, T., and Ito, A. (1990). Proceeding Of the 6th International. Iron And Steel Congress. Tokyo: ISIJ, 618.
Keywords: solidification, AlN inclusions, precipitation behavior, continuous casting process, thermodynamics
Citation: NguyenVan N, Kato K and Ono H (2021) Precipitation Behavior of AlN Inclusions in Fe-0.5Al-2.0Mn Alloy Under Continuous Unidirectional Solidification Process. Front. Mater. 8:736284. doi: 10.3389/fmats.2021.736284
Received: 05 July 2021; Accepted: 17 August 2021;
Published: 03 September 2021.
Edited by:
Wangzhong Mu, Royal Institute of Technology, SwedenReviewed by:
Dali You, University of Leoben, AustriaCopyright © 2021 NguyenVan, Kato and Ono. This is an open-access article distributed under the terms of the Creative Commons Attribution License (CC BY). The use, distribution or reproduction in other forums is permitted, provided the original author(s) and the copyright owner(s) are credited and that the original publication in this journal is cited, in accordance with accepted academic practice. No use, distribution or reproduction is permitted which does not comply with these terms.
*Correspondence: Hideki Ono, b25vQHN1cy51LXRveWFtYS5hYy5qcA==
Disclaimer: All claims expressed in this article are solely those of the authors and do not necessarily represent those of their affiliated organizations, or those of the publisher, the editors and the reviewers. Any product that may be evaluated in this article or claim that may be made by its manufacturer is not guaranteed or endorsed by the publisher.
Research integrity at Frontiers
Learn more about the work of our research integrity team to safeguard the quality of each article we publish.