- 1School of Control Engineering, Northeastern University, Qinhuangdao, China
- 2Key Laboratory for Ferrous Metallurgy and Resources Utilization of Ministry of Education, Wuhan University of Science and Technology, Wuhan, China
Large amounts of pickling liquor are produced during the pickling of iron and steel. The Venturi reactor is used during the pyrolysis of pickling liquor to prepare high-purity Fe2O3 particles. Changing the pyrolysis conditions will affect the purity and concentration of Fe2O3 particles. In this paper, physical experiments and numerical simulations were carried out to study the effect of pyrolysis conditions on the Fe2O3 particles, including the pyrolysis temperature, the FeCl2/FeCl3 ratio in the pickling liquor, and the citric acid ratio. The results showed that a product with a higher purity, better crystallinity, and greater concentration was obtained at 923 K. Further increasing the temperature did not change the concentration of Fe2O3 particles. When the ratio of FeCl2/FeCl3 in the pickling liquor was 1:1.5, the maximum concentration of Fe2O3 particles at the outlet was obtained. When the added proportion of citric acid was 1:1, the particle size distribution was more uniform, and when the added proportion was 1:2.5, the maximum concentration of Fe2O3 particles at the outlet was achieved.
Introduction
The dense Fe2O3 formed on the surface of steel products during their production requires pickling, which produces 1.2–2 tons of pickling liquor per ton of steel (Zhang et al., 2014; Wang and Ma, 2017; Wang et al., 2020). HCl pickling liquor contains 1–5% HCl and 5–20% FeCl2/FeCl3, which causes severe environmental issues if discharged directly, as well as resource waste (Fang et al., 2010; Gao et al., 2021). In large iron and steel enterprises, the Ruthner spray pyrolysis method (Qi, 2006; Deng et al., 2007; Bian et al., 2015) is primarily used to process waste acid, in which FeCl2 and FeCl3 react with H2O and O2 to produce HCl and Fe2O3 particles. Nevertheless, this process has technical barriers and high investment costs. To decrease costs and increase the value of by-products, an in-depth study of the pyrolysis technique is needed. Sun et al. (2021) prepared the nanometer ferric oxide (Fe2O3 nanorod) by the hydrothermal method, the ferric nitrate nonahydrate (Fe(NO3)3·9H2O) was the source of ferric and the ethanol absolute and ethylenediamine were used as the surfactant. Effects of the reaction temperature and the mass fraction of Fe(NO3)3·9H2O on the particle size of the Fe2O3 nanorod were investigated. Zhang et al. (2020) prepared the α-nanometer Fe2O3 by microwave hydrolysis, FeCl3 was the raw material and the triethylenetetramine (TETA) was used as the coordination agent. Taniguchi (Izumi et al., 2007) synthesized LiMn2O4 particles with a hollow sphere morphology from a precursor solution using spray pyrolysis from a slurry solution and prepared spherical LiMn2O4 nanoparticles. Liu et al. (2018) designed a spray pyrolysis reactor using SiC and prepared MgO with an average particle size of 90 μm. They also studied parameters such as the pyrolysis temperature and feed quantity. Moreover, computational fluid dynamics (CFD) was used to simulate the spray pressure and temperature distribution in a pyrolysis furnace. Lv et al. produced a mixture of gases and solids with the Venturi reactor, which improved the pyrolysis efficiency and prepared spherical CeCl3 and Fe2O3 micro/nanoparticles (Lv et al., 2019a; Lv et al., 2019b; Lv et al., 2019c; Lv, 2019). Venturi reactor can enhance the mix of the gas and liquid, and solve the problem of Ruthner spray pyrolysis method that the nozzle needs to be replaced periodically. The simple structure and low investment of the Venturi reactor have resulted in its broad usage, but it is necessary to study it further. At present, there is a problem that the product particles are easy to accumulate and jam at the Venturi tube when the Venturi reactor is used for the pyrolysis reaction. Adding citric acid can well solve this problem. The carbon dioxide and water vapor are produced in the chemical reaction by citric acid. The gas-phase pressure can push the particles to flow to outlet, which prevents the jam at Venturi tube, increases the reaction efficiency and changes the morphology of the product particles.
This paper used a combination of experiments and numerical simulations to study the effects of temperature, pickling liquor composition, and citric acid ratio on the composition and morphology of Fe2O3 particles obtained at the outlet of a Venturi reactor. The effect on the Fe2O3 particle distribution in the reactor was also investigated. The results can be used to optimize the operating conditions of pyrolysis, as well as the pickling liquor, to provide a reference for the optimal design of Venturi reactors.
Experimental
Physical Experiments
A diagram of the equipment used in the jet pyrolysis experiments is shown in Figure 1. Oxygen was added by a high-speed air pump 1 into the Venturi reactor 4. The waste acid 2 mixed with citric acid, and then the mixed liquor dripped into the heating furnace 3. Pyrolysis occurred in the Venturi reactor 4. Next, the pyrolysis product Fe2O3 was collected by a particle collector, and tail gas was recovered by the alkali liquor in the recovery device 6. Venturi reactor is a place for evaporation, phase change and pyrolysis reaction. The reaction mechanism is not clear now, so the investigation of it should be focused on. Because of the mature separation technology of the gas and solid phase, we did not lay emphasis on it in this study. Employing the pyrolysis conditions summarized in Table 1 and O2, CO2, HCl(g), H2O(g), HCl(l), H2O(l), FeCl2, FeCl3, and Fe2O3 as the chemical species involved in the reactions. Physical parameters of the substances were obtained from the handbook of practical inorganic thermodynamic data (Ye and Hu, 2002).
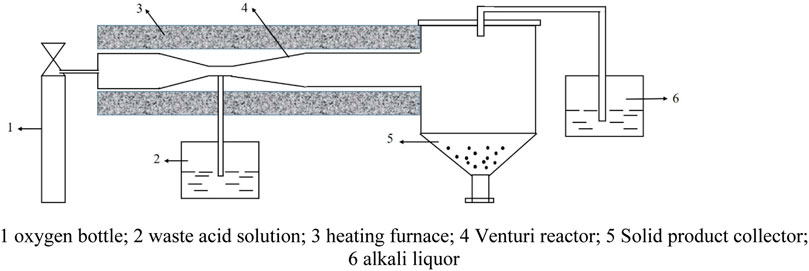
FIGURE 1. Diagram of equipment. 1 oxygen bottle; 2 waste acid solution; 3 heating furnace; 4 Venturi reactor; 5 Solid product collector; 6 alkali liquor.
Numerical Simulations
According to the Venturi reactor dimensions, a geometric model with identical proportions was created in SolidWorks 2016, and ICEM 19.0 was used to divide the geometric model into a structured grid with a quantity of 410′000 (Figure 2).
Eulerian multiphase model, standard k-ε turbulence model and SIMPLE algorithm were selected in Fluent 19.0, the control equations were differentially treated using the second-order upwind scheme, and all items were converged to 10–4 except for energy (to 10–6). The time step was set to 0.001 s, the computing time was 60 s and the simulation results were steady at the moment. The main reactions involved include:
Besides the mass conservation equation, momentum conservation equation and energy conservation equation, it also involved the chemical reaction equation:
where Yi is the mass fraction of the ith substance, Ri is the net produce rate of chemical reaction of the ith substance, Si is the discrete phase of the ith substance and it is also the extra produce rate caused by the user-defined source item, Ji is the diffusive flux of the ith substance produced by the concentration gradient.
As shown in Figure 2, the section on the left side in the horizontal direction of the jet reactor was set as the O2 inlet, the section on the right was the free outlet, and the section directly below the reactor in the vertical direction was the waste acid solution inlet.
Procedures
FeCl2 and FeCl3 solutions, each with a mass ratio of 10%, were prepared using deionized water, HCl, FeCl2 and FeCl3 solution (FeCl210%FeCl35%, FeCl210%FeCl37.5%, FeCl210%FeCl310%, FeCl210%FeCl312.5%, FeCl210%FeCl315%, the mass ratio of the two was 1:0.5, 1:0.75, 1:1, 1:1.25, and 1:1.5). Based on the prepared FeCl210%FeCl310% waste acid solution, a certain amount of citric acid was added to prepare a precursor solution with FeCl2: C6H8O7 mass ratios of 1:0.5, 1:1, 1:1.5, 1:2, and 1:2.5. FeCl2, FeCl3, HCl, and C6H8O7 were provided by Tianjin Fengchuan Chemical Reagent Technologies Co., Ltd. The real-time monitoring of the pyrolysis temperature was performed by the pyrolysis furnace. When the furnace reached the set temperature, the oxygen entered the Venturi reactor from the left inlet at a speed of 21.15 m/s under the carrier gas pressure, and the waste acid solution entered the Venturi reactor from the material inlet. The furnace temperature was set to 773, 873, 923, 973, 1023, and 1123 K, and the pyrolysis products Fe2O3 were collected at the cyclone separating unit.
Results and Discussion
Verification of Simulation Result
The boundary conditions are shown in Table 2. The basic standard conditions of the research are 10%FeCl2, 10%FeCl3, 5%HCl, 0%C6H8O7.
As shown in Table 3, the data results of Fe2O3 and CO2 at outlet of the two representative conditions: adding no citric acid and adding 10% citric acid were compared. The errors between the experimental results of the collected Fe2O3 and CO2 at the outlet and the numerical simulations was within 10%, which indicated the validity of the chosen model and the boundary conditions of the simulation. As shown in Figure 3, to further study the distribution of Fe2O3 in the reactor, five sections in the Venturi reactor were monitored.
Effects of Pyrolysis Temperature on the Pyrolysis Performance
The XRD phase analysis of products prepared under different pyrolysis temperatures was carried out from 10 to 80° at a scan rate of 7 °/min. As shown in Figure 4, the products prepared by jet pyrolysis under different temperatures all consisted of Fe2O3. Upon increasing the pyrolysis temperature, the intensity of the diffraction peak of (B-L) Fe2O3 first decreased and then gradually increased. The intensity of the diffraction peak of F −923 K was the smallest without an obvious peak of impurity phases, different crystal forms of Fe2O3 were possibly produced at 923 K.
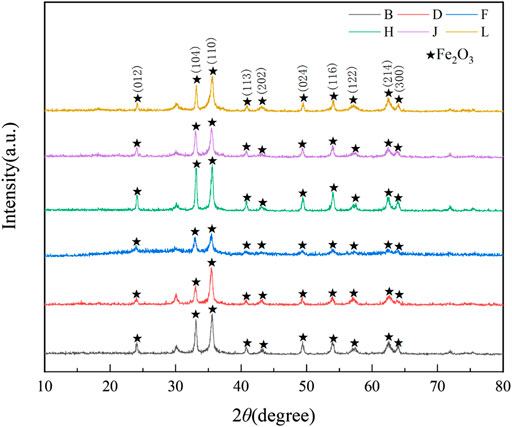
FIGURE 4. XRD patterns of the pyrolysis products obtained at different temperatures. B-773, D-873K, F-923K, H-973K, J-1023K, L-1123K.
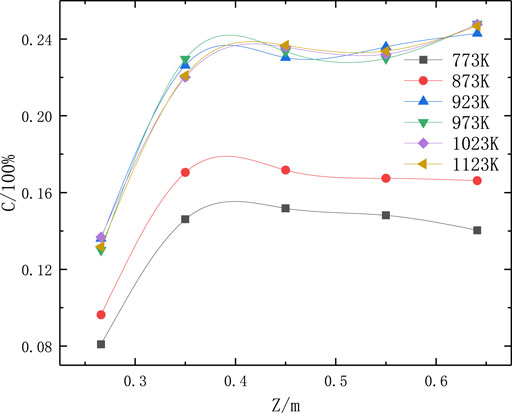
According to the numerical simulation results (Figure 5), the average Fe2O3 concentration on various monitored surfaces in the reactor increased significantly upon increasing the pyrolysis temperature. When the pyrolysis temperature reached 923 K, further increasing the pyrolysis temperature did not affect the average concentration of Fe2O3 particles significantly. This indicates that 923 K is the optimal pyrolysis temperature.
Effects of Pickling Liquor Composition on Pyrolysis
When the pyrolysis temperature reached 923 K, the XRD phase analysis of products prepared using different FeCl2/FeCl3 ratios in the pickling liquor was conducted, and the results are shown in Figure 6. The products prepared by jet pyrolysis under different FeCl2/FeCl3 ratios all consisted of Fe2O3. The height of the crystal face 104 and 110 changed. As the FeCl2/FeCl3 ratio increased, (B-J) Fe2O3 grew along different crystal faces. When FeCl2:FeCl3 = 1:1, the Fe2O3 with the least impurities among all the cases was obtained, with the strongest diffraction peak intensity.
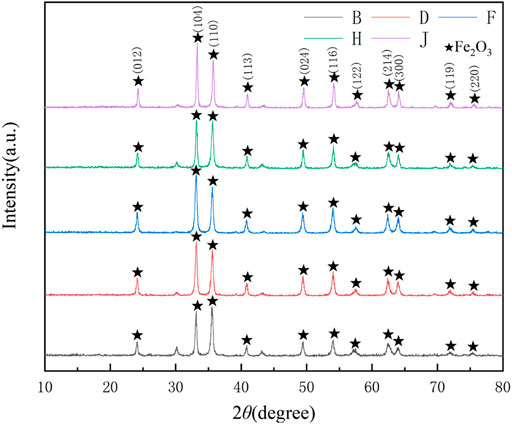
FIGURE 6. XRD patterns of the pyrolysis products obtained at different FeCl2/FeCl3 ratios. B-1:0.5, D-1:0.75, F-1:1, H-1:1.25, J-1:1.5.
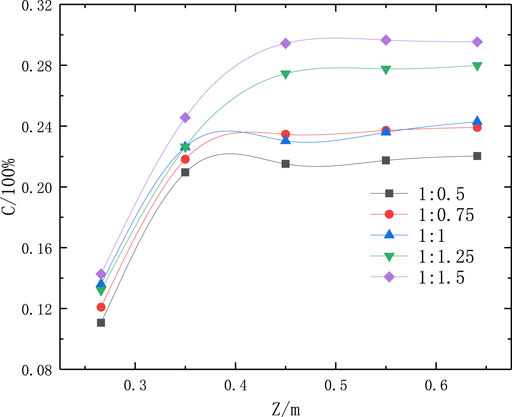
As shown in Figure 7, the Fe2O3 concentration in the reactor increased upon increasing the concentration of FeCl3 in the pickling liquor. When FeCl2:FeCl3 = 1:1.5, the maximum average Fe2O3 particle concentration on various monitored surfaces in the reactor was obtained. This was because upon increasing the FeCl3 concentration, the Fe ion content at the material inlet increased; thus, according to the law of conservation, the concentration of Fe2O3 particles at the outlet also increased.
Effects of the Citric Acid Ratio During Pyrolysis
When the pyrolysis temperature reached 923 K, FeCl2:FeCl3 = 1:1, the XRD phase analysis of products prepared with different proportions of citric acid was carried out, and the results are shown in Figure 8. Adding citric acid contributed to a sufficient pyrolysis reaction and a disappearing of impurity peak. The products prepared by jet pyrolysis using different citric acid ratios all consisted of Fe2O3. Upon changing the pickling liquor ratio, there was no obvious change in the intensity of the diffraction peak of (B-J) Fe2O3, and the addition of more citric acid had no obvious effect on the product purity.
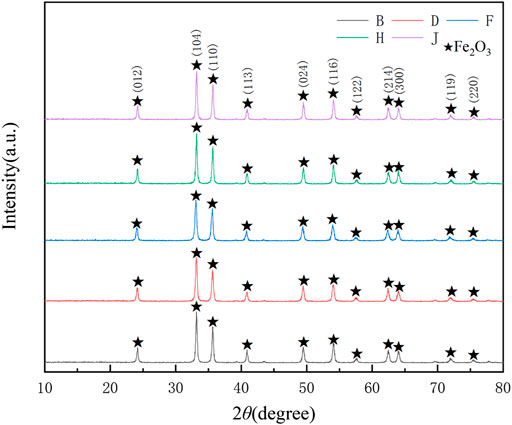
FIGURE 8. XRD patterns of the pyrolysis products obtained using different citric acid ratios. B-1:0.5, D-1:1, F-1:1.5, H-1:2, J-1:2.5.
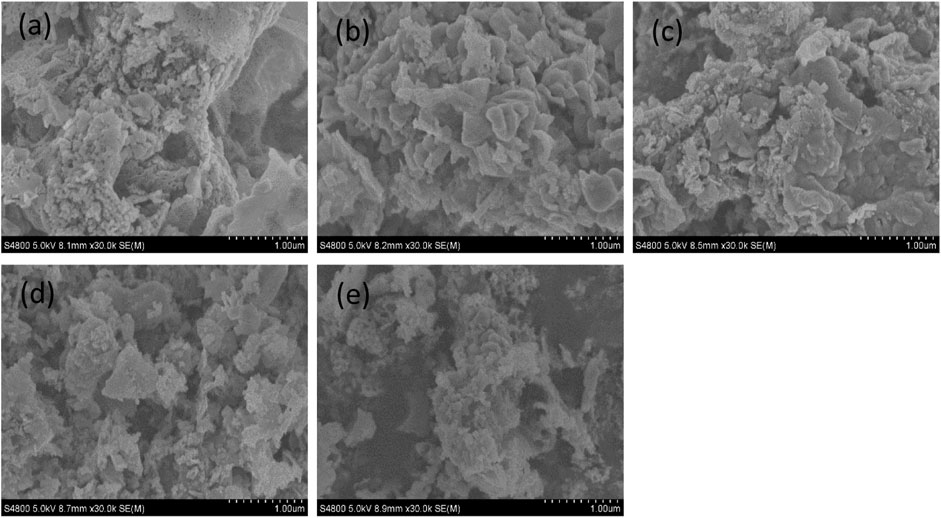
Figure 9 shows the SEM images of pyrolysis products using solutions with different citric acid ratios. As the citric acid ratio increased, the Fe2O3 particles aggregated and finally evolved into irregular sheets. This was because upon increasing the citric acid ratio, a great amount of gas was produced during the pyrolysis of citric acid under a high temperature, and the aggregated products exploded into fragments due to the gas pressure (Yang et al., 2017).
The integral area of each curve in Figure 10 is shown in Table 4. When the concentration of the citric acid changed, increasing the citric acid ratio did not obviously affect the total amount of Fe2O3 particles in the reactor because the addition of citric acid did not change the total amount of Fe ions at the material inlet. The added citric acid changed the Fe2O3 particle distribution in the reactor—at a higher citric acid ratio, less Fe2O3 appeared on the first half of the monitored surface, and a higher Fe2O3 content appeared on the second half. This was because a large amount of gas (CO2 and H2O) was produced during the pyrolysis of citric acid. The flow of this gas changed the distribution of particle products in the Venturi reactor, which caused the particle product content to decrease in the first half of the reactor, while the particle product content increased in the second half.
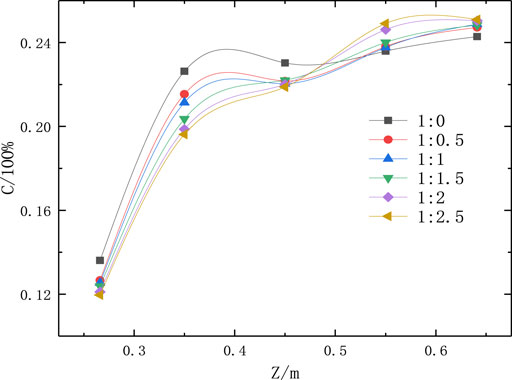
FIGURE 10. Average Fe2O3 concentrations on monitored surfaces in the reactor at different citric acid ratios.
Conclusion
As the pyrolysis temperature increased, the concentration of Fe2O3 particles in the reactor increased. At 923 K, the purity and concentration of Fe2O3 were maximized, and further increasing the pyrolysis temperature had negligible effects on the concentration of Fe2O3 particles at the outlet. When FeCl2:FeCl3 = 1:1, the Fe2O3 with the least impurities among all the cases was obtained. When FeCl2/FeCl3 = 1:1.5, the concentration of Fe2O3 particles at the outlet was maximized. The ratio of citric acid possibly changed size distribution of Fe2O3 particles and their distribution in the reactor. When the ratio of FeCl2/C6H8O7 was1:1, the size distribution of Fe2O3 particles was homogeneous, and when the ratio of FeCl2/C6H8O7 was1:2.5, the concentration of Fe2O3 particles at the outlet was maximized.
Data Availability Statement
The raw data supporting the conclusion of this article will be made available by the authors, without undue reservation.
Author Contributions
CL: Conceptualization, Funding acquisition, Project administration; M-HS: Data curation, Writing—original, draft; H-XY: Software.
Funding
This research was supported by the National Natural Science Foundation of China (51904069), the open fund of the Key Laboratory of iron and steel metallurgy and resource utilization of Wuhan University of science and technology (FMRU19-1), the Scientific Research Fund project of Northeastern University at Qinhuangdao (XNY201808), the Natural Science Foundation of Hebei Province of China (E2019501085).
Conflict of Interest
The authors declare that the research was conducted in the absence of any commercial or financial relationships that could be construed as a potential conflict of interest.
Publisher’s Note
All claims expressed in this article are solely those of the authors and do not necessarily represent those of their affiliated organizations, or those of the publisher, the editors and the reviewers. Any product that may be evaluated in this article, or claim that may be made by its manufacturer, is not guaranteed or endorsed by the publisher.
References
Bian, X., Wang, Z. F., Wang, J. Y., and Wu, W. (2015). Preparation of Lanthanum Hydroxide by Spray Pyrolysis of Lanthanum Chloride. J. Northeast. Univ. (Natural Science) 7, 966–969. doi:10.3969/j.issn.1005-3026.2015.07.012
Deng, X. R., Hu, G. R., Peng, Z. D., and Yoon, S. G. (2007). Spherical (Y, Gd) BO3: Eu Phosphor Particles Prepared by Spray Pyrolysis. J. Chin. Rare Earth Soc. 2, 167–171. doi:10.3969/j.issn.1000-4343.2007.02.0167.05
Fang, Z. Q., Qiu, X. H., Chen, J. H., Kim, E. J., and Chang, Y. S. (2010). Degradation of the Polybrominated Diphenyl Ethers by Nanoscale Zero-Valent Metallic Particles Prepared from Steel Pickling Waste Liquor. Desalination 1, 34–41. doi:10.1016/j.desal.2010.09.003
Gao, J.-m., Du, Z., Ma, S., Cheng, F., and Li, P. (2021). High-efficiency Leaching of Valuable Metals from Saprolite Laterite Ore Using Pickling Waste Liquor for Synthesis of Spinel-type Ferrites MFe2O4 with Excellent Magnetic Properties. J. Mater. Res. Tech. 10, 988–1001. doi:10.1016/j.jmrt.2020.12.063
Izumi, T., Norifumi, F., and Muxina, K. (2007). Synthesis of Spherical LiMn2O4 Microparticles by a Combination of spray Pyrolysis and Drying Method. Powder Tech. 3, 228–236. doi:10.1016/j.powtec.2007.05.011
Liu, Y. T., Liu, F. Z., and Du, W. (2018). Preparation of Magnesium Oxide from Bischofite by Spray Pyrolysis. J. Mater. Sci. Eng. 6, 1010–1015. doi:10.14136/j.cnki.issn1673-2812.2018.06.028
Lv, C. (2019). Numerical Simulation on the Recovery Process of Acid Pickling Waste Liquor by Jet-Flow Pyrolysis. JOM 71, 4944–4949. doi:10.1007/s11837-019-03827-8
Lv, C., Zhang, T.-A., Dou, Z.-H., and Zhao, Q.-Y. (2019a). Numerical Simulation of Preparation of Ultrafine Cerium Oxides Using Jet-Flow Pyrolysis. Rare Met. 38, 1160–1168. doi:10.1007/s12598-019-01337-9
Lv, C., Zhang, T. A., Dou, Z., and Zhao, Q. (2019b). Simulation of Process and Reactor Structure Optimization for CeO2 Preparation from Jet-Flow Pyrolysis. JOM 71, 1660–1666. doi:10.1007/s11837-019-03397-9
Lv, C., Zhang, T. A., and Hao, B. (2019c). Simulation of the Scale-Up Process of a Venturi Jet Pyrolysis Reactor. Metals 9, 979–987. doi:10.3390/met9090979
Qi, F. X. (2006). Research on Rare Earth Dopted Yttrium Aluminum Garnet Phosphor Synthesized by Spray Pyrolysis. Nanjing: Nanjing University of Eechnology. [dissertation/master’s thesis].
Sun, T. H., Hao, S. J., Jiang, W. F., and Zhang, Y. Z. (2021). Preparation and Morphology Analysis of Nano-Sized Iron Oxide. Powder Metall. Tech. 1, 76–80. doi:10.19591/j.cnki.cn11-1974/tf.2019080008
Wang, J. G., and Ma, Q. (2017). Harmless Disposal and Resource Utilization of Pickling Waste Liquid from Iron and Steel Plant. Shandong Chem. Industry 21, 184–185. doi:10.19319/j.cnki.issn.1008-021x.2017.21.075
Wang, S. S., Huang, S. W., and Lu, Y. C. (2020). Analysis and Research on Hydrochloric Acid Pickling Waste Liquid in Iron and Steel Plant. J. Beibu Gulf Univ. 2, 25–28. doi:10.19703/j.bbgu.2096-7276.2020.02.0025
Yang, G. S., Bian, X., and Cui, L. X. (2017). Study on Preparation of Nano Cerium Oxide Powder by Spray Roasting of Cerium Chloride Solution. Chin. Rare Earths 1, 72–78. doi:10.16533/J.CNKI.15-1099/TF.201701013
Ye, D. L., and Hu, J. H. (2002). Handbook of Practical Inorganic Thermodynamic Data. Beijing: Metallurgical industry press.
Zhang, R. Z., Hu, Q. H., Pei, Y. W., and Song, X. (2014). Resources Utilization of Hydrochloric Pickling Waste Liquor by Technology of Salt-Added Distillation and Coagulant Preparation. Chin. J. Environ. Eng. 11, 4782–4787. doi:10.7513/j.issn.1004-7638.2020.03.020
Keywords: pickling liquor, pyrolysis, Fe2O3, particles, numerical simulation
Citation: Lv C, Sun M-H and Yin H-X (2021) The Effect of Pyrolysis Conditions on the Preparation of Fe2O3 Particles Using Simulated Pickling Liquor in a Venturi Reactor. Front. Mater. 8:733257. doi: 10.3389/fmats.2021.733257
Received: 30 June 2021; Accepted: 03 August 2021;
Published: 13 August 2021.
Edited by:
Wangzhong Mu, Royal Institute of Technology, SwedenReviewed by:
Yuming Wen, Royal Institute of Technology, SwedenFengqin Liu, University of Science and Technology Beijing, China
Zongliang Zhang, Central South University, China
Copyright © 2021 Lv, Sun and Yin. This is an open-access article distributed under the terms of the Creative Commons Attribution License (CC BY). The use, distribution or reproduction in other forums is permitted, provided the original author(s) and the copyright owner(s) are credited and that the original publication in this journal is cited, in accordance with accepted academic practice. No use, distribution or reproduction is permitted which does not comply with these terms.
*Correspondence: Chao Lv, bHZjaGFvQG5ldXEuZWR1LmNu
 Chao Lv
 Ming-He Sun1


