- 1School of Materials Science and Engineering, South China University of Technology, Guangzhou, China
- 2Science and Technology on Thermostructural Composite Materials Laboratory, School of Materials Science and Engineering, Northwestern Polytechnical University, Xi’an, China
- 3MSEA International Institute for Materials Genome, Gu’an, China
- 4School of Mechanical Engineering, Southwest Jiaotong University, Chengdu, China
- 5School of Mechanics and Engineering, Southwest Jiaotong University, Chengdu, China
- 6Laboratoire de Mécanique et d’Energétique, Université d’Evry, Evry, France
A dual-scale model is proposed to study the effect of microstructure parameters (grain size and grain boundary fracture energy) on the thermal shock damage mechanism on an example of alumina. At microscale, representative volume element (RVE) models generated by Voronoi tessellation are simulated to obtain the mechanical parameters for macro models. At macroscale, a coupled thermomechanical model based on the finite–discrete element method (FDEM) is applied to simulate the crack nucleation and propagation. Energy dissipation (ALLDMD) is introduced to investigate the thermal shock cracking mechanism by combining crack patterns and crack density, which indicates that decreasing grain size and increasing grain boundary fracture energy have a positive effect on thermal shock resistance. The proposed models not only predict the critical stress temperature which is well consistent to the theoretical thermal shock resistance factor, but also quantify the two previously unconsidered stages (crack nucleation and crack instability stage). Our models suggest the crack nucleation and instability will not occur immediately when the model reaches critical stress, but the models can sustain for higher temperature difference. The thermal shock damage mechanism and the influence of microstructural parameters on thermal shock resistance have also been discussed in detail.
Introduction
Ceramic materials, with high melting point, hardness and low thermal conductivity, are widely applied in the field of machinery, aerospace and civil engineering due to their excellent performance at elevated temperature, such as Al2O3, ZrO2, ZrB2, and HfB2 (Singh et al., 1981; Opeka et al., 1999; Panda et al., 2002; Schmitt et al., 2002; Jiang et al., 2012; Shao and Song, 2017; Qian et al., 2018; Zhang et al., 2018; Li et al., 2014). However, under the condition of sudden temperature variations such as sharp thermal gradients under extreme aerodynamic conditions in hypersonic flight, ceramics are particularly vulnerable to damage for their inherent brittleness and weak thermal shock resistance (TSR) (Kingery, 1955; Bahr et al., 1988; Jin et al., 2018). Therefore, a thorough understanding of the mechanism of crack initiation and propagation during the thermal shock contributes to correctly evaluate and improve the thermal shock resistance of ceramics.
Cooling test is widely used for the evaluation of thermal shock resistance of ceramics (Levine and Opila, 2002; Han et al., 2008; Zhang et al., 2008; Zimmerman et al., 2008; Shao et al., 2010; Shao Zhang, 2011; Wu and jiang, 2015). Directly observing the crack pattern caused by the cooling test is a common method to evaluate the thermal shock resistance (Vandeperre et al., 2001; Shao et al., 2010; Song et al., 2010; Shao and Zhang, 2011; Li et al., 2015a). Research studies on the thermal-induced stress field indicate that, during the process of cold shock, tensile stress is observed near the boundary of the samples and compressive stress in the interior of the samples (Bahr et al., 1987; Lu and Fleck, 1998). Bahr et al. (1986) studied the crack patterns of the preheated quartz and the glass plates after water quenching, and simulated the crack propagation by multiple-crack models. Liu and Wu (2015) investigated the crack pattern distribution of thin circular ceramic samples at different temperatures, but the crack nucleation and propagation are difficult to be observed in experimental research. Wu and Jiang (2015) examined the size effect of thermal shock crack patterns in ceramics, and they found that the crack length and length hierarchy were strongly size dependent, while crack spacing was size independent. Jin et al. (2018) investigated the quenching crack patterns in the shape of sharp leading edge (SLE) or alike. They found that the specimen length and width had a large influence on transverse crack. Higher temperature difference led to more transverse cracks, while wider width of the specimen mainly led to longitudinal cracks.
In addition to experiments, plentiful theoretical models are also constructed to analyze the thermal shock crack pattern. Kingery (1955) proposed the critical stress fracture theory based on the thermoelastic stress analysis. Jagla (2002) proposed a theory combining stress analysis and energy analysis to study the crack initiation and propagation in thin slabs. However, it is still difficult to observe crack nucleation and propagation in the experiment, for crack evolution is very rapid and complex. Only the crack pattern can be obtained after the cooling test. In addition, Hasselman (1969) defined “thermal shock crack stability” as a parameter. Awaji et al. (1993) proposed the thermal shock fracture toughness using an infrared radiation heating method. Yoshihiro and Hiroshi (1995) defined a thermal shock parameter Rc which corresponds to fracture toughness. It is important to establish an evaluation method of thermal shock properties by a cooling test.
Compared to the experiments, numerical simulation is an effective method to analyze the mechanism of thermal shock failure by observing crack nucleation and evolution in situ. Li et al. constructed a nonlocal fracture model to simulate the crack initiation and propagation for brittle or quasi-brittle materials by the finite element method (Li et al., 2013; Li et al., 2015b). Their results indicated the experimental crack pattern can be faithfully reproduced by the constructed model. Giannakeas et al. (2017) developed a bond-based peridynamic model to simulate the thermal shock cracking of polycrystalline alumina. The accuracy of the simulation was improved after introducing the temperature-dependent material parameters. Li et al. (2018) adopted subroutine USDFLD in ABAQUS to simulate the thermal shock crack pattern. In addition to temperature dependent material parameters, they also considered the influence of thermal conductivity of cracks on the global temperature field. Yan et al. (2020) used the finite–discrete element method (FDEM) coupled with a thermomechanical model to study the thermal shock cracking. They investigated the influence of initial temperature, thermal conductivity, and heat transfer coefficient on thermal shock resistance by observing the crack pattern.
Most of the studies about thermal shock cracking simulation in the literature mainly focus on the influence of parameters such as temperature difference and heat transfer coefficient on crack patterns to evaluate thermal shock property of materials. However, few simulation research studies pay attention to the influence of microstructure parameters of materials on the thermal shock property. Besides, the mechanism of crack initiation and propagation behavior caused by thermal shock is still unclear, though some research shows the crack evolution of thermal shock by simulation. Therefore, in our study, energy dissipation of thermal shock simulation is introduced to investigate the mechanism of crack nucleation and propagation on an example of alumina. Crack pattern and crack density are also used to evaluate the thermal shock resistance. Besides, in this article, the thermal shock resistance factor and the temperature difference of crack nucleation and instability calculated by the model have also been discussed to further comprehend the damage mechanism mainly caused by the temperature gradient. In addition, to consider the influence of microstructure parameters, such as grain size and grain boundary fracture energy on thermal shock, a dual-scale model was constructed. The fracture failure behavior is described by the finite–discrete element method (FDEM).
Model
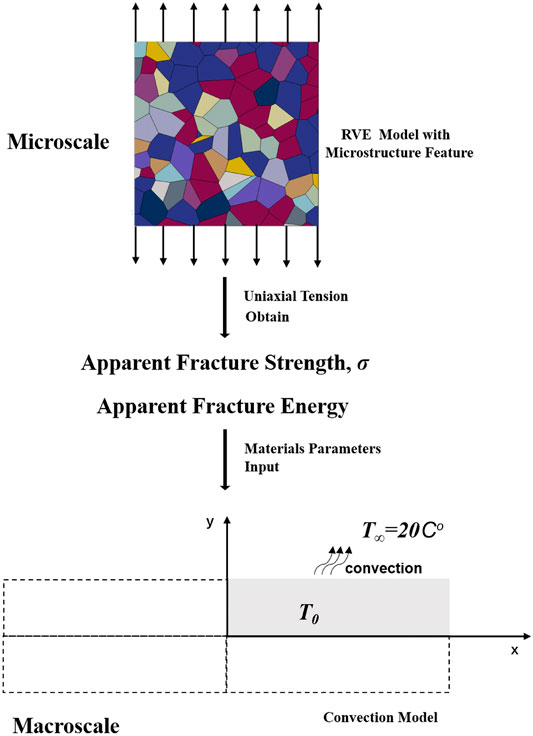
In this article, a dual-scale model was constructed to investigate the influence of microstructure parameters on the thermal shock of the material as shown in Figure 1. In step one, apparent fracture strength and apparent fracture energy were obtained from RVE models by uniaxial tensile loading at microscale; in step two, the apparent fracture strength and energy will be the input to macroscale model for thermal shock simulation. T0 is the temperature of model, and T∞ is the cooling environmental temperature. In our simulation, alumina was taken as an example, and the mechanical parameters are listed in Table 1.
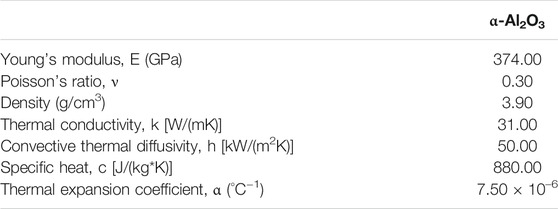
TABLE 1. Reference values of model parameters (Li et al., 2013).
In addition, to obtain the average properties as the input data of the macroscale model, calculation of the RVE model at the microscale was based on the following assumptions (Ehre and Chaim, 2008; Gaida et al., 2017; Ryou et al., 2018):
1) Each grain is isotropic with the same material parameter.
2) The inverse Hall–Petch effect was not considered since the grain size is larger than 70 nm in our simulation, which is larger than the critical grain size.
3) Based on assumption 2, grain boundary fracture energy is an effective or mean value and assumed to be a constant when the effects of other variables are studied.
4) For parametric analysis, the grain boundary fracture energy is temperature independent.
Microscale Representative Volume Element Model
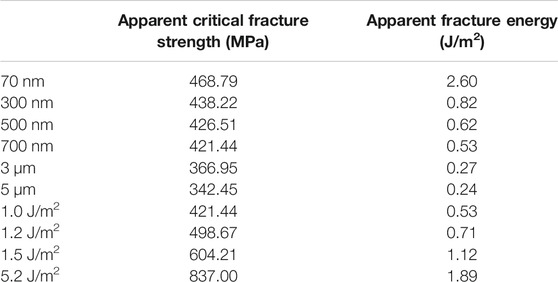
In microscale, the representative volume elements (RVEs) containing microscopic morphological features were constructed by Voronoi tessellations (Fortune, 1997) using python in ABAQUS, as shown in Figure 1. The cohesive zone model (CZM) (Dugdale, 1960; Barenblatt, 1962; Needleman, 1990) was applied to simulate the crack initiation and propagation in the RVE model. The detail construction method of the RVE model can be found in our previous work (Gong et al., 2020). To build a connection between the RVE model and the macroscale model, as Figure 1 shown, the mechanical parameters for the macroscale model were obtained from RVE models. Therefore, RVE models with grain sizes of 70 nm, 300 nm, 500 nm, 700 nm, 3 μm, and 5 μm under 1 J/m2 and a grain boundary fracture energy of 1, 1.2, 1.5, and 5.2 J/m2 under 700 nm grain size were simulated, respectively, under the unidirectional tensile load to obtain apparent critical fracture strength and apparent fracture energy. Our previous work (Gong et al., 2020) had calculated the mechanical parameters of these RVE models, and the apparent fracture strength and apparent fracture energy are listed in Table 2.
Macroscale Model and Finite–Discrete Element Method
At present, the numerical methods for crack simulation have their own advantages. Based on the principle of energy minimization (Francfort and Marigo, 1998), the phase-field can simulate a series of fractures from crack initiation to crack propagation naturally. The phase-field does not require additional fracture criteria or complex crack topological tracing techniques to deal with multi-cracks. But the phase-field needs fine mesh to obtain the gradient term of the crack accurately, and introduces an additional degree of freedom; thus, it increases the dimension of the problem and requires high computational resources. Moreover, the crack tip cannot be accurately described when the length scale is large. When compared with the conventional FEM, XFEM (Belytschko and Black, 1999) is an extension based on the concept of partition of unity by incorporating the local enrichment function into a finite element approximation (Melenk and Babusuka, 1996). In the XFEM, the discontinuous crack characteristics are independent of the finite element mesh and do not require remeshing. However, it is still difficult to predict crack initiation and propagation direction. For dynamic fracture, it is still unable to characterize the important parameters such as crack growth rate accurately. The finite–discrete element method (FDEM) proposed by Munjiza et al. (1999), Munjiza and Andrews (2000), and Munjiza et al. (2004) was used to simulate the crack pattern caused by thermal shock. This techniques combines discrete element method (DEM) algorithms, which capture the interaction and fracturing of different solids with continuum mechanics principles, that describe the elastic deformation of discrete bodies. Generalized Hooke’s law is used to solve Cauchy stress in discrete elements, which avoids the problem caused by matrix singularity and complex stiffness matrix. Thus, it is an effective method to simulate multiple crack growth in brittle materials in this case.
As shown in Figure 1, a model with 50 mm length and 10 mm width was constructed to simulate the thermal shock cracking. Figure 2 illustrates the basic principle of the FDEM, in which each solid is discretized as a mesh consisting of nodes and triangular elements. Between the triangular elements, a joint element with no thickness is inserted, which are used to simulate the crack initiation and propagation. The fracture criterion can be divided into mode I (tensile fracture), mode II (shear fracture), and mode III (mixed fracture). Figure 2A shows the basic principle of mode I (tensile fracture). Similar to the cohesive model, as the normal opening amount O reaches the critical value Op, the bond stress σ of the cohesive element is equal to the tensile strength ft. When the crack propagates and the normal opening amount increases, the normal bonding stress σ decreases until the normal opening amount equal to the maximum value Or. In this case, the damage factor can be defined as follows (Munjiza and Andrews, 1998; Munjiza et al., 1999; Munjiza and Andrews, 2000; Munjiza et al., 2004; Lisjak et al., 2013; Yan et al., 2020):

FIGURE 2. Basic principle of FDEM (Munjiza et al., 1999; Munjiza and Anderws, 1998).
From Figure 2B, it can be seen that as the tangential slip amount s reaches the critical value Sp, the tangential bond stress t increases to shear strength f. When the tangential slip amount s continues to increase, the tangential bond stress decreases until the tangential slip amount s is equal to the maximum slip amount Sr. Then the elements are deleted and the shear crack is generated. In this mode, the damage parameter can be defined by the following equation (Munjiza and Andrews, 1998; Munjiza et al., 1999; Munjiza and Andrews, 2000; Munjiza et al., 2004; Lisjak et al., 2013; Yan et al., 2019):
For mode III (mixed mode) in Figure 2C, for the mode III (mixed mode), the damage parameter between crack opening and slip can be defined by (Munjiza and Andrews, 1998; Munjiza et al., 1999; Munjiza and Andrews, 2000; Munjiza et al., 2004; Lisjak et al., 2013; Yan et al., 2019)
From an energetic point of view, crack propagating means the energy dissipated during the fracturing process. The total strain energy release rate, Gc, is related to the amount of energy absorbed per unit crack length and obtained by integration of the stress-softening curve. In terms of material properties, Gc represents GIc and GIIc, respectively, which correspond to the strain energy release rates for mode I and mode II, respectively. They can be expressed as follows (Munjiza and Andrews, 1998; Munjiza et al., 1999; Munjiza and Andrews, 2000; Munjiza et al., 2004; Lisjak et al., 2013; Yan et al., 2019):
Coupled Thermomechanical Model
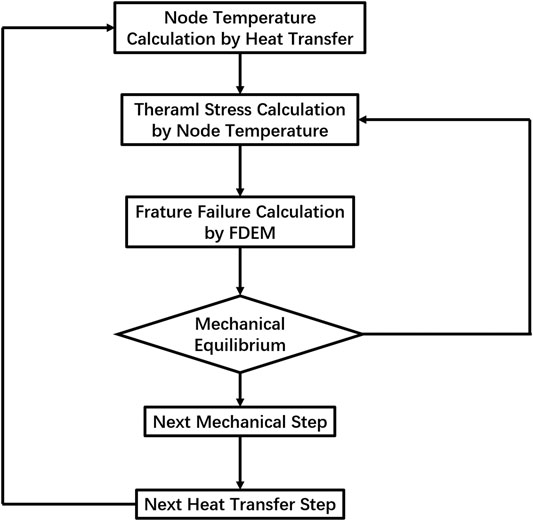
Sequentially coupled thermomechanical model was used to analyze the thermal shock behavior of ceramic in our study. There are three steps in thermal shock cracking using sequentially coupled thermal-stress analysis. The first step is node temperature calculation caused by heat transfer. The second is thermal stress calculation caused by node temperature. The last step is thermal shock crack nucleation and propagation caused by thermal stress. To solve the convergence problem, each time multiple mechanical calculations are performed after a heat transfer calculation until the mechanical equilibrium is reached, and Figure 3 shows the sequentially coupled thermomechanical flow chart.
In the sequentially coupled thermomechanical model, node thermal stress caused by temperature variation can be given by
where
Thermal Boundary Condition
For the macroscale model, the convective boundary condition was applied in the macroscale model shown in Figure 1, and symmetric constraints are applied to the boundary lines. The boundary of the samples is in contact with the external environment. For the temperature difference existing between the solid and external environment, convective transfer heat will happen at the interface. We assumed that the sample and external environment temperature at the interface are
Thus, the node temperature of boundary can be updated by
where
Result and Discussion
The Effect of Grain Size on Thermal Shock Resistance
For convenience, macroscale models are named by their corresponding average grain size. Figure 4 shows the crack pattern using the apparent mechanical parameters calculated by RVE models with T0 = 800°C. For convenience, the macroscopic model will be named by its related grain size. The final crack patterns are shown in Supplementary Figure S1 in the supplementary file, which is similar to the reported experiment result (Qi and Meng, 2019). Many branches were observed and the crack eventually grew into a net structure. This may be related to fractal damage of fracture mechanics. The fractal dimension of the fracture surface is related to the fracture toughness (Mecholsky et al., 1989). Besides, some research showed that the fracture process has self-similarity and is fractal, and the morphology and size distribution of microcracks also show self-similarity (Barenblatt and Botvina, 1986; Barenblatt, 1993). The main features such as periodic long and short cracks are hard to distinguish to evaluate thermal shock resistance. Therefore, the following discussion will focus on the evolution of crack growth and the change in energy during the evolution. When the step time is 1.7199 E−2, crack nucleation is not observed in the model with 70 nm grain size, while in the other models, multicrack propagation can be observed. Until the step time goes to 3.1621 E−2, multicracks propagate in the 70-nm models while multicracks have propagated in other models. In addition, there are 10 cracks in the 70-nm model in the X direction which is less than those in the other models. Compared to the submicron models (300, 500, and 700 nm), the number of shock cracks between long cracks increased obviously in the 3- and 5-μm model. The above two points indicate that the 70-nm grain size model has better thermal shock resistance.
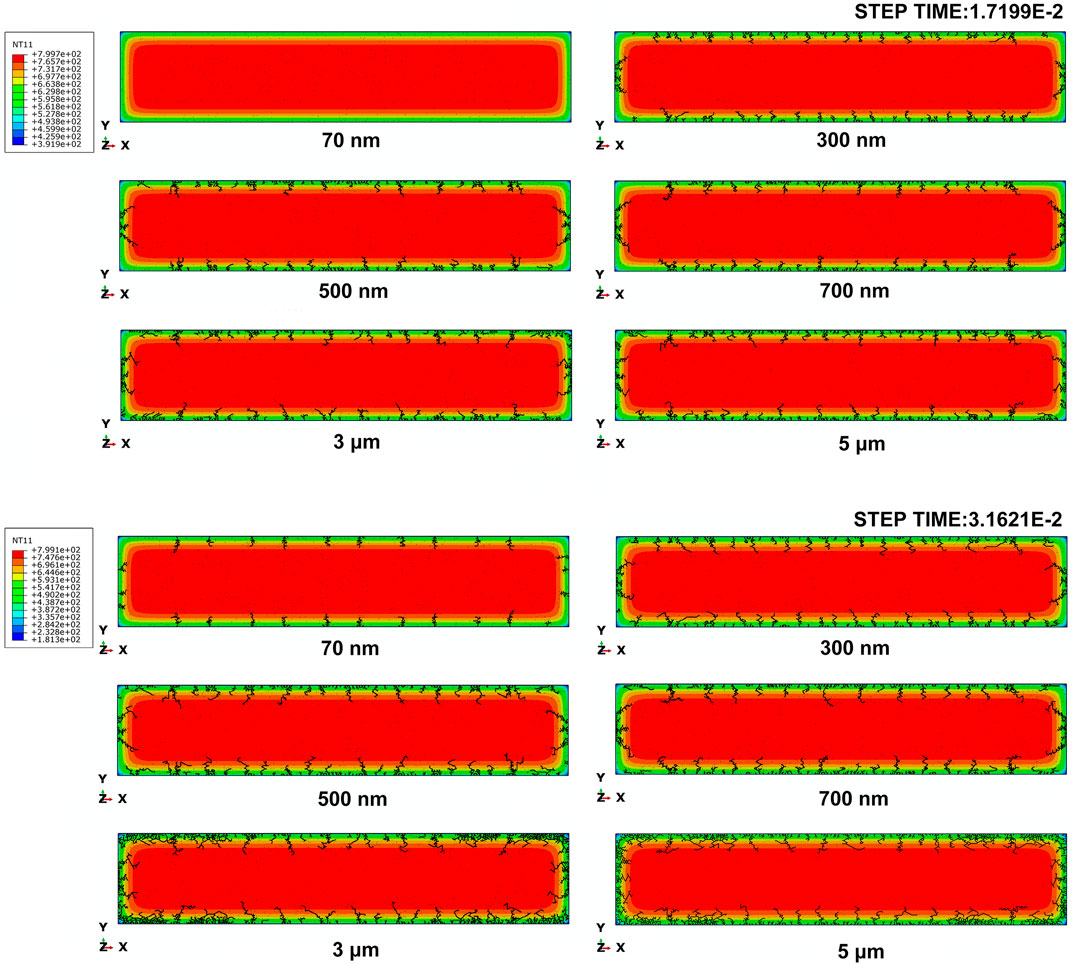
FIGURE 4. Crack pattern for different grain sizes at step time 1.7199 E−2 and step time 3.1621 E−2 with T0 = 800°C.
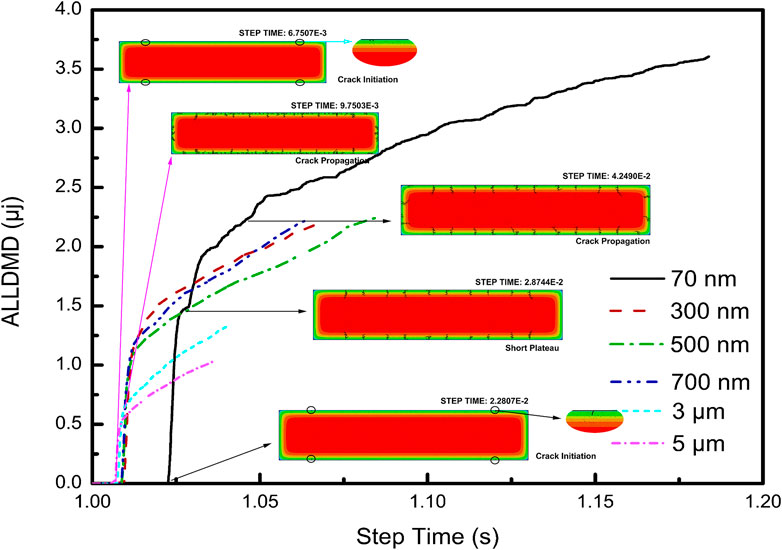
To further investigate the effect of grain size variation on crack nucleation and propagation during the thermal shock, damage dissipation energy curves shown in Figure 5 were introduced to study the mechanism of the thermal shock process. The curves can be divided into three stages. Stage I is the plateau with 0 value. This stage represented the samples are absorbing energy caused by thermal stress and crack will nucleate; in stage II, the curves increase rapidly in a short step time. The beginning of this stage represented that the crack nucleation has already occurred as shown in Figure 5. The cracks will absorb enough energy for crack propagation in this stage; in the last stage, the energy curves grow with a relatively low slope compared to the stage II. At the beginning of this stage, crack propagation has already occurred. The curve growth is consistent with the crack patterns shown in Figure 4. Except the 70-nm model, the time for crack nucleation in the end of stage I does not vary from that of other models. For the curve of the 70-nm model, stage I takes longer time to go into stage II, and there is a short plateau in stage II. This is because the 70-nm model has higher apparent fracture strength and fracture energy, and crack nucleation needs to reach a higher strength and absorb more energy, which means a larger temperature difference. Therefore, in stage I, the 70-nm model takes longer time than others. In stage II, combining the crack patterns shown in Figure 5 from 2.8744 E−2 to 4.2490 E−2, we found that the original crack propagation is suppressed due to the secondary crack nucleation in the Y direction and X direction. When the secondary cracks absorb enough energy to grow, the initial cracks will continue to grow. From Table 2, we found that as the grain size decreases, the increase in apparent strength gradually decreases while the apparent fracture energy increases significantly. According to the principle of FDEM, under the same critical fracture strength conditions, the higher the fracture energy, the longer the failure displacement. For this reason, the time interval between secondary cracks and initial cracks is longer than that in other models. Until the secondary crack begins to propagate, the temperature of the model changes further with heat convection and the original cracks continue to grow.
Figure 6A shows the curves of the step time versus the crack density. The crack density is calculated by dividing the crack area by the total area. The starting point of crack density calculation is when the crack begins to propagate, and this point is the end of stage II of ALLDMD curves. The starting crack density of the 70-nm model is significantly smaller than that of the others. Moreover, the slope of the curves represents the crack growth rate. The crack growth rate of the 70-nm model is significantly smaller than that of the other models. This can be attributed to a higher fracture energy and strength. Besides, the crack growth rate can be divided into three groups according to grain size. The first group is nanoscale (70 nm). The second group is sub-microscale (300, 500, and 700 nm), and the last group is microscale (3 and 5 μm). In each group, the crack growth rate varies slightly. This simulation result is consistent with the experimental observations. (Kingery, 1955) They used specimens with grain sizes from 3 to 10 μm for the cooling test, and the results indicated that this grain size difference did not have a very large influence on the crack fractal dimensions, the critical temperatures, and the residual strength. Figure 6B shows the curves of crack density versus the damage dissipation energy (ALLDMD). The curves show that as the grain size increases, the energy for crack growth gradually decreases, and the crack growth will become easier under the same temperature field. This means that a larger grain size material has worse thermal shock resistance when the operating temperature exceeds the critical stress temperature in different environments.
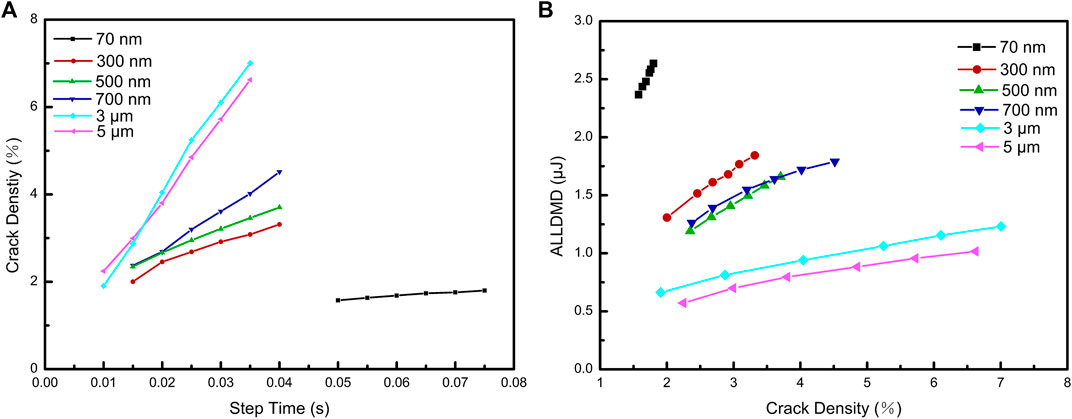
FIGURE 6. (A) Curves of step time versus crack density with different grain sizes; (B) curves of crack density versus the ALLDMD with different grain sizes.
The thermal shock resistance factor (critical temperature difference) was also used to evaluate the thermal shock resistance of materials. The thermal shock resistance factor is defined as the critical temperature difference required for crack instability. The thermal shock resistance factor was proposed as follows (Kingery, 1955):
where
Figure 7A shows the grain size versus R and critical stress temperature difference of models. In our simulation, the critical stress temperature difference is the temperature difference when the elements reach maximum stress and begin to undergo the damage evolution stage. The black line with squares is calculated from Eq. 9, and the red line with triangles is obtained from our simulation. There is a good agreement between simulation results and calculation results. Figure 7B shows the curves of grain size versus the temperature difference of crack nucleation, crack instability, and critical stress, respectively. It shows that the critical stress temperature difference, i.e., R, is not equal to crack nucleation temperature difference. The latter is larger than the former. As the grain size decreases, the difference between the crack nucleation temperature difference and critical temperature difference gradually increases. This is because as the grain size decreases, smaller grain size models need more energy to complete damage evolution, i.e., a larger temperature difference. Besides, the figure also shows that the crack nucleation temperature difference and crack instability temperature difference are not the same. It is consistent with the ALLDMD curves shown in Figure 5. Crack nucleation and instability will not happen at the same time. The temperature difference between crack nucleation and instability will increase as the grain size decreases, and this effect has a significant increase compared to the other models as the grain size decreases to nanoscale.
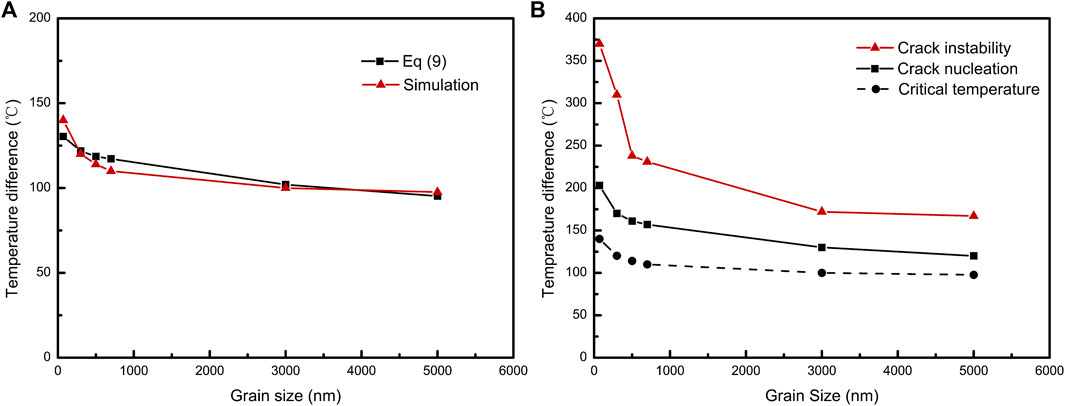
FIGURE 7. (A) R calculated from Eq. 9 and the critical stress temperature difference obtained from simulation with different grain sizes. (B) Temperature difference of critical stress, crack nucleation, and crack instability with different grain sizes.
In conclusion, the simulation results indicate that the thermal shock resistance factor calculated by Eq. 9 is equivalent to the temperature difference at which the surface elements reach the critical stress instead of the nucleation temperature difference. The model can still withstand thermal stress caused by a certain temperature difference from the critical stress temperature difference to crack nucleation temperature difference, or from the crack nucleation temperature difference to crack instability temperature difference, and the decreasing grain size has a positive effect.
The Effect of T0 on Thermal Shock Resistance
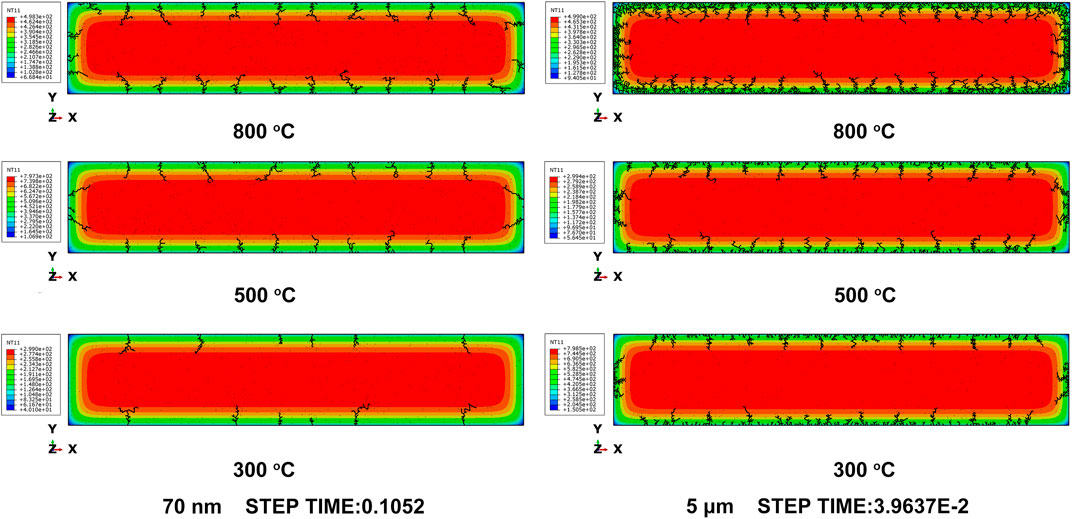
As shown in The Effect of Grain Size on Thermal Shock Resistance, the thermal crack pattern in submicron scale models has no apparent difference. Thus, a 70-nm model and 5-μm model were chosen to investigate the effect of temperature difference on thermal shock performance, and the crack pattern of both models are shown in Figure 8. As reported in plentiful literatures (Li D. et al, 2015; Wu and Jiang, 2015; Shao and Song, 2017; Jin et al., 2018; Wang et al., 2019), the effect of temperature difference on thermal shock is significant, and the smaller the temperature difference, the fewer the cracks generated. In the 70-nm models, there were 12 cracks in the X direction when T0 was 800°C, while 10 cracks were observed when T0 decreased to 500°C, and only six cracks in X direction were found with T0 = 300. In the 5-μm model, the number of short cracks between the long cracks was reduced obviously as T0 decreased from 800°C to 500°C.
Figure 9A shows the critical stress temperature difference versus different T0 of the 70-nm model and 5-μm model. The simulation results indicate that the critical stress temperature difference will not be affected by T0. This is consistent with Eq. 9. However, as shown in Figure 9B , T0 will influence the temperature difference of crack nucleation and crack instability. Figure 9B shows the T0 versus the temperature difference curves of crack nucleation and crack instability of the 70-nm model and 5-μm model, respectively. As T0 decreases from 800°C to 300°C, the temperature difference of crack nucleation and crack instability of both models decreases. This effect will be more obvious in smaller grain size. It may be the reason that a higher T0 will cause more joint elements to reach critical stress and enter the damage evolution stage. Subsequently, crack nucleation and propagation require higher energy, i.e., a higher temperature difference. These simulation results are based on the fact that T0 is larger than the critical stress temperature difference. The above description is the mechanical properties of the material when thermal shock damage happens. Although most experiments (Liao et al., 2019; Yang et al., 2017) indicate that a cooling test with a higher T0 results in lower residual strength, in our simulation, the material can withstand a higher temperature difference before crack instability with a higher T0.
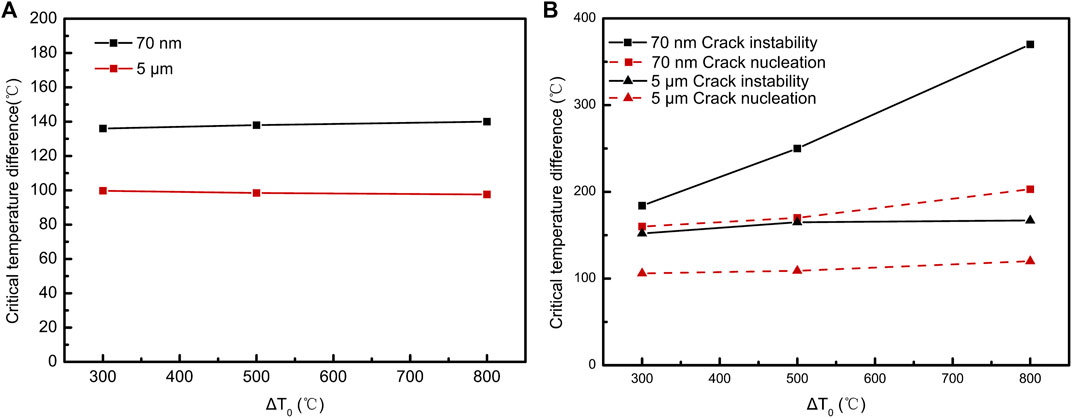
FIGURE 9. (A) Critical stress temperature difference of the 70-nm model and 5-μm model at different T0; (B) temperature difference of crack nucleation and crack instability of the 70-nm model and 5-μm model at different T0.
The Effect of Grain Boundary Fracture Energy on Thermal Shock Resistance
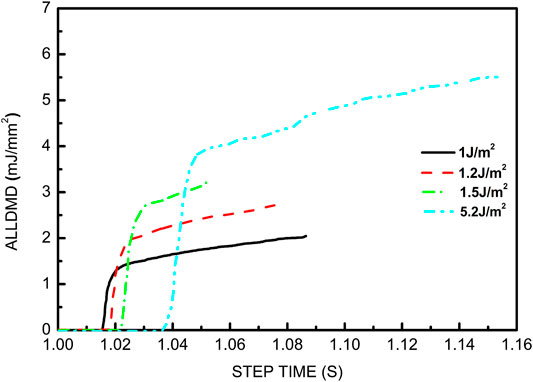
Figure 10 shows the crack evolution of thermal shock crack patterns with 1, 1.2, 1.5, and 5.2 J/m2 grain boundary fracture energies. Here, as the grain boundary fracture energy increased to 5.2 J/m2, the fracture mode was changed from intergranular fracture to transgranular fracture. Supplementary Figure S2 shows the fracture failure of different grain boundary fracture energies of RVE models . As shown in Table 2 , the apparent fracture energy and fracture strength of 5.2 J/m2 are 1.89 J/m2 and 837 MPa, respectively. The apparent fracture strength and fracture energy are determined by grains when transgranular fracture becomes the main fracture mode. When the step time is 1.9135 E−2, the cracks will propagate in the 1-J/m2 model and crack nucleation can be observed in the 1.2-J/m2 model, while in the 1.5- and 5.2-J/m2 models no cracks are observed. As the time reaches 2.3592 E−2, crack propagation can be observed in the 1- and 1.2-J/m2 models and crack nucleation can be observed in the 1.5-J/m2 models, while for the 5.2-J/m2 model no damage takes place until the time reaches 3.8404 E−2.
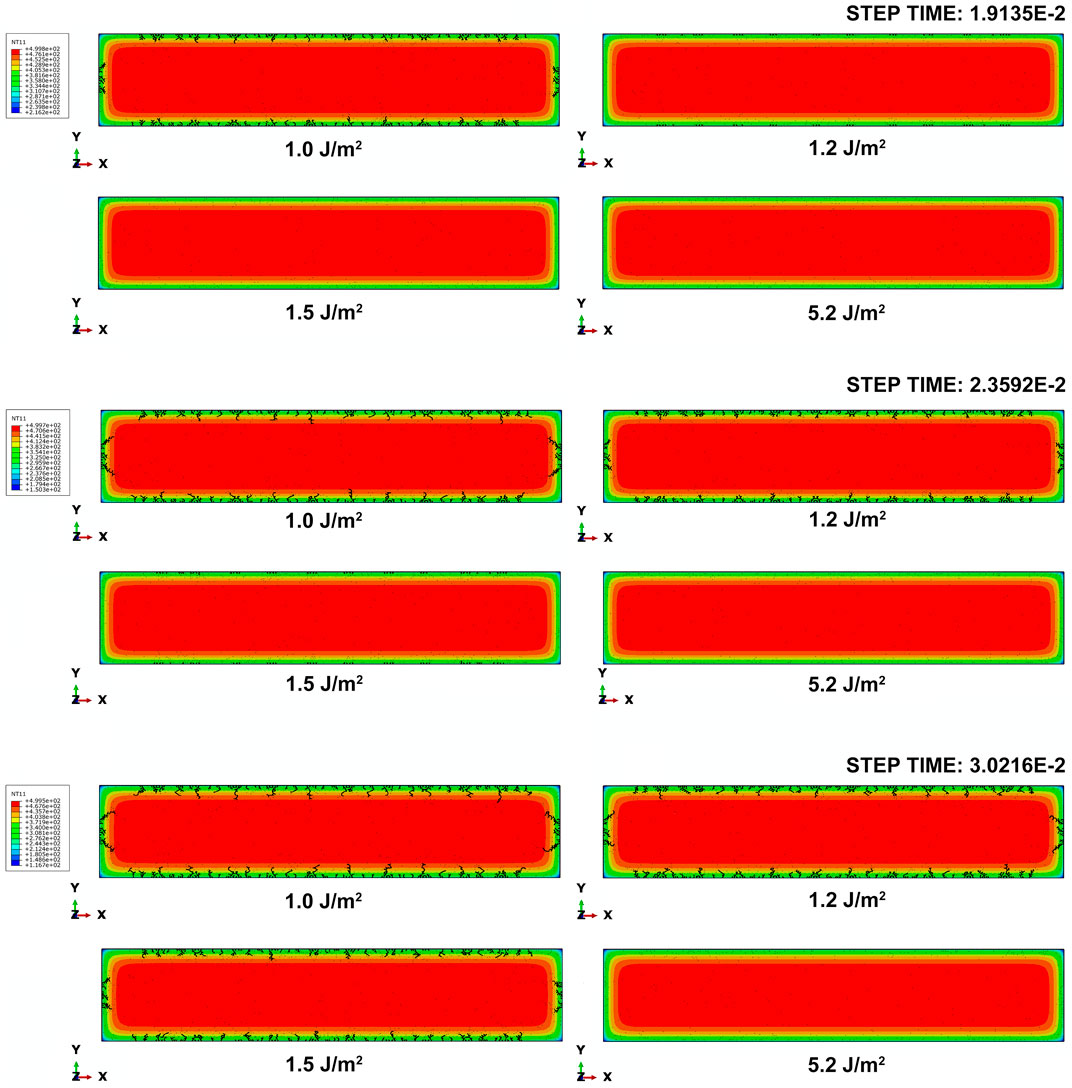
FIGURE 10. Crack patterns of 1, 1.2, 1.5, and 5.2 J/m2 grain boundary fracture energy models at step time 1.9135, 2.3592, and 3.0216 E−2, respectively.
To further investigate the effect of grain boundary fracture energy on thermal shock, as shown in Figure 11, the damage dissipation energy curve was used to describe the process of crack nucleation and propagation during the thermal shock.
Similar to the curves shown in Figure 5, there are also three stages. As the grain boundary fracture energy increases, stage I and stage II take more time during the thermal shock process. This can be attributed to the higher fracture strength and higher fracture energy. Crack nucleation and propagation need a larger temperature difference to reach higher critical fracture strength and energy. However, when grain boundary fracture energy exceeds grain fracture energy (2.3 J/m2), the time in stage I and stage II will not continue to extend. This is because the fracture mode will change to transgranular fracture, and the apparent mechanical properties are determined by grain properties.
Figure 12A shows the grain boundary fracture energy versus R and the critical stress temperature difference of models, respectively. The red line is calculated by Eq. 9 and the black line is obtained in our simulation. The simulation results are in good agreement with the calculation results. Figure 12B shows the grain boundary fracture energy versus the temperature difference of crack nucleation, crack instability, and critical stress, respectively. The results show that as the grain boundary fracture energy increases, the temperature required to achieve crack nucleation from critical stress gradually increases. Besides, the temperature difference of crack nucleation and crack instability is proportional to the grain boundary fracture energy. It may be attributed to the increase in the apparent fracture strength and apparent fracture energy caused by the increase in grain boundary fracture energy, while as the grain boundary fracture energy increases, the temperature difference between crack nucleation and crack instability gradually decreases. This may be related to the heat transfer. In our simulation, the transient thermal analysis model is used and the heat convection follows physical rules. The closer the model surface temperature is to T0, the faster the surface temperature will drop. When increasing the grain boundary fracture energy, the temperature difference of crack nucleation gradually increases. Meanwhile, the cooling rate of the larger grain boundary fracture energy model surface slows down. In general, increasing grain boundary fracture energy has a positive effect on thermal shock resistance.
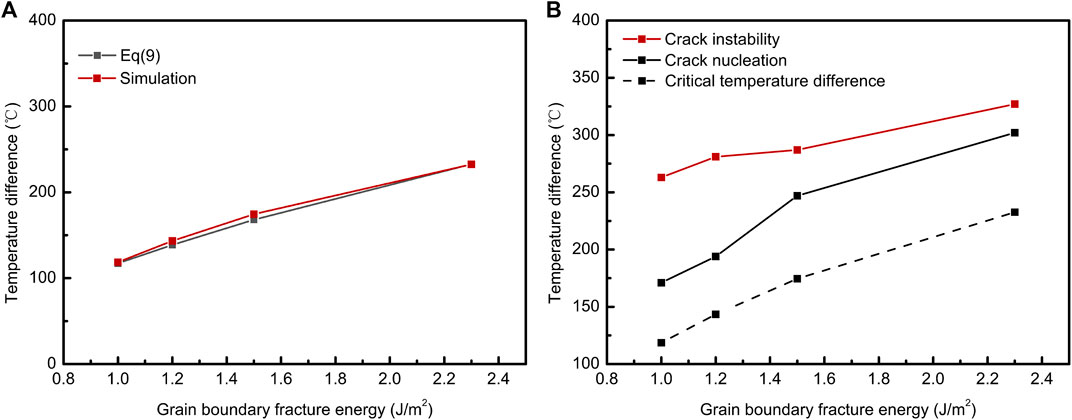
FIGURE 12. (A) R calculated from Eq. 9 and the critical stress temperature difference obtained from simulation with different grain boundary fracture energies; (B) temperature difference of critical stress, crack nucleation, and crack instability with different grain boundary fracture energies.
Conclusion
In this article, a dual-scale model was constructed to investigate the effect of grain size and grain boundary fracture energy on the thermal shock resistance property by simulating the cooling test on an example of alumina. FDEM was used to model the fracture process. To further comprehend the mechanism of crack nucleation and propagation caused by thermal shock, damage dissipation energy curves (ALLDMD) are introduced to study how the microstructure parameters influence the thermal cracking behavior and evaluate the thermal shock property of materials. The curves are divided into three different stages to describe the thermal shock process. The three stages are the undamaged stage (stage I), crack initiation stage (stage II) and crack propagation stage (stage III). Besides, the thermal shock resistance factor is calculated by an equation and is consistent with our simulation results. Moreover, the temperature difference of crack nucleation and instability is calculated using a model for in-depth analysis of the effect of microstructure parameters and different T0 on thermal shock resistance. The conclusions are as follows:
1) The ALLDMD curves show that the 70-nm model with higher apparent fracture energy and strength shows better damage tolerance, and original crack propagation is suppressed by secondary crack nucleation.
2) Increasing crack density indicates that increasing grain size will lead to larger crack growth rates. The crack growth rate is mainly relevant to the scale of the grain size. Under the same scale (such as microscale and sub-microscale), the grain size affects the crack growth rate slightly.
3) The change of T 0 will not affect the thermal shock resistance factor but the temperature difference of crack nucleation and crack instability. Moreover, decreasing grain size has an obvious effect on the temperature difference between crack nucleation and instability.
4) Increasing grain boundary fracture energy has a positive effect on thermal shock resistance by increasing damage tolerance. When grain boundary fracture energy exceeds grain fracture energy, increasing the grain boundary fracture energy has no effect on the improvement of thermal shock resistance.
5) In our simulation, critical stress temperature difference shows a good agreement with the theoretical thermal shock resistance factor. We further found that crack nucleation and instability will not occur immediately when the model reaches the critical stress, but the models can sustain higher temperature difference. Both crack nucleation and instability have their corresponding critical temperature differences.
Data Availability Statement
The original contributions presented in the study are included in the article/Supplementary Material; further inquiries can be directed to the corresponding authors.
Author Contributions
ZG: simulation and writing (original draft). KG: methodology, supervision, writing (review and editing), and funding acquisition. PR: writing (review and editing). QZ: methodology and funding acquisition. JL: writing (review and editing). ZF: validation and resources.
Conflict of Interest
The authors declare that the research was conducted in the absence of any commercial or financial relationships that could be construed as a potential conflict of interest.
Publisher’s Note
All claims expressed in this article are solely those of the authors and do not necessarily represent those of their affiliated organizations, or those of the publisher, the editors, and the reviewers. Any product that may be evaluated in this article, or claim that may be made by its manufacturer, is not guaranteed or endorsed by the publisher.
Acknowledgments
The authors thank the National Key R&D Program of China (Grant No. 2017YFB0703200), National Natural Science Foundation of China (Grant Nos. 51702100 and 51972268), and China Postdoctoral Science Foundation (Grant No. 2018M643075). The authors also acknowledge the Northwestern Polytechnical University High Performance Computing Center for the allocation of computing time on their machines.
Supplementary Material
The Supplementary Material for this article can be found online at: https://www.frontiersin.org/articles/10.3389/fmats.2021.724377/full#supplementary-material
References
Awaji, H., Ogawa, M., and Sato, S. (1993). A New Testing Method for thermal Shock. Trans.JSME, Ser.A 59, 2941–2946. doi:10.1299/kikaia.59.2941
Bahr, H.-A., Balke, H., Kuna, M., and Liesk, H. (1987). Fracture Analysis of a Single Edge Cracked Strip under thermal Shock. Theor. Appl. Fracture Mech. 8, 33–39. doi:10.1016/0167-8442(87)90016-4
Bahr, H.-A., Fischer, G., and Weiss, H.-J. (1986). Thermal-shock Crack Patterns Explained by Single and Multiple Crack Propagation. J. Mater. Sci. 21, 2716–2720. doi:10.1007/BF00551478
Bahr, H.-A., Weiss, H.-J., Maschke, H. G., and Meissner, F. (1988). Multiple Crack Propagation in a Strip Caused by thermal Shock. Theor. Appl. Fracture Mech. 10, 219–226. doi:10.1016/0167-8442(88)90014-6
Barenblatt, G. I., and Botvina, L. R. (1986). Similarity Methods in the Mechanics and Physics of Fracture. Mater. Sci. 22, 52–57. doi:10.1007/BF00720866
Barenblatt, G. I. (1962). The Mathematical Theory of Equilibrium Cracks in Brittle Fracture. Adv. Appl. Mech. 7, 55–129. doi:10.1016/S0065-2156(08)70121-2
Barenblatt, G. (1993). Some General Aspects of Fracture Mechanics, In. Modeling of Defects and Fracture Mechanics. New York: Springer-Verlag. doi:10.1007/978-3-7091-2716-2_2
Belytschko, T., and Black, T. (1999). Elastic Crack Growth in Finite Elements with Minimal Remeshing. Int. J. Numer. Meth. Engng. 45, 601–620. doi:10.1002/(SICI)1097-0207(19990620)45:5<601::AID-NME598>3.0.CO;2-S
Dugdale, D. S. (1960). Yielding of Steel Sheets Containing Slits. J. Mech. Phys. Sol. 8, 100–104. doi:10.1016/0022-5096(60)90013-2
Ehre, D., and Chaim, R. (2008). Abnormal Hall-Petch Behavior in Nanocrystalline MgO Ceramic. J. Mater. Sci. 43, 6139–6143. doi:10.1007/s10853-008-2936-z
Fortune, S. (1997). Voronoi Diagrams and Delaunay Triangulations, in Handbook of Discrete and Computational Geometry (Boca raton, FL: CRC Press), 377–388.
Francfort, G. A., and Marigo, J.-J. (1998). Revisiting Brittle Fracture as an Energy Minimization Problem. J. Mech. Phys. Sol. 46, 1319–1342. doi:10.1016/S0022-5096(98)00034-9
Gaida, N. A., Nishiyama, N., Masuno, A., Holzheid, A., Ohfuji, H., Schürmann, U., et al. (2017). Synthesis of Al 2 O 3/SiO 2 Nano‐nano Composite Ceramics under High Pressure and its Inverse Hall-Petch Behavior. J. Am. Ceram. Soc. 100, 323–332. doi:10.1111/jace.14551
Giannakeas, I. N., Papathanasiou, T. K., and Bahai, H. (2018). Simulation of thermal Shock Cracking in Ceramics Using Bond-Based Peridynamics and FEM. J. Eur. Ceram. Soc. 38, 3037–3048. doi:10.1016/j.jeurceramsoc.2017.12.039
Gong, Z., Zhao, W., Guan, K., Rao, P., Zeng, Q., Liu, J., et al. (2020). Influence of Grain Boundary and Grain Size on the Mechanical Properties of Polycrystalline Ceramics: Grain‐scale Simulations. J. Am. Ceram. Soc. 103, 5900–5913. doi:10.1111/jace.17286
Han, J., Hu, P., Zhang, X., Meng, S., and Han, W. (2008). Oxidation-resistant ZrB2-SiC Composites at 2200°C. Composites Sci. Technol. 68, 799–806. doi:10.1016/j.compscitech.2007.08.017
Hasselman, D. P. H. (1969). Unified Theory of Thermal Shock Fracture Initiation and Crack Propagation in Brittle Ceramics. J. Am. Ceram. Soc. 52, 600–604. doi:10.1016/0010-4361(69)90018-410.1111/j.1151-2916.1969.tb15848.x
Jagla, E. A. (2002). Stable Propagation of an Ordered Array of Cracks during Directional Drying. Phys. Rev. E 65, 046147. doi:10.1103/PhysRevE.65.046147
Jiang, C. P., Wu, X. F., Li, J., Song, F., Shao, Y. F., Xu, X. H., et al. (2012). A Study of the Mechanism of Formation and Numerical Simulations of Crack Patterns in Ceramics Subjected to thermal Shock. Acta Materialia 60, 4540–4550. doi:10.1016/j.actamat.2012.05.020
Jin, X., Wang, S., Dong, L., and Xu, B. (2018). Quenching Crack Patterns of the Ultra-high Temperature Ceramic in Shapes of Leading Edge or Alike. Eng. Fail. Anal. 83, 102–108. doi:10.1016/j.engfailanal.2017.10.001
Kingery, W. D. (1955). Factors Affecting Thermal Stress Resistance of Ceramic Materials. J. Am. Ceram. Soc. 38, 3–15. doi:10.1111/j.1151-2916.1955.tb14545.x
Levine, S. R., Opila, E. J., Halbig, M. C., Kiser, J. D., Singh, M., and Salem, J. A. (2002). Evaluation of Ultra-high Temperature Ceramics Foraeropropulsion Use. J. Eur. Ceram. Soc. 22, 2757–2767. doi:10.1016/S0955-2219(02)00140-1
Li, D., Li, W., Wang, R., and Fang, D. (2015a). The Effects of Water Entry Postures on the Thermal Shock Behavior of Alumina. Int. J. Appl. Ceram. Technol. 13, 56–60. doi:10.1111/ijac.12411
Li, D., Li, W., Wang, R., and Kou, H. (2018). Simulation of the thermal Shock Behavior of Ultra-high Temperature Ceramics with the Consideration of Temperature-dependent Crack Propagation Criterion and Interaction between thermal Shock Cracks Evolution and thermal Conduction. Eur. J. Mech. - A/Solids 72, 268–274. doi:10.1016/j.euromechsol.2018.05.016
Li, J., Song, F., and Jiang, C. (2015b). A Non-local Approach to Crack Process Modeling in Ceramic Materials Subjected to thermal Shock. Eng. Fracture Mech. 133, 85–98. doi:10.1016/j.engfracmech.2014.11.007
Li, J., Song, F., and Jiang, C. (2013). Direct Numerical Simulations on Crack Formation in Ceramic Materials under thermal Shock by Using a Non-local Fracture Model. J. Eur. Ceram. Soc. 33, 2677–2687. doi:10.1016/j.jeurceramsoc.2013.04.012
Li, K., Wang, D., Chen, H., and Guo, L. (2014). Normalized Evaluation of thermal Shock Resistance for Ceramic Materials. J. Adv. Ceram. 3, 250–258. doi:10.1007/s40145-014-0118-9
Liao, N., Niu, B., Qiu, B., Nath, M., Li, Y., and Gan, Z. (2019). Enhanced thermal Shock Resistance of BN-Based Composites Sintered by Hot-Pressing with the Introduction of Nano Oxides. Mater. Sci. Eng. A 767, 138443. doi:10.1016/j.msea.2019.138443
Liu, Y., Wu, X., Guo, Q., Jiang, C., Song, F., and Li, J. (2015). Experiments and Numerical Simulations of thermal Shock Crack Patterns in Thin Circular Ceramic Specimens. Ceramics Int. 41, 1107–1114. doi:10.1016/j.ceramint.2014.09.036
Lu, T. J., and Fleck, N. A. (1998). The thermal Shock Resistance of Solids. Acta Materialia 46, 4755–4768. doi:10.1016/S1359-6454(98)00127-X
Mecholsky, J. J., Passoja, D. E., and Feinberg-Ringel, K. S. (1989). Quantitative Analysis of Brittle Fracture Surfaces Using Fractal Geometry. J. Am. Ceram. Soc. 72, 60–65. doi:10.1111/j.1151-2916.1989.tb05954.x
Melenk, J. M., and Babuška, I. (1996). The Partition of unity Finite Element Method: Basic Theory and Applications. Comput. Methods Appl. Mech. Eng. 139, 289–314. doi:10.1016/S0045-7825(96)01087-0
Munjiza, A., and Andrews, K. R. F. (2000). Penalty Function Method for Combined Finite-Discrete Element Systems Comprising Large Number of Separate Bodies. Int. J. Numer. Meth. Engng. 49, 1377–1396. doi:10.1002/1097-0207(20001220)49:113.0.CO;2-B10.1002/1097-0207(20001220)49:11<1377::aid-nme6>3.0.co;2-b
Munjiza, A., Andrews, K. R. F., and White, J. K. (1999). Combined Single and Smeared Crack Model in Combined Finite-Discrete Element Analysis. Int. J. Numer. Meth. Engng. 44, 41–57. doi:10.1002/(SICI)1097-0207(19990110)44:1<41::AID-NME487>3.0.C10.1002/(sici)1097-0207(19990110)44:1<41::aid-nme487>3.0.co;2-a
Munjiza, A., Bangash, T., and John, N. W. M. (2004). The Combined Finite-Discrete Element Method for Structural Failure and Collapse. Eng. Fracture Mech. 71, 469–483. doi:10.1016/S0013-7944(03)00044-4
Needleman, A. (1990). An Analysis of Tensile Decohesion along an Interface. J. Mech. Phys. Sol. 38, 289–324. doi:10.1016/0022-5096(90)90001-K
Opeka, M. M., Talmy, I. G., Wuchina, E. J., Zaykoski, J. A., and Causey, S. J. (1999). Mechanical, Thermal, and Oxidation Properties of Refractory Hafnium and Zirconium Compounds. J. Eur. Ceram. Soc. 19, 2405–2414. doi:10.1016/S0955-2219(99)00129-6
Panda, P. K., Kannan, T. S., Dubois, J., Olagnon, C., and Fantozzi, G. (2002). Thermal Shock and thermal Fatigue Study of Ceramic Materials on a Newly Developed Ascending thermal Shock Test Equipment. Sci. Technol. Adv. Mater. 3, 327–334. doi:10.1016/S1468-6996(02)00029-3
Qi, F., Meng, S., Song, F., Guo, H., Xu, X., Shao, Y., et al. (2019). Fractal Characterization of Ceramic Crack Patterns after thermal Shocks. J. Am. Ceram. Soc. 102, 3641–3652. doi:10.1111/jace.16196
Qian, D., Zhang, L., Zhang, Y., Liu, P., Wang, X., and Ma, J. (2018). Impact of thermal Shock Cycles on Mechanical Properties and Microstructure of Lithium Disilicate Dental Glass-Ceramic. Ceramics Int. 44, 1589–1593. doi:10.1016/j.ceramint.2017.10.079
Ryou, H., Drazin, J. W., Wahl, K. J., Qadri, S. B., Gorzkowski, E. P., Feigelson, B. N., et al. (2018). Below the Hall-Petch Limit in Nanocrystalline Ceramics. ACS Nano 12, 3083–3094. doi:10.1021/acsnano.7b07380
Schmitt, N., Burr, A., Berthaud, Y., and Poirier, J. (2002). Micromechanics Applied to the thermal Shock Behavior of Refractory Ceramics. Mech. Mater. 34, 725–747. doi:10.1016/S0167-6636(02)00156-4
Shao, Y., Song, F., Liu, B., Li, W., Li, L., and Jiang, C. (2017). Observation of Ceramic Cracking during Quenching. J. Am. Ceram. Soc. 100, 520–523. doi:10.1111/jace.14674
Shao, Y., Xu, X., Meng, S., Bai, G., Jiang, C., and Song, F. (2010). Crack Patterns in Ceramic Plates after Quenching. J. Am. Ceram. Soc. 93, 3006–3008. doi:10.1111/j.1551-2916.2010.03971.x
Shao, Y., Zhang, Y., Xu, X., Zhou, Z., Li, W., and Liu, B. (2011). Effect of Crack Pattern on the Residual Strength of Ceramics after Quenching. J. Am. Ceram. Soc. 94, 2804–2807. doi:10.1111/j.1551-2916.2011.04728.x
Singh, J. P., Tree, Y., and Hasselman, D. P. H. (1981). Effect of bath and Specimen Temperature on the thermal Stress Resistance of Brittle Ceramics Subjected to thermal Quenching. J. Mater. Sci. 16, 2109–2118. doi:10.1007/BF00542371
Song, F., Meng, S., Xu, X., and Shao, Y. (2010). Enhanced Thermal Shock Resistance of Ceramics through Biomimetically Inspired Nanofins. Phys. Rev. Lett. 104, 125502. doi:10.1103/PhysRevLett.104.125502
Takeshita, Y., and Uchimura, H. (1995). Evaluation of thermal Shock Resistance Using Precracked Specimens. J. Ceram. Soc. Jpn. 103, 563–569. doi:10.2109/jcersj.103.563
Vandeperre, L. J., Kristofferson, A., Carlström, E., and Clegg, W. J. (2001). Thermal Shock of Layered Ceramic Structures with Crack-Deflecting Interfaces. J. Am. Ceram. Soc. 84, 104–110. doi:10.1111/j.1151-2916.2001.tb00615.x
Wang, Y., Zhou, X., and Zhang, T. (2019). Size Effect of thermal Shock Crack Patterns in Ceramics: Insights from a Nonlocal Numerical Approach. Mech. Mater. 137, 103133. doi:10.1016/j.mechmat.2019.103133
Wu, X., Jiang, C., Song, F., Li, J., Shao, Y., Xu, X., et al. (2015). Size Effect of thermal Shock Crack Patterns in Ceramics and Numerical Predictions. J. Eur. Ceram. Soc. 35, 1263–1271. doi:10.1016/j.jeurceramsoc.2014.10.032
Yan, C., Fan, H., Zheng, Y., Zhao, Y., and Ning, F. (2020). Simulation of the thermal Shock of Brittle Materials Using the Finite-Discrete Element Method. Eng. Anal. Boundary Elem. 115, 142–155. doi:10.1016/j.enganabound.2020.03.013
Yang, X., Liu, X., Wang, L., Zhang, H., Yao, X., and Huang, Z. (2017). Effects of Artificial Defect on the Material Residual Strength of SiC Ceramics after thermal-shock. Mater. Sci. Eng. A 707, 159–163. doi:10.1016/j.msea.2017.09.043
Zhang, X., Hu, P., Han, J., and Meng, S. (2008). Ablation Behavior of ZrB2-SiC Ultra High Temperature Ceramics under Simulated Atmospheric Re-entry Conditions. Composites Sci. Technol. 68, 1718–1726. doi:10.1016/j.compscitech.2008.02.009
Keywords: thermal shock, grain size, grain boundaries, simulation, energy dissipation
Citation: Gong Z, Guan K, Rao P, Zeng Q, Liu J and Feng Z (2021) Numerical Study of Thermal Shock Damage Mechanism of Polycrystalline Ceramics. Front. Mater. 8:724377. doi: 10.3389/fmats.2021.724377
Received: 13 June 2021; Accepted: 27 August 2021;
Published: 12 October 2021.
Edited by:
Jincheng Du, University of North Texas, United StatesReviewed by:
Haihui Zhang, Jiangxi University of Science and Technology, ChinaDi Zhou, Xi’an Jiaotong University, China
Copyright © 2021 Gong, Guan, Rao, Zeng, Liu and Feng. This is an open-access article distributed under the terms of the Creative Commons Attribution License (CC BY). The use, distribution or reproduction in other forums is permitted, provided the original author(s) and the copyright owner(s) are credited and that the original publication in this journal is cited, in accordance with accepted academic practice. No use, distribution or reproduction is permitted which does not comply with these terms.
*Correspondence: Kang Guan, a2FuZ2d1YW4xMjNAZ21haWwuY29t, bXNrZ3VhbkBzY3V0LmVkdS5jbg==; Pinggen Rao, cGdyYW9Ac2N1dC5lZHUuY24=
 Zhenyuan Gong
 Kang Guan
 Pinggen Rao1*