 Likai Wang1*†
 Yan Zheng2†
- 1Department of Stomatology, Beijing Bo’ai Hospital, China Rehabilitation Research Center, School of Rehabilitation, Capital Medical University, Beijing, China
- 2Department of Stomatology, Beijngshi Xicheng Guangwai Hospital, Beijing, China
Objective: This study aimed to investigate the impact of artificial aging on the color stability and hardness of nanocomposite resin.
Methods: Four nanocomposite resin materials were used: Filtek Z350 XT (FZ), Synergy D6 (SD), Grandio (GD), and Clearfil Majesty Esthetic (CM). Thirty specimens were created from each material, which were divided into three (A,B,C) groups of 10 specimens each. For each material, the values of visual lightness (L*), degree of redness and greenness (a*), and degree of yellowness and blueness (b*) of the specimens in group A before and after aging, as well as the hardness of the specimens in group B before aging and in group C after aging, were measured. The American Society for Testing and Materials (ASTM) G155 Cycle 1 standard was adopted to test the aging of the specimens. The color difference (ΔE00) value and hardness difference (ΔH) value of the specimens before and after aging were calculated.
Results: Aging was found to have an impact on the ΔE00 values of the resin materials in each group (H = 17.6, p = 0.001), and the hardness of the specimens in each group after artificial aging was significantly higher than before aging (p < 0.05). The difference in ΔE00 between the FZ group and the SD, GD, and CM groups was statistically significant (p < 0.05). The FZ group had the highest ΔE00 values. There was no correlation between ΔE00 and the hardness change percentage after aging (r = 0.114).
Conclusion: Among the four nanocomposite resins tested in this study, except for Filtek Z350 XT’s ΔE00 values (>1.8) in the clinically unacceptable range, the remaining three kinds of resin ΔE00 values (<1.8) were all in the clinically acceptable range. The hardness of the four nanocomposite resins increased after aging. The results of the present study revealed that there was no correlation between ΔE00 and hardness change percentage in the four nanocomposite resin materials after aging.
Introduction
Composites are popular restorative materials in dental practice (Vidal et al., 2020). The application of nanotechnology to composite resin has been an important recent advancement in the field as it has improved the biological properties of composite resin (Paravina et al., 2015), but researchers have also been concerned about nanocomposite resin’s resistance to aging. The application of composite resins in dental restoration requires consideration of the resin’s mechanical, aesthetic, and clinical properties, which depend on its structure. Dental composite resins are composed of three materials with different chemical properties: an organic matrix, an inorganic filler or dispersed phase, and an organic silane or coupling agent to combine the filler and the organic matrix (Nasim et al., 2010).
Nanocomposite resins emerged in the late 20th century. They are composed of two or more kinds of materials, composited in at least one dimension, with nanometer sizes of 1–100 nm. Nanotechnology can intricately plan and control the structure and properties of materials on the nanometric level, at which the nanoparticles in composite material are uniformly dispersed. Through filling or combining inorganic rigid particles in the organic network, functional improvement can be achieved. With nanotechnology, the diameter of the filler can be reduced and its content and gradient distribution range increased, thereby reducing polymerization shrinkage and improving the mechanical and optical properties of the composite resin (Moszner and Klapdohr, 2004).
Color stability is an important issue in aesthetic restoration, and it plays a vital role in the clinical success of repair treatment (Glaskova-Kuzmina et al., 2020). The color stability of composite resin is related to the size and polymerization depth of the matrix, filler particles, and colorant (Nasim et al., 2010). A previous study (Schulze et al., 2003) found that the color stability of composite resin is related to the chemical differences between its matrix components, such as the purity of its oligomers and monomers, its concentration/type of activator, initiator, and inhibitor, and the oxidation of its unreacted carbon–carbon double bond and filler. Another study demonstrated that (Lee et al., 2011) low water absorption, a high filler/matrix ratio, reducing the filler particle size and hardness, and using the most effective filler-matrix coupling system can improve the color stability of a composite resin. Artificial aging has been widely used to test the color stability of dental composite resins since 1978. This method estimates the physical changes of dental materials in the oral environment by reproducing the atmospheric effects of materials exposed to sunlight and humidity (Roselino et al., 2013; Ganjkar et al., 2017; Wang et al., 2019).
In the present study, we aimed to investigate the impact of artificial aging on the color stability and hardness of nanocomposite resin. We hypothesized that there is no significant difference in color stability between the nano-hybrid group and the nano-filled group, and after aging, the hardness of all materials decreases.
Materials and Methods
Materials and Equipment
Nanocomposite Resin Materials
Four kinds of nanocomposite resin materials were used: Filtek Z350 XT (A2 color, 3M ESPE, United States), denoted as FZ; Synergy D6 (A2 color, Coltene/Whaledent, Switzerland), denoted as SD; Grandio (A2 color, Voco, Germany), denoted as GD; and Clearfil Majesty Esthetic (A2 color, Kuraray, Japan), denoted as CM. The components of each resin are shown in Table 1.
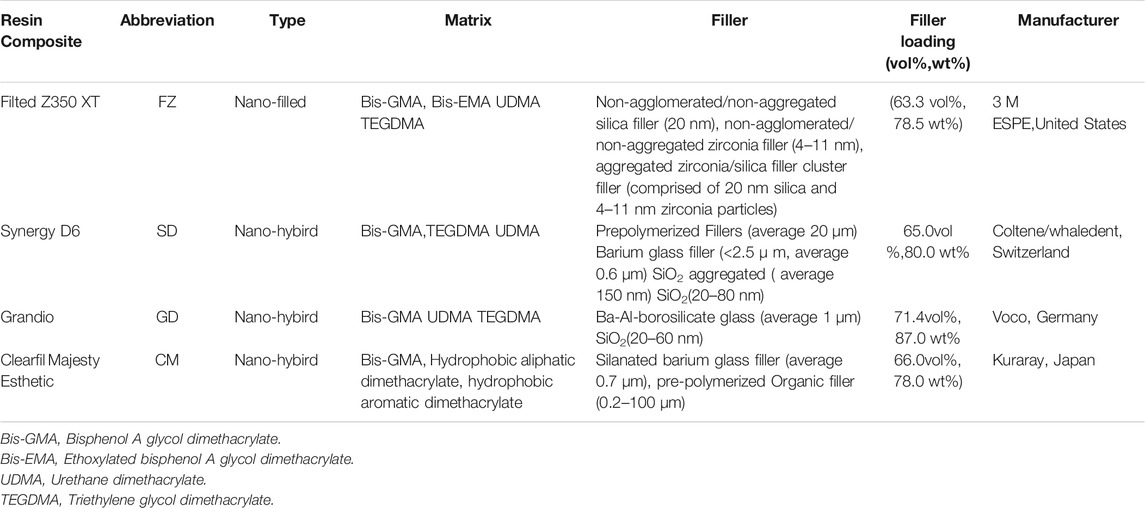
TABLE 1. Specific composition of four resin materials.
Other Equipment
Ti Max NL400 electric mechanic motor and slow handpiece (NSK, Japan); HVS-1000 digital microhardness tester (Shanghai Lianer Testing Equipment Co. Ltd. China); KQ-100DE numerical control ultrasonic cleaner (Jiangsu Kunshan Ultrasonic Instrument Co. Ltd. China); SF2000 electronic digital caliper (accuracy 0.01 mm, Guilin Guanglu Digital Measurement and Control Co. Ltd. China); Eagle silicon carbide water sandpaper (NKC, Korea); polyethylene film (Jiangsu Changzhou Guangzhao Plastic Co. Ltd. China); Soft-Lex polishing disc (3M ESPE, United States); zirconia ceramic block (Lava, A2 color, 3M ESPE, United States); Crystaleye spectrophotometer® (Olympus, Japan); Xe-3-HS xenon lamp aging instrument (Q-SUN, United States); CL-628 LED curing machine (light output intensity 900–1,100 mw/cm−2, Beyond, United States).
Experimental Methods
Creating the Test Specimens
Ring-shaped stainless steel molds with an inner diameter of 10 mm, a thickness of 1 mm, and a notch were custom made for this study. To create a resin specimen, a mold was laid flat on a slide covered with polyethylene film, after which the resin material was poured into the ring. More polyethylene film and another slide were placed on top of the ring and pressed so that any excess resin overflowed from the notch and was removed. The cover slide was removed, and an LED light curing lamp (wavelength 400–480 nm) was used to irradiate the resin for 40 s at a distance of 1 mm from the surface of the resin adhesive. This created a resin specimen with a diameter of 10 mm and a thickness of 1 mm (Figure 1). A total of 30 specimens were made for each resin material and divided into three groups of 10 specimens each (group A, group B, and group C; a total of 120 specimens).
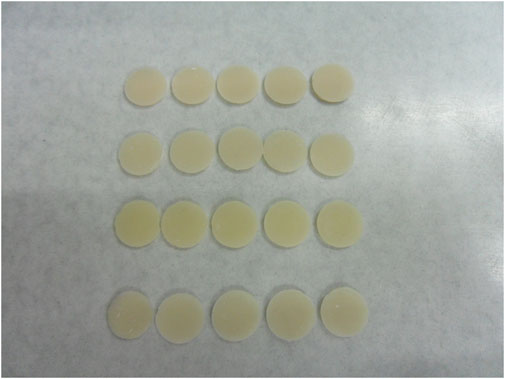
FIGURE 1. A partially made sample.
One surface of each specimen was sanded with 400-, 600-, 800-, 1,000, and 1,200-mesh water sandpapers. In groups B and C, the sanded surface was polished using a low-speed electric handpiece with medium, fine, and ultra-fine alumina polishing discs (5,000 rpm for 20 s); the thickness error was controlled within ±0.01 mm by a digital caliper. Finally, the specimens were cleaned using supersonic waves for 5 minutes. All specimens were stored in a 37°C water bath for 24 h after preparation.
Preparation of the Background Porcelain Block
Round zirconia ceramic tiles (A2 color) with a diameter of 10 mm and a thickness of 3 mm were made as the background for the specimen color measurement. Any one side of each tile was selected as the measured surface and polished with 400- and 600-mesh water sandpapers successively.
Color System
The CIE L*a*b* standard color system was used in this study. The value of L* represents visual lightness, which ranges from 0 (complete black) to 100 (complete white), with increasing value indicating whiteness shift and decreasing value indicating blackening. The value of a* represents the degree of redness and greenness, with a positive change indicating redness shift and a negative change indicating greenness shift. The value of b* represents the degree of yellowness and blueness, with a positive change indicating yellowness shift and a negative change indicating blueness shift. The ΔE00 value represents the color difference between objects (Ardu et al., 2017).
Hardness Measurement
The Vickers hardness of each specimen was measured using a digital microhardness tester (load 200 g; time 15 s; 20 × magnifying lens). Three measurement points were selected for the polished surface of each specimen, and the average value of the three points was adopted as the specimen’s hardness value (Kaminedi et al., 2014).
Aging Test Standard
The American Society for Testing and Materials (ASTM) G155 Cycle 1 standard was adopted to test the aging of the specimens. A xenon arc light filtered by borosilicate glass [intensity 35 W m−2·nm−1, wavelength 340 nm; blackboard temperature (63 ± 2)°C] was used. The cycle was set to 102 min of illumination at 50% humidity and 18 min of illumination with water spray. The total aging time was 120 h, and the total energy was 150 kJ (Glaskova-Kuzmina et al., 2020).
Experimental Procedure
The specimens in group A were dried with an air gun, polished surface upwards, before being placed onto the polished surface of a zirconia ceramic block. A spectrophotometer was then used to measure the L*, a*, and b* values of each specimen, with L0, a0, and b0 being used as the initial baseline data for chromaticity. The hardness values of the specimens in group B were measured using a digital microhardness tester, with H0 being used as the initial baseline data for hardness. The specimens of groups A and C were then placed into the aging instrument (the aging light only irradiated the polished surface of the specimens). After aging, the L*, a*, and b* values of the specimens in group A (denoted as L1, a1, and b1) and the hardness of the specimens in group C (denoted as H1) were measured again under the same conditions. Through Eq. 1, the lightness change value ΔL, red and green product change value Δa, yellow and blue product change value Δb before and after aging of group A were calculated. Through CIEDE2000 Eq. 2 (Sharma et al., 2005), the color difference value ΔE00 of group A samples before and after aging was calculated. Through Eq. 3, the hardness change value ΔH and the percentage of hardness change of samples before aging (group B) and after aging (group C) were calculated.
Statistical Analysis
SPSS 22.0 statistical software was used for statistical analysis. Kruskal-Wallis Test was used to compare the values of ΔL, Δa, Δb and ΔE00 among groups. One-way analysis of variance and Tukey Test were used to compare the H0 values among groups. Independent sample t test was used to compare the hardness changes of each group before and after aging. Spearman correlation Test was used to analyze the correlation between the color difference ΔE00 and the percentage of hardness change of four kinds of nano-composite resins after aging. The test level was α = 0.05 on both sides.
Results
Changes of Chromaticity Values Before and After Aging in Each Group
The changes of chromaticity values of each group before and after aging are shown in Table 2. The results showed that the L* values of all the materials groups decreased after aging, and there was significant difference in the L* values among all groups (p < 0.05). a* value was increased in FZ, SD and GD groups, but decreased in CM group. There was no significant difference between GD and SD groups (p > 0.05), but there was significant difference among other groups (p < 0.05). b* value was increased in FZ and GD groups, but decreased in SD and CM groups. Except for no significant difference between FZ and SD groups (p > 0.05), there were significant differences among other groups (p < 0.05).
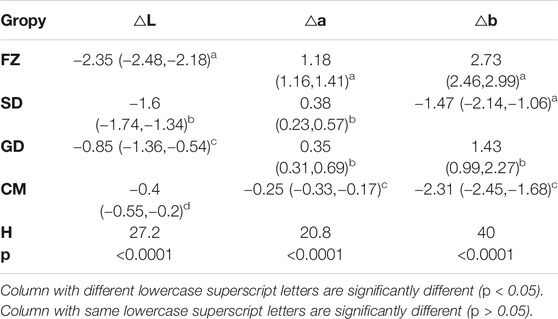
TABLE 2. Change of colorimetric value before and after aging in each group.
Changes in Specimen Hardness After Aging
Hardness values of each group before and after aging are shown in Table 3. Kruskal-Wallis Test showed that the data of each group were normally distributed with homogeneous variance. One-way analysis of variance and Tukey Test were used to compare the hardness value H0 before aging among each group. The independent sample t test was used to analyze the changes of hardness values after and before aging in each group. The results showed that there was a statistical difference in hardness values H0 before aging among all groups (p < 0.05). Hardness values of all groups after aging were significantly higher than before aging (p < 0.05).
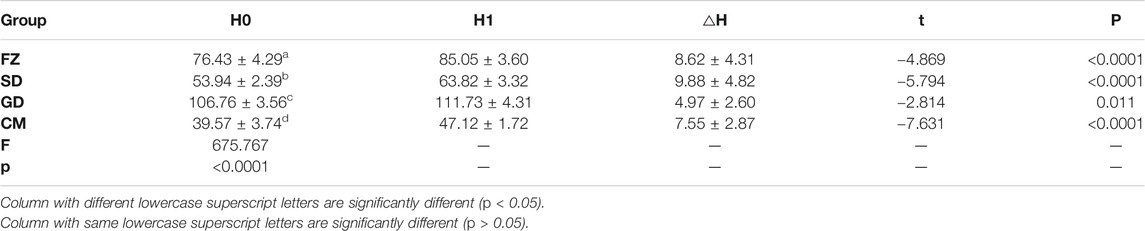
TABLE 3. Change of hardness of specimens before and after aging in each group.
Comparison of Color Difference ΔE00 in Each Group After Aging
The color difference of each group after aging ΔE00 is shown in Table 4.
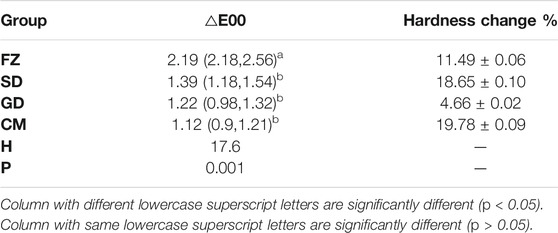
TABLE 4. Color difference ΔE and hardness change percentage after aging in each group.
Kruskal-Wallis Test was used to compare the ΔE00 values between each group. The results showed that the ΔE00 value of each resin material was affected by aging (H = 17.6, p = 0.001). There was statistical difference in ΔE00 value between FZ group and SD, GD and CM groups (p < 0.05), but no statistical difference was found between SD, GD and MC groups (p > 0.05). The FZ group ΔE00 value was greater than 1.8, while the SD, GD and CM groups were all less than 1.8 and greater than 0.8.
Correlation Between Color Difference ΔE00 and Percentage Change of Hardness After Aging in Each Group
The percentage of hardness change after aging in each group is shown in Table 4. Spearman correlation Test was used to analyze the correlation between the color difference ΔE00 and the percentage of hardness change in each group after aging. The results showed that there was no correlation between the color difference ΔE0000 and the percentage change of hardness after aging (r = 0.49, p = 0.763>0.05).
DISCUSSION
The aging method adopted in this experiment includes light, heat, water and other factors, and is more close to the oral environment than single photoaging, water aging and thermal cycling aging. The results of the present study revealed that the Filted Z350 XT resin with the lowest filler content had the highest ΔE00 after aging. This is consistent with the findings of other studies (Eldiwany et al., 1995; Schulze et al., 2003), which concluded that composite resins with a low filler content have a higher ΔE. Further, the present study found that the Filted Z350 XT resin had the largest filler particles and particle clusters, with diameters of 0.6–1.0 microns. One study (Kawaguchi et al., 1994) found that composite resins with larger particles are more easily absorbed by water and undergo greater color change. The reason for this is that a weak matrix–filler interface causes it to be broken by water adsorption, resulting in the propagation path of light in the material being changed by the particles (Vichi et al., 2004). Some studies (Nasim et al., 2010; Erdemir et al., 2012) have also suggested that the porous clusters of glass particles in Filted Z350 XT resin absorb water more readily, so the material is easily dyed but can also change color with ease.
The results of this study show that the ΔE00 value of the Filted Z350 XT group is the highest and greater than 1.8, while the ΔE00 value of the other three groups is all less than 1.8 but greater than 0.8. ΔE00 value greater than 1.8 is considered as a clinically unacceptable color change (Paravina et al., 2015), while a value of ΔE00 value less than 1.8 and greater than 0.8 is considered as a clinically acceptable color change that can be perceived by human eyes (Paravina et al., 2015). The results of this study showed that after aging, Filtek Z350 XT resin had the highest ΔE00 value and was in the clinically unacceptable range (ΔE00 >1.8), which was consistent with the results of Roselino et al. (Roselino et al., 2013). In this study, Z350 was found to have the highest ΔE value in the clinically unacceptable range (ΔE > 3.3) by artificial accelerated aging of two kinds of nano-resins including UV-B, heat and water. However, the results of some studies were different from that of this study. For example Nasim et al. (Nasim et al., 2010) studied the immersion aging of three types of composite resin, and found that the ΔE value of nanocomposite Filtek Z350 was the lowest after immersion aging in water and Pepsi. The ΔE value was the highest in tea, but all of them were lower than 3.3, which was within the clinically acceptable range. In this study, the aging procedure did not include the factor of heat and light, which may be the reason why the results were different from those in this study.
In the clinical selection of suitable restore materials, physical properties are essential as they significantly affect the clinical durability of the prosthesis. Hardness is one of the most important physical properties of restore materials, being closely related to compressive strength, resistance to wear, and degree of polymerization. Evaluation of the mechanical properties of a composite resin surface by measurement of microhardness is widely used in the research of composite resin materials (Pieniak et al., 2020). The present study found that hardness increased in all resin groups after aging, which is consistent with the findings of a previous study (Schulze et al., 2003). In this previous study, the aging process included elements of light, heat, and water. However, in the previous study using thermocycling, the change of the hardness of composite resin showed different results. In the study of Ayatollahi et al. (Ayatollahi et al., 2015), the hardness of conventional composite and nanohybrid composite increased after thermocycling aging. The hardness of nanocomposite (Filtek Z350 XT) increased after thermocycled and immersed in tea, and decreased after thermocycled and immersed in soft drink. Souza et al. (Souza et al., 2010) found in their study that an increase in the hardness of a material called Sinfony was recorded under the influence of hydrothermal loads. In other studies (Pieniak et al., 2012; Tuncer et al., 2013; Pieniak et al., 2020), the hardness of composite resin decreased after thermocycling aging. The hardness of the composite may have been affected by three factors during aging: light, heat, and water. Light and heat can improve the polymerization degree of the resin (Souza et al., 2010), while water can destroy the matrix–filler interface bonding, causing the material surface to soften and become plasticized (Paravina et al., 2015). Water diffusion also leads to swelling of the polymer matrix in resin (Souza et al., 2010; Paravina et al., 2015). While the effect of light and heat can improve a resin’s properties, water can reduce its hardness. However, because light and heat can improve the strength of the bond between the components of a composite resin and reduce the gap between polymer chains, their presence means the diffusion of water molecules in the polymer network is smaller than if there were no light and heat. In the present study, the effect of light and heat on improving the hardness of the resin may have been greater than the effect of water on weakening the hardness of the resin, so the hardness increased as a whole.
The results of this study showed that there was a statistical difference in the hardness value H0 before aging among all groups. The pre-aging hardness of nano-hybird type resins is similar to that of Grandio > Synergy D6> Clearfil Majesty Esthetic, which is 87.0%>80.0%>78.0%. It is suggested that the hardness of Nano-Hybird type resin may be related to the mass percentage of the filler. The hardness value of nano-filled nano-resin Filted Z350 XT does not conform to this rule, suggesting that the hardness of nano-resin materials may be related to the packing particle size distribution range.
Grandio group has the smallest hardness change after aging, which may be related to the highest filler content, but other groups do not show a similar rule, suggesting that the hardness change value of nano-resin materials after aging is not only related to the filler content (Schulze et al., 2003).
There have been many previous studies on the color stability and hardness of composite resins, but few have explored the relationship between them. The results of the present study revealed that there was no correlation between ΔE00 and hardness change percentage in the four nanocomposite resin materials after aging. This is consistent with the results of previous studies (Schulze et al., 2003).
CONCLUSION
Among the four nanocomposite resins tested in this study, except for Filtek Z350 XT’s ΔE00 values (> 1.8) in the clinically unacceptable range, the remaining three kinds of red E00 values (<1.8) were all in the clinically acceptable range. The hardness of the four nanocomposite resins increased after aging. The results of the present study revealed that there was no correlation between ΔE00 and hardness change percentage in the four nanocomposite resin materials after aging.
Data Availability Statement
The original contributions presented in the study are included in the article/Supplementary Material, further inquiries can be directed to the corresponding author.
Author Contributions
LW: Conceptualization, Methodology,Writing –Original Draft Preparation YZ: Formal Analysis, Investigation,Writing –Review and Editing.
Conflict of Interest
The authors declare that the research was conducted in the absence of any commercial or financial relationships that could be construed as a potential conflict of interest.
Publisher’s Note
All claims expressed in this article are solely those of the authors and do not necessarily represent those of their affiliated organizations, or those of the publisher, the editors and the reviewers. Any product that may be evaluated in this article, or claim that may be made by its manufacturer, is not guaranteed or endorsed by the publisher.
References
Ardu, S., Duc, O., Di Bella, E., and Krejci, I. (2017). Color Stability of Recent Composite Resins. Odontology 105 (1), 29–35. doi:10.1007/s10266-016-0234-9
Ayatollahi, M. R., Yahya, M. Y., Karimzadeh, A., Nikkhooyifar, M., and Ayob, A. (2015). Effects of Temperature Change and Beverage on Mechanical and Tribological Properties of Dental Restorative Composites. Mater. Sci. Eng. C 54, 69–75. doi:10.1016/j.msec.2015.05.004
Eldiwany, M., Friedl, K. H., and Powers, J. M. (1995). Color Stability of Light-Cured and post-cured Composites. Am. J. Dent 8, 179–181.
Erdemir, U., Yildiz, E., and Eren, M. M. (2012). Effects of Sports Drinks on Color Stability of Nanofilled and Microhybrid Composites after Long-Term Immersion. J. Dent. 40, 55–63. doi:10.1016/j.jdent.2012.06.002
Ganjkar, M. H., Heshmat, H., Gholamisinaki, M., and Arjomand, M. E. (2017). Effect of Accelerated Aging on the Color Stability of Light-Cured Resin Cement and Flowable Composite through Porcelain Laminate Veneer [J]. J. Islamic Dental Assoc. IRAN 29 (3), 103–109. doi:10.30699/jidai.29.3.103
Glaskova-Kuzmina, T., Aniskevich, A., Papanicolaou, G., Portan, D., Zotti, A., Borriello, A., et al. (2020). Hydrothermal Aging of an Epoxy Resin Filled with Carbon Nanofillers. Polymers 12 (5), 1153. doi:10.3390/polym12051153
Kaminedi, R. R., Penumatsa, N. V., Priya, T., and Baroudi, K. (2014). The Influence of Finishing/polishing Time and Cooling System on Surface Roughness and Microhardness of Two Different Types of Composite Resin Restorations. J. Int. Soc. Prev. Community Dent 4 (Suppl. 2), S99–S104. doi:10.4103/2231-0762.146211
Kawaguchi, M., Fukushima, T., and Miyazaki, K. (1994). The Relationship between Cure Depth and Transmission Coefficient of Visible-Light-Activated Resin Composites. J. Dent Res. 73 (2), 516–521. doi:10.1177/00220345940730020601
Lee, Y.-K., Yu, B., Lim, H.-N., and Lim, J. I. (2011). Difference in the Color Stability of Direct and Indirect Resin Composites. J. Appl. Oral Sci. 19 (2), 154–160. doi:10.1590/s1678-77572011000200012
Moszner, N., and Klapdohr, S. (2004). Nanotechnology for Dental Composites. Ijnt 1 (1), 130–156. doi:10.1504/ijnt.2004.003723
Nasim, I., Neelakantan, P., Sujeer, R., and Subbarao, C. V. (2010). Color Stability of Microfilled, Microhybrid and Nanocomposite Resins-An In Vitro Study. J. Dent. 38 (Suppl. 2), e137–e142. doi:10.1016/j.jdent.2010.05.020
Paravina, R. D., Ghinea, R., Herrera, L. J., Bona, A. D., Igiel, C., Linninger, M., et al. (2015). Color Difference Thresholds in Dentistry. J. Esthet. Restor. Dent. 27 (Suppl. 1), S1–S9. doi:10.1111/jerd.12149
Pieniak, D., Niewczas, A. M., and Kordos, P. (2012). Influence of thermal Fatigue and Ageing on the Microhardness of Polymer-Ceramic Composites for Biomedical Applications. Eksploat. Niezawodn. 14, 181–188.
Pieniak, D., Walczak, A., Walczak, M., Przystupa, K., and Niewczas, A. M. (2020). Hardness and Wear Resistance of Dental Biomedical Nanomaterials in a Humid Environment with Non-Stationary Temperatures. Materials 13 (5), 1255. doi:10.3390/ma13051255
Roselino, L. d. M. R., Cruvinel, D. R., Chinelatti, M. A., and Pires-de-Souza, F. d. C. P. (2013). Effect of Brushing and Accelerated Ageing on Color Stability and Surface Roughness of Composites. J. Dent. 41 (Suppl. 5), e54–e61. doi:10.1016/j.jdent.2013.07.005
Schulze, K. A., Marshall, S. J., Gansky, S. A., and Marshall, G. W. (2003). Color Stability and Hardness in Dental Composites after Accelerated Aging. Dent. Mater. 19 (7), 612–619. doi:10.1016/s0109-5641(03)00003-4
Sharma, G., Wu, W., and Dalal, E. N. (2005). The CIEDE2000 Color-Difference Formula: Implementation Notes, Supplementary Test Data, and Mathematical Observations. Color Res. Appl. 30, 21–30. doi:10.1002/col.20070
Souza, R. O. A., Özcan, M., Michida, S. M. A., de Melo, R. M., Pavanelli, C. A., Bottino, M. A., et al. (2010). Conversion Degree of Indirect Resin Composites and Effect of Thermocycling on Their Physical Properties. J. Prosthodont. 19 (3), 218–225. doi:10.1111/j.1532-849x.2009.00551.x
Tuncer, S., Demirci, M., Tiryaki, M., Ünlü, N., and Uysal, Ö. (2013). The Effect of a Modeling Resin and Thermocycling on the Surface Hardness, Roughness, and Color of Different Resin Composites. J. Esthet. Restor. Dent. 25, 404–419. doi:10.1111/jerd.12063
Vichi, A., Ferrari, M., and Davidson, C. L. (2004). Color and Opacity Variations in Three Different Resin-Based Composite Products after Water Aging. Dent. Mater. 20 (6), 530–534. doi:10.1016/j.dental.2002.11.001
Vidal, M. L., Pecho, O. E., Xavier, J., and Della Bona, A. (2020). Influence of the Photoactivation Distance on the Color and Whiteness Stability of Resin-Based Composite after Bleaching and Aging. J. Dent. 99, 103408. doi:10.1016/j.jdent.2020.103408
Keywords: aging, nanocomposite resin, color difference, color stability, hardness
Citation: Wang L and Zheng Y (2021) The Impact of Artificial Aging on the Color Stability and Hardness of Nanocomposite Resin. Front. Mater. 8:722131. doi: 10.3389/fmats.2021.722131
Received: 08 June 2021; Accepted: 19 July 2021;
Published: 12 August 2021.
Edited by:
David K. Mills, Louisiana Tech University, United StatesReviewed by:
Mojgan Heydari, Materials and Energy Research Center, IranPayam Zarrintaj, University of Montana, United States
Copyright © 2021 Wang and Zheng. This is an open-access article distributed under the terms of the Creative Commons Attribution License (CC BY). The use, distribution or reproduction in other forums is permitted, provided the original author(s) and the copyright owner(s) are credited and that the original publication in this journal is cited, in accordance with accepted academic practice. No use, distribution or reproduction is permitted which does not comply with these terms.
*Correspondence: Likai Wang, d2FtZ2xpa2FpQDIxY24uY29t
†These authors have contributed equally to this work