
94% of researchers rate our articles as excellent or good
Learn more about the work of our research integrity team to safeguard the quality of each article we publish.
Find out more
MINI REVIEW article
Front. Mater. , 06 August 2021
Sec. Structural Materials
Volume 8 - 2021 | https://doi.org/10.3389/fmats.2021.716967
 João Carlos Ferreira1
 Francisco Romario de Sousa Machado1
 Clodualdo Aranas2
 Fulvio Siciliano1,3
 Jubert Pasco2Gedeon Silva Reis1
 Edson Jansen Pedrosa de Miranda1Antônio Ernandes Macêdo Paiva1
 Samuel Filgueiras Rodrigues1*
In this work, the presence of dynamically formed ferrite above the Ae3 temperature during the physical simulation of hot rolling was presented. This unusual metallurgical process is known as dynamic transformation (DT). The metastable ferrite phase undergoes a reverse transformation when the temperature is held above the Ae3 by means of a diffusion process. These phenomena affect the rolling load during high-temperature plate rolling. Therefore, a linepipe X70 steel was studied under plate rolling with two-pass roughing and seven-pass finishing strains of 0.4 and 0.2, respectively, applied at strain rate of 1 s−1 and interpasses of 10, 20, and 30 s. The samples were cooling down during deformation, which mimics the actual industrial hot rolling. It was observed that the alloy softens as the hot rolling progresses, as depicted by flow curves and mean flow stress plots, which are linked to the combined effects of dynamic transformation and recrystallization. The former initially occurs at lower strains, followed by the latter at higher strains. The critical strain to DT was affected by the number of passes and temperature of deformation. Shorter interpass time allows higher amounts of ferrite to form due to higher retained work hardening. Similarly, the closer the deformation temperature to the Ae3 permits a higher DT ferrite fraction. The information from this work can be used to predict the formation of phases immediately after hot rolling and optimize models applied to the accelerated cooling.
Recently, significant progress has been made in understanding the mechanisms associated with the dynamic transformation (DT) of austenite into ferrite in the single austenite phase field (Ghosh et al., 2016). Specifically, the significance of DT during industrial hot rolling was identified based on its influence on the microstructure (Rodrigues et al., 2016; Carneiro et al., 2020; Siciliano et al., 2020). For example, ferrite has lower peak stress than austenite; thus, the former is a softer phase that affects deformation loads. These factors must be appropriately accounted for to avoid any manufacturing issues and inaccurate prediction of the final product’s dimensions and mechanical properties (Jonas et al., 2013; Aranas et al., 2020). Moreover, DT can also be exploited to fabricate steels with ultra-fine ferrite (UFF) grains (Zhao et al., 2018), known to possess superior mechanical properties. Therefore, by exploring the exact effect of DT, the mechanical properties of the steel can further be optimized without altering its chemical composition.
Some studies related to DT’s effect during hot rolling have become available in the literature (Aranas et al., 2015a; Aranas et al., 2015b). Their results show considerable formation of DT ferrite (about 30%) after a seven-pass hot strip rolling above the Ae3 temperature. Here, it has been established that despite the formation of DT ferrite, the occurrence of reverse transformation cannot be avoided between passes. The longer time between passes allows nucleation and growth of ferrite, which translates to a higher fraction of DT ferrite. These metallurgical phenomena were explained by Aranas et al. (2015) using the concept of transformation softening to determine the thermodynamic driving force to transformation.
The strip rolling studies above were eventually followed by plate rolling research by Rodrigues et al. (2016), Rodrigues et al. (2017a), Rodrigues et al. (2017b), Rodrigues et al. (2018), who showed more comprehensive industrial implications of DT. In this work, it was concluded that roughing passes affect the final volume fractions of ferrite. The size of austenite grain size before finishing passes affects the extent of DT ferrite formation. Despite significant work related to the plate rolling process, most of these studies are constrained to quantifying DT ferrite during isothermal hot rolling. Therefore, DT phases must be measured during the physical simulation of hot plate rolling that employs continuous cooling, similar to the industrial process (Rodrigues et al., 2019).
The current work addresses the knowledge gap in the literature by performing a physical simulation of hot plate rolling, applying continuous cooling conditions. Then, DT ferrite was measured, with the aim of assessing and estimating the DT ferrite when an X70-type steel grade is manufactured. This information will allow for a more optimized process of manufacturing X70 steels to maximize their strength.
The material in this work is an X70-type steel grade with the chemical composition shown in Table 1. The transformation temperatures were assessed through JMatPro v12 thermodynamic simulation software employing the General Steel module in the Alloy Design and Materials Testing Research Laboratory at the University of New Brunswick. The steel samples were then machined into torsion samples. In all the samples, the direction of rolling was kept parallel to their lengths.

TABLE 1. The chemical composition (mass%) and transformation temperatures of the present X70 steel.
A modified MTS torsion machine fitted with an infrared radiation furnace was utilized for the physical simulation of hot plate rolling. A K-type thermocouple was welded on the surface of the sample to ensure accurate temperature readings during continuous cooling tests. The torsion samples were enclosed in a quartz tube to keep the argon gas inside the testing area; this is designed to minimize the possibility of decarburization and oxidation at elevated temperatures.
A heating rate of 1°C/s was employed until the sample reached the austenitization temperature of 1,200°C. The temperature was held for 20 min, followed by cooling at a rate of 1°C/s until a roughing pass temperature of 1,100°C was achieved. Then, the temperature was kept for 60 s for homogenization before applying two rouging passes. The time interval between passes is 120 s. Here, a roughing pass strain of 0.4 and strain rate of 1 s−1 were employed.
After the roughing passes, the samples’ temperature was kept at 1,100°C for 60 s, followed by cooling at 1°C/s until a temperature of 920°C was attained. Then, a seven-pass finishing deformation was applied while the sample is cooling. Three cooling rates were employed: 1) 1.5°C/s, 2) 0.75°C/s, and 3) 0.5°C/s. The cooling rates were selected to attain the same deformation temperatures (with temperature intervals of 15°C) for all the simulations, equivalent to interpass times of 10, 20 and 30 s. For reference, the deformation temperature of the 6th and 7th passes are 845°C an 830°C, respectively, which are below the Ae3. The finishing deformation strain was 0.2 applied at a strain rate of 1 s−1. Water quenching was performed to capture the microstructure at the selected temperature and allow for quantification of DT ferrite. Here, the cooling rate of water quenching is about 500°C/s. This rate is proven to be enough to avoid statically formed ferrite during quenching. The samples were quenched before and after the 1st, 3rd, 5th and 7th passes to understand the evolution of microstructure. The thermomechanical schedule of the present physical simulation is presented in Figure 1.
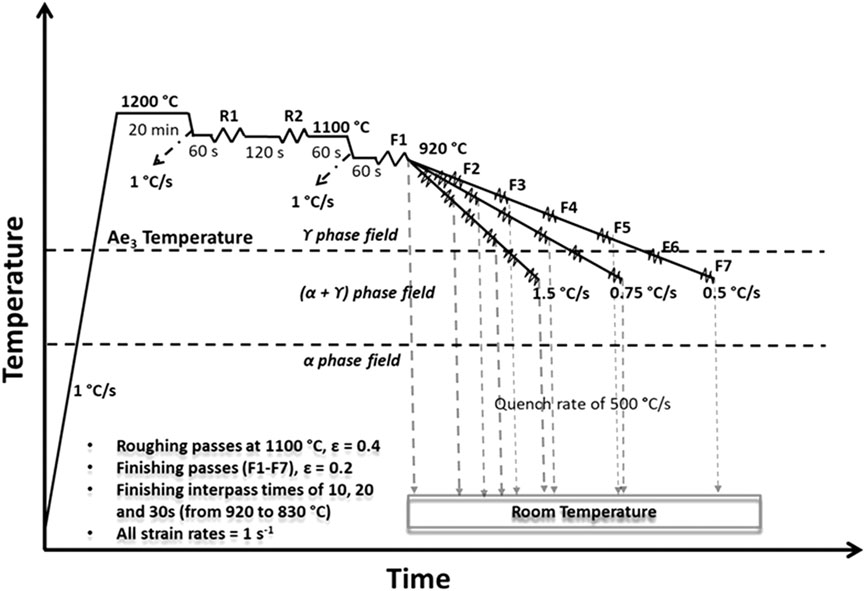
FIGURE 1. The thermomechanical schedule of the present physical simulation employing continuous cooling scenario.
The deformed samples underwent metallography; specimens were sectioned longitudinally coinciding with the torsion direction to provide cross-sections for microstructural examination, mounted, and polished. Polishing involves grinding the surface with SiC papers with grits of 400, 600, 800, and 1,200 with continuously running water that acts as a lubricant. The fine polishing employs a diamond paste; 3 and 1 μm diamond suspensions were utilized to obtain a mirror finish surface. After metallographic preparation, samples were etched using 2% nital followed by 10% aqueous metabisulfite (Na2S2O5) solution. The former is to reveal the grain boundaries, while the latter is to separate ferrite from martensite phase. The three different optical micrographs per test condition were then analyzed using the ImageJ software to measure the phase fractions.
The stress-strain curves of the seven-pass finishing schedule of the physical simulation of hot plate rolling are presented in Figure 2. The orthoequilibirum Ae3 is highlighted to provide a reference to temperatures below the Ae3 (6th and 7th pass). Note that the tests associated with interpass times of 10 s (Figure 2A), 20 s (Figure 2B) and 30 s (Figure 2C) cover the temperature above and below the Orthoequilibrium Ae3 transformation temperature. Here, the deformation of the first pass is 920°C (75°C above the Ae3) while the final pass deformation temperature is 830°C (15°C below the Ae3).
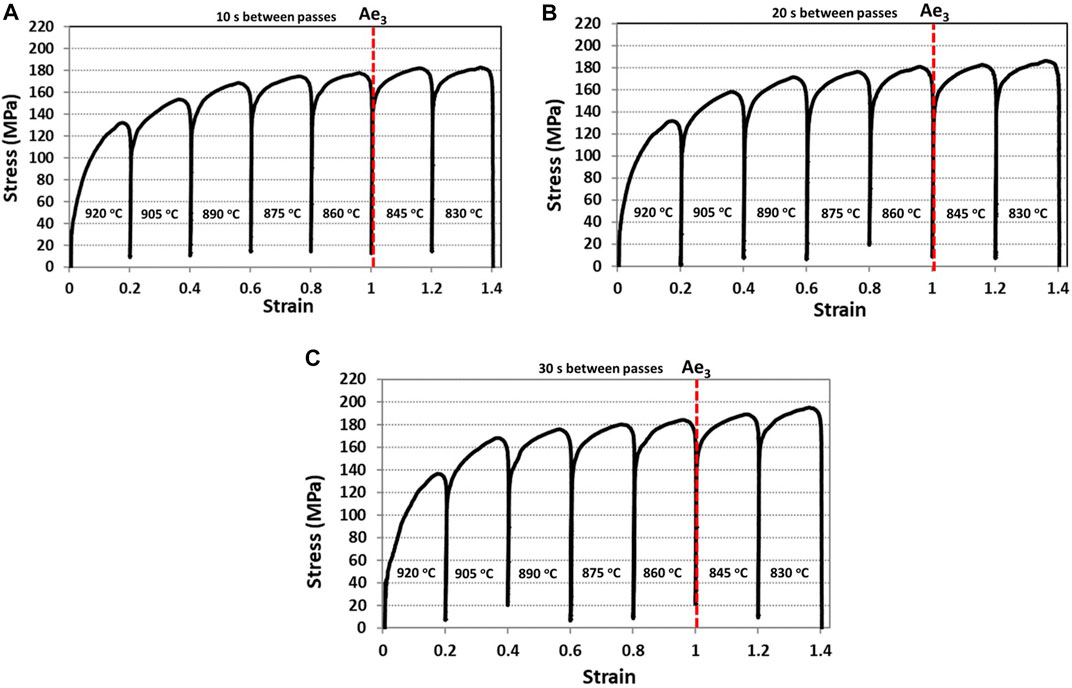
FIGURE 2. The flow curves of the seven-pass finishing schedule of the physical simulation of hot plate rolling with Interpass times of: (A) 10 s, (B) 20 s, and (C) 30 s.
The simulation with 10 s interpass interval, as shown in Figure 2A, depicts an increase in stress from the first going into the third pass. However, the trend changes from third until the last pass. The rate of increase in stress is much lower until the stress achieves a steady-state condition at 180 MPa. Here, the flow stress increase from one pass to another is related to the strain hardening; the dislocation piles up upon continued straining (Gosh et al., 2016; Grewal et al., 2016). Interestingly, the results of the simulation with 10 s interpass time is somewhat different than the ones obtained from 20 to 30 s simulations. In Figures 2B,C, the stress level is higher. The rate of increase from one pass to another increases until the last pass, and no evident steady-state stress is achieved. It seems that the 10 s simulation activated more softening events than the longer interpass intervals, which can be due to the formation of a softer ferrite phase (known as dynamic transformation) and metadynamic recrystallization. The longer interpass intervals allow the reverse transformation of DT ferrite back into austenite. Therefore, higher stress levels were measured for simulations with interpass times of 20 and 30 s.
The softening behavior of X70 steel during the simulation was further evaluated by calculating the mean flow stress (MFS) (Siciliano and Jonas, 2020). The value of MFS relies heavily on deformation temperature, strain, and strain rate. The calculated MFS from the data of Figure 2 is presented in Figure 3. For reference, the transformation temperature of the material is marked with a broken red line.
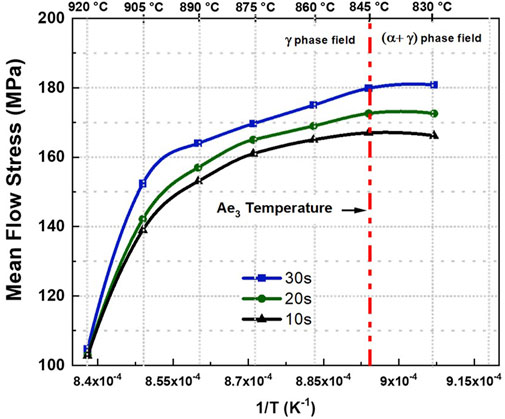
FIGURE 3. The calculated mean flow stress (MFS) of X70 during the physical simulation of hot plate rolling. The increase and decrease in MFS can be associated with strain accumulation and activation of softening phenomena such as phase transformation and recrystallization.
The calculated MFS drastically increases from the first going into the second pass. This observation applies to all the simulations (interpass times of 10, 20 and 30 s). Here, the increase in MFS is about 42%, which is directly associated with strain hardening that leads to a higher amount of dislocations. For 10 s simulation, the increase in MFS from the second pass is only about 1%; alternatively, due to the insignificant increase, it can be concluded that the MFS achieved a steady-state condition in the last pass. For 20 s simulation, the MFS increase from the second pass is slightly higher, 3.2%, and achieves a constant value in the last two passes. A similar trend in MFS increase was observed when the interpass time was further increased to 30 s.
The low rate of increase in MFS from the second pass indicates that ferrite is being formed progressively; thus, a softer phase is formed, leading to lower MFS. Note that strain accumulation continuously taking place in the austenite phase while a fraction of it transforms to ferrite. The higher MFS values for higher interpass times are related to a lower amount of ferrite formed in 20 and 30 s simulations. Also, the high content of Nb inevitably forms precipitates of this element influencing the behavior of the MFS. This is because the addition of Nb is effective in retarding the retransformation of ferrite into austenite by pinning or solute drag mechanisms (Basabe and Jonas, 2010; Ghosh et al., 2016). Additionally, for these tests, the longer time allows retransformation of ferrite back into the original harder austenite phase (Rodrigues et al., 2017). This is discussed in the microstructural section below.
The data from Figure 2 can be utilized to determine the exact initiation points of DT and DRX; both are considered softening phenomena. This can be achieved by applying the method developed by Poliak and Jonas, known as double differentiation (Fields and Backofen, 1957; Poliak and Jonas, 1996). A MATLAB code was created for this purpose and the data from Figure 2 was used as an input. The output is displayed in Figure 4A, where—(dθ/dσ) versus σ plot for simulation with interpass time 30 s is analyzed. The minima are associated with the start of DT and DRX; the former is activated at lower strains and stress, as shown in the literature (Gosh et al., 2016; Gosh et al., 2013).
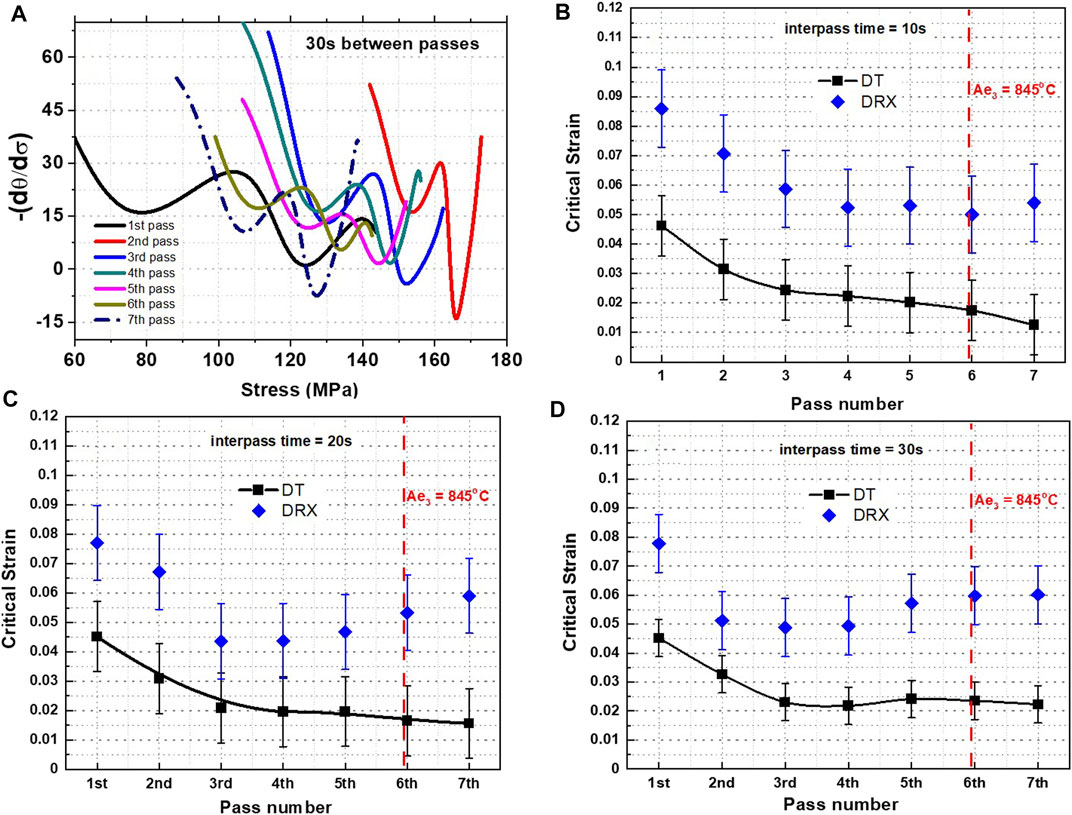
FIGURE 4. (A) A plot of—(dθ/dσ) vs. σ curves for 30 s simulation after applying the double differentiation method. The critical strains were then identified for simulation with interpass times of: (B) 10 s, (C) 20 s and (D) 30 s.
The calculated critical strains are presented in Figures 4B–D for simulations with interpass times of 10, 20 and 30 s, respectively. For all the simulations, it is observed that the critical strain in the first pass is about 0.045. The succeeding passes (up to the 5th pass) yield lower critical stress (approximately 0.020) due to the retained work hardening, which provides an excess driving force to re-initiate DT. This is also the same case for the onset of DRX critical strains. Interestingly, the critical strains for shorter interpass times (for example, 10 s) are lower than that of the values associated with longer interpass times. Similarly, the retained work hardening plays a major role. Short interpass time allows a higher accumulation of dislocation, which equates to higher work hardening. Therefore, the retained work hardening significantly affects the volume fraction of ferrite that forms during the process. Note that the occurrence of DRX onset has been shown in an earlier work of the present authors (Basabe and Jonas, 2010; Ghosh et al., 2016; Rodrigues et al., 2018).
For the critical strains in the 6th and 7th pass, these temperatures are either precisely at the Ae3 or below it. Therefore, a drastic decrease in critical strain is noticeable due to the lower energy required to form ferrite at those temperatures.
The optical microscopy images of the samples after physical simulation with 10 s interpass time are depicted in Figure 5 while for the 20 s interval are shown in Figure 6. The martensite area is defined by the dark regions of the figures. The light regions after the 1st pass (Figure 5A which is the same of 6a) are evident, which are DT ferrite. This area increases from pass to pass, as can be observed from optical microstructures after the 3rd (Figures 5B, 6B), 5th (Figures 5C, 6C), and 7th (Figures 5D, 6D) pass. After the final pass, a significant amount of polygonal ferrite grains are evident; this is due to the application of strain in the two-phase region (below the Ae3). Qualitatively, it is perceived that for the shorter time between passes, the presence of DT ferrite is more pronounced. In previous publications, it can be noted that the microstructures of 30s simulations presented a similar trend but with more dark regions (Rodrigues et al., 2017; Rodrigues et al., 2017).
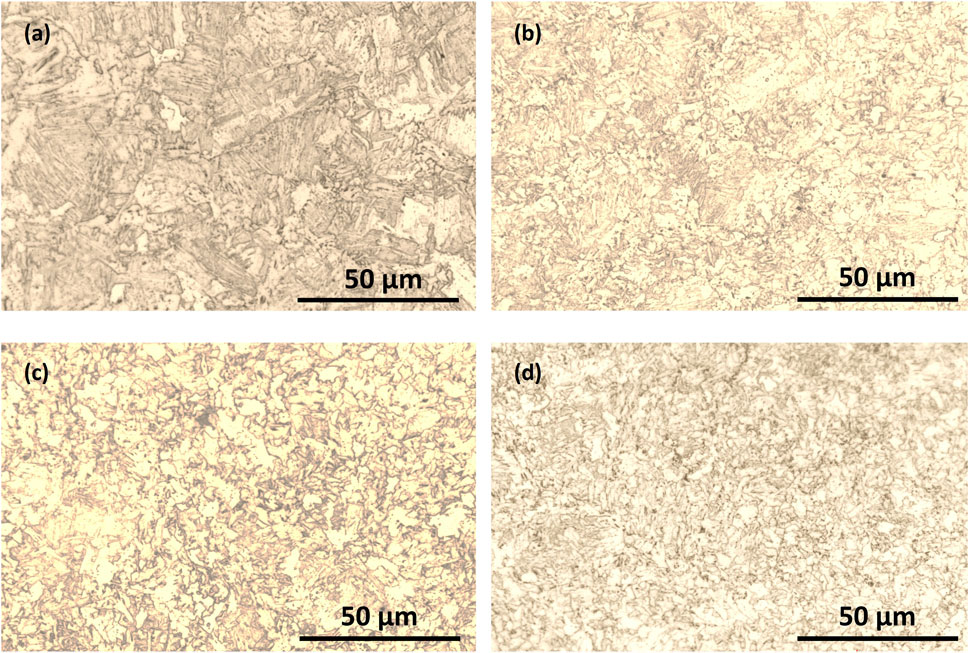
FIGURE 5. The optical microstructures of X-70 steel subjected to interpass time of 10 s. The samples were immediately water quenched after the: (A) 1st, (B) 3rd, (C) 5th and (D) 7th passes.
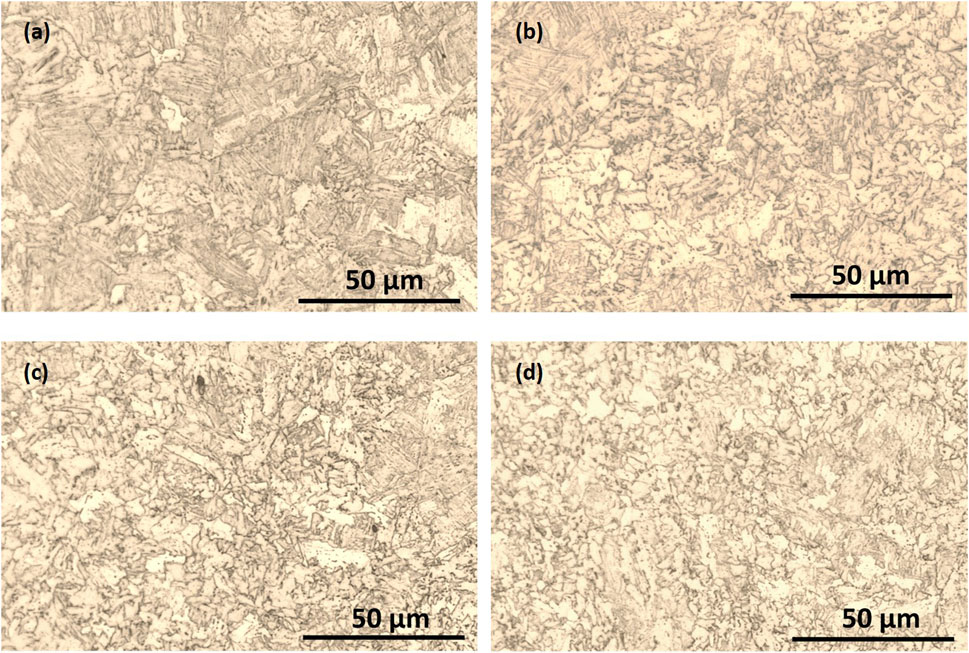
FIGURE 6. The optical microstructures of X-70 steel subjected to interpass time of 20 s. The samples were immediately water quenched after the: (A) 1st, (B) 3rd, (C) 5th and (D) 7th passes.
The scanning electron microscopy images of the sample associated with the 1st and 5th pass during 20s interpass time simulation are presented in Figures 7A,B, respectively. The morphological features validate the presence of both martensite (due to quenching) and DT ferrite (due to deformation). Here, the ferrite is mostly polygonal-shaped, which is the product of coalescence of Widmanstätten plates due to near-identical orientations (Gosh et al., 2016; Rodrigues et al., 2017). Higher strain allows the formation of these polygonal grains. These observations are consistent with other steels investigated in the literature (Gosh et al., 2016; Aranas et al., 2015; Grewal et al., 2016; Ghosh et al., 2013).
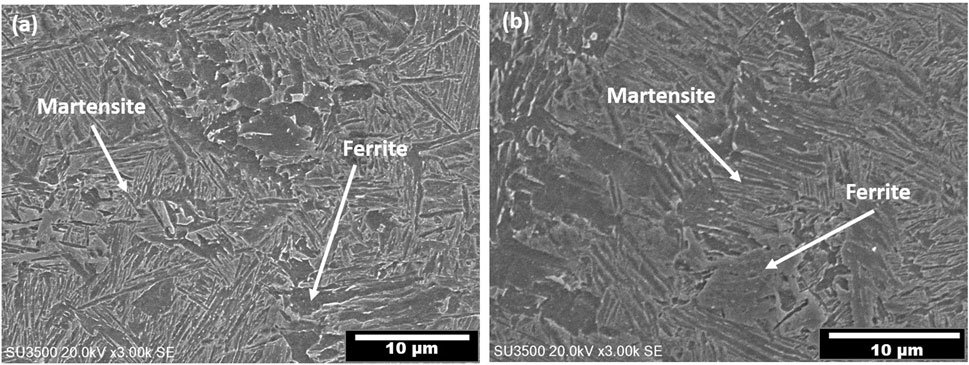
FIGURE 7. The scanning electron micrographs of images of samples after the 5th deformation using interpass times of 20 s.
The optical microstructures were further analyzed to quantify the DT ferrite formed after each pass and are displayed in Figures 8A,B,C for simulations with interpass times of 10, 20, and 30 s, respectively. The information from the plots provides information about the amount of ferrite before and after each pass. It is evident that the ferrite produced and retained from pass to pass increases. The effect of temperature can also be seen; lower temperature leads to higher ferrite fractions. The amount of ferrite in simulations with 10 s interpass time increases more rapidly than longer ones (i.e., 20 and 30 s). Moreover, the roughing passes seem to introduce additional ferrite; despite the deformation temperature is well above the Ae3. Here, 6% of ferrite is present before the 1st pass. The net amount of ferrite formed after each pass was calculated by subtracting the measured ferrite before and after each pass. The results show that about 8.3% of ferrite was formed in the first pass for the 10 s simulation. Generally, higher ferrite was generated for shorter interpass time simulation. In addition, the lower deformation temperature generates more ferrite, as can be seen from the measurements from the last set of passes in the simulations.
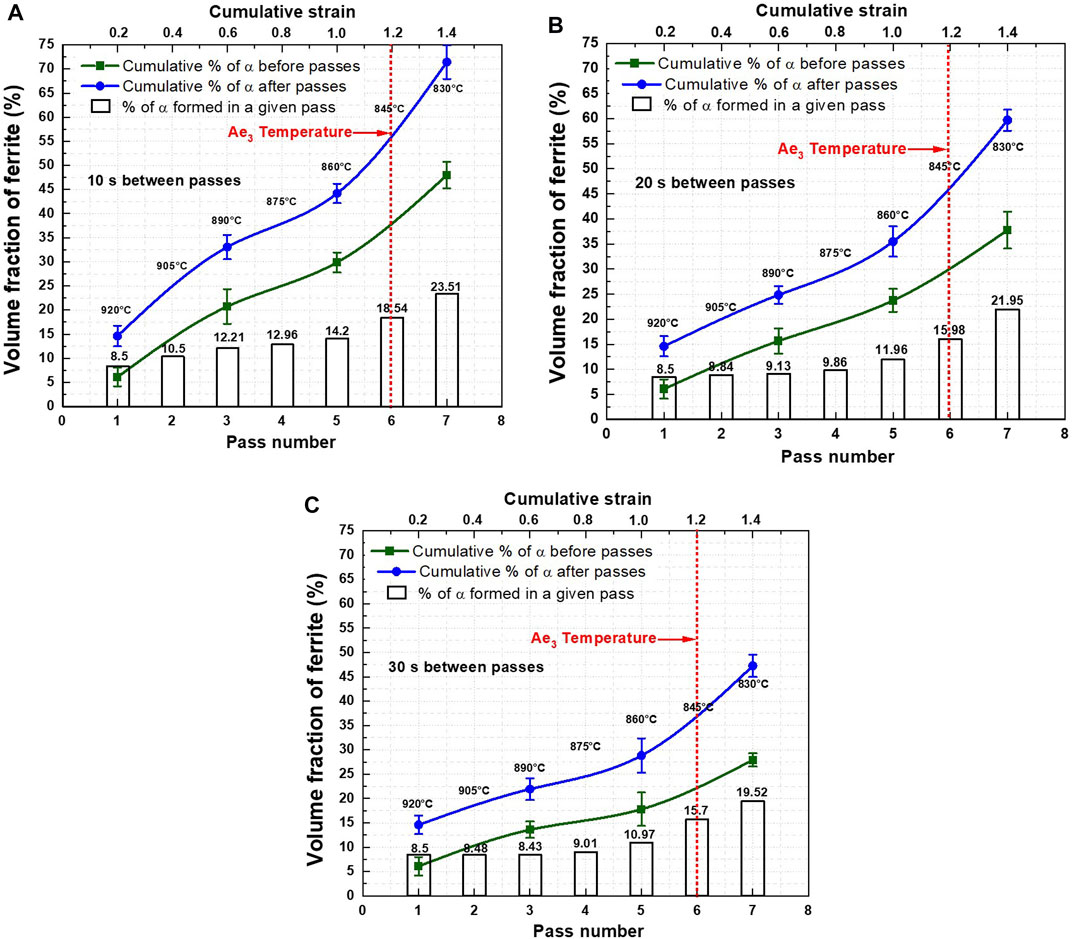
FIGURE 8. The cumulative volume fraction of ferrite before and after each pass for simulations with interpass times of: (A) 10 s, (B) 20 s, (C) 30 s.
In the sixth (at the Ae3) and seventh (15°C below Ae3) passes, the cumulative volume fraction of ferrite were 55 and 72% for 10 s interpass time, 46 and 60% for 20 s interval, 36 and 47% for the 30 s time between passes, respectively. Additionally, more ferrite was formed in these two last passes; see the bars depicted in Figure 6. The behavior is due to the progressive increase in the retained work hardening, which provides the driving force for DT at temperatures above and below the Ae3. Concurrently, there is a reduction of the transformation barriers as the deformation temperature moves closer to the Ae3 temperature (Gosh et al., 2016; Rodrigues et al., 2017; Rodrigues et al., 2020). Note that several authors have shown that it may be possible to initiate DT at any temperature in the single austenite phase field (Grewal et al., 2016; Gosh et al., 2016).
The following are concluded based on the results of the present work:
1) The measured small rate of increase in rolling loads (applicable to all simulation conditions) is due to dynamically transformed ferrite. Here, the MFS in the initial passes drastically increases due to strain accumulation, followed by low rate of increase. The presence of Nb retards the retransformation of ferrite into stable austenite above the Ae3.
2) The calculated values of DT critical strains in the finishing schedule relies on the pass number, temperature and interpass time. A shorter interval provides lower values of DT critical strain, as well as the condition where the temperature is approaching and crossing the Ae3 line.
3) The microstructural observations verified that higher ferrite is formed and retained when shorter interpass times are utilized. This is due to less retransformation of the metastable DT ferrite into the austenite during the shorter interpass times. An opposite behaviour for longer times between passes was observed.
4) The cumulative volume fraction of ferrite increases as the pass number increases, and as the temperature approaches the Ae3 line. The amount of formed ferrite during a particular pass also increases with pass number (i.e., with the retained strain and proximity to the Ae3) and is preferred below the transformation temperature.
The raw data supporting the conclusion of this article will be made available by the authors, without undue reservation.
SR, CA, JF, and FR together proposed this methodology. JF, FR, SR, and CA did analysis and calculations. FS, GR, EP, JP, and AP helped to develop the models. SR, FS, and CA helped to write part of this manuscript. CA, FS, SR, GR, and JP polished and contributed to the final version of the manuscript. SR, FS, and CA supervised the findings of this work. All authors discussed the results and contributed to the final manuscript.
FS was employed by the company Dynamic Systems Inc.
The remaining authors declare that the research was conducted in the absence of any commercial or financial relationships that could be construed as a potential conflict of interest.
All claims expressed in this article are solely those of the authors and do not necessarily represent those of their affiliated organizations, or those of the publisher, the editors and the reviewers. Any product that may be evaluated in this article, or claim that may be made by its manufacturer, is not guaranteed or endorsed by the publisher.
The authors acknowledge the financial support from the Natural Sciences and Engineering Research Council of Canada (NSERC), New Brunswick Innovation Foundation (NBIF) and Harrison McCain Foundation, Research and Support Foundation of Maranhão (FAPEMA).
Aranas, C., and Jonas, J. J. (2015). Effect of Mn and Si on the dynamic transformation of austenite above the Ae3 temperature. Acta Materialia 82, 1–10. doi:10.1016/j.actamat.2014.08.060
Aranas, C., Nguyen-Minh, T., Grewal, R., and Jonas, J. J. (2015a). Flow softening-based formation of Widmanstatten ferrite in a 0.06%C steel deformed above the Ae3. ISIJ Int. 55, 300–307. doi:10.2355/isijinternational.55.300
Aranas, C., Rodrigues, S., Siciliano, F., and Jonas, J. (2020). In-situ X-ray diffraction evidence of dynamic transformation of austenite to ferrite during hot compression test in the single austenite phase field. Scripta Materialia 177, 86–90. doi:10.1016/j.scriptamat.2019.10.008
Aranas, C., Wang, T., and Jonas, J. J. (2015b). Effect of interpass time on the dynamic transformation of a plain C-Mn and Nb-microalloyed steel. ISIJ Int. 5, 647–654. doi:10.2355/isijinternational.55.647
Basabe, V. V., and Jonas, J. J. (2010). The ferrite transformation in hot deformed 0.036% Nb austenite at temperature above the Ae3. ISIJ Int. 50, 1185–1192. doi:10.2355/isijinternational.50.1185
Carneiro, T. B., Rodrigues, S. F., Aranas, C., Siciliano, F., Silva, E. S., Reis, G. S., et al. (2020). Retransformation of dynamically induced ferrite during physical simulation of Steckel mill hot rolling. J. Mater. Res. Tech. 9 (5), 10254–10264. doi:10.1016/j.jmrt.2020.07.042
Fields, D. S., and Backofen, W. A. (1957). Determination of strain hardening characteristics by torsion testing. Proc. Am. Soc. Test. Mater. 57, 1259–1272.
Ghosh, C., Aranas, C., and Jonas, J. J. (2016). Dynamic transformation of deformed austenite at temperatures above the Ae3. Prog. Mater. Sci. 82, 151–233. doi:10.1016/j.pmatsci.2016.04.004
Ghosh, C., Basabe, V. V., Jonas, J. J., Kim, Y.-M., Jung, I.-H., and Yue, S. (2013). The dynamic transformation of deformed austenite at temperatures above the Ae3. Acta Materialia 61, 2348–2362. doi:10.1016/j.actamat.2013.01.006
Grewal, R., Aranas, C., Chadha, K., Shahriari, D., Jahazi, M., and Jonas, J. J. (2016). Formation of Widmanstätten ferrite at very high temperatures in the austenite phase field. Acta Materialia 109, 23–31. doi:10.1016/j.actamat.2016.02.062
Jonas, J. J., Ghosh, C., and Basabe, V. V. (2013). Effect of dynamic transformation on the mean flow stress. Steel Research Int. 84, 253–258. doi:10.1002/srin.201200166
Poliak, E. I., and Jonas, J. J. (1996). A one-parameter approach to determining the critical conditions for the initiation of dynamic recrystallization. Acta Materialia 44, 127–136. doi:10.1016/1359-6454(95)00146-7
Rodrigues, S. F., Aranas, C., and Jonas, J. J. (2017). Dynamic transformation during the simulated plate rolling of a 0.09% Nb steel. ISIJ Int. 57, 1102–1111. doi:10.2355/isijinternational.ISIJINT-2016-678
Rodrigues, S. F., Aranas, C., Siciliano, F., and Jonas, J. J. (2016). Dynamic Transformation during the Simulation of Plate Rolling in an X70 Steel. Steel Research Int. 88, 1600388. doi:10.1002/srin.201600388
Rodrigues, S. F., Aranas, C., Sun, B., Siciliano, F., Yue, S., and Jonas, J. J. (2018). Effect of grain size and residual strain on the dynamic transformation of austenite under plate rolling conditions. Steel Research Int. 89, 1700547. doi:10.1002/srin.201700547
Rodrigues, S. F., Aranas., C., and Jonas, J. J. (2017). Retransformation Behavior of Dynamically Transformed Ferrite during the Simulated Plate Rolling of a Low C and an X70 Nb Steel. ISIJ Int. 57, 929–936. doi:10.2355/isijinternational.ISIJINT-2016-692
Rodrigues, S. F., Carneiro, T. B., Aranas, C., Silva, E. S., Siciliano, F., Reis, G. S., et al. (2019). Induced ferrite formation above the Ae3 during plate rolling simulation of a X70 steel. MRS Adv. 4, 3077–3085. doi:10.1557/adv.2019.343
Rodrigues, S. F., Siciliano, F., Aranas, C., Silva, E. S., Reis, G. S., and Jonas, J. J. (2020). High-Temperature deformation behavior of high-Nb microalloyed steel during plate rolling simulation. Tmm 17, 105–111. doi:10.4322/2176-1523.20202231
Siciliano, F., and Jonas, J. J. (2000). Mathematical modeling of the hot strip rolling of microalloyed Nb, multiply-alloyed Cr-Mo, and plain C-Mn steels. Metall. Mat Trans. A. 31, 511–530. doi:10.1007/s11661-000-0287-8
Siciliano, F., Rodrigues, S. F., Aranas, C., and Jonas, J. J. (2020). The Dynamic Transformation of Ferrite above Ae3 and the Consequences on Hot Rolling of Steels. Tmm 17, 90–95. doi:10.4322/2176-1523.20202230
Keywords: rolling simulation, strain-induced ferrite, dynamic transformation, Ae3 temperature, plate rolling
Citation: Ferreira JC, de Sousa Machado FR, Aranas C, Siciliano F, Pasco J, Reis GS, Pedrosa de Miranda EJ, Macêdo Paiva AE and Rodrigues SF (2021) Physical Simulation Based on Dynamic Transformation Under Hot Plate Rolling of a Nb-Microalloyed Steel. Front. Mater. 8:716967. doi: 10.3389/fmats.2021.716967
Received: 29 May 2021; Accepted: 29 July 2021;
Published: 06 August 2021.
Edited by:
Hui Yao, Beijing University of Technology, ChinaReviewed by:
Pavlo Maruschak, Ternopil Ivan Pului National Technical University, UkraineCopyright © 2021 Ferreira, de Sousa Machado, Aranas, Siciliano, Pasco, Reis, Pedrosa de Miranda, Macêdo Paiva, Rodrigues. This is an open-access article distributed under the terms of the Creative Commons Attribution License (CC BY). The use, distribution or reproduction in other forums is permitted, provided the original author(s) and the copyright owner(s) are credited and that the original publication in this journal is cited, in accordance with accepted academic practice. No use, distribution or reproduction is permitted which does not comply with these terms.
*Correspondence: Samuel Filgueiras Rodrigues, U2FtdWVsLmZpbGd1ZWlyYXNAaWZtYS5lZHUuYnI=
Disclaimer: All claims expressed in this article are solely those of the authors and do not necessarily represent those of their affiliated organizations, or those of the publisher, the editors and the reviewers. Any product that may be evaluated in this article or claim that may be made by its manufacturer is not guaranteed or endorsed by the publisher.
Research integrity at Frontiers
Learn more about the work of our research integrity team to safeguard the quality of each article we publish.